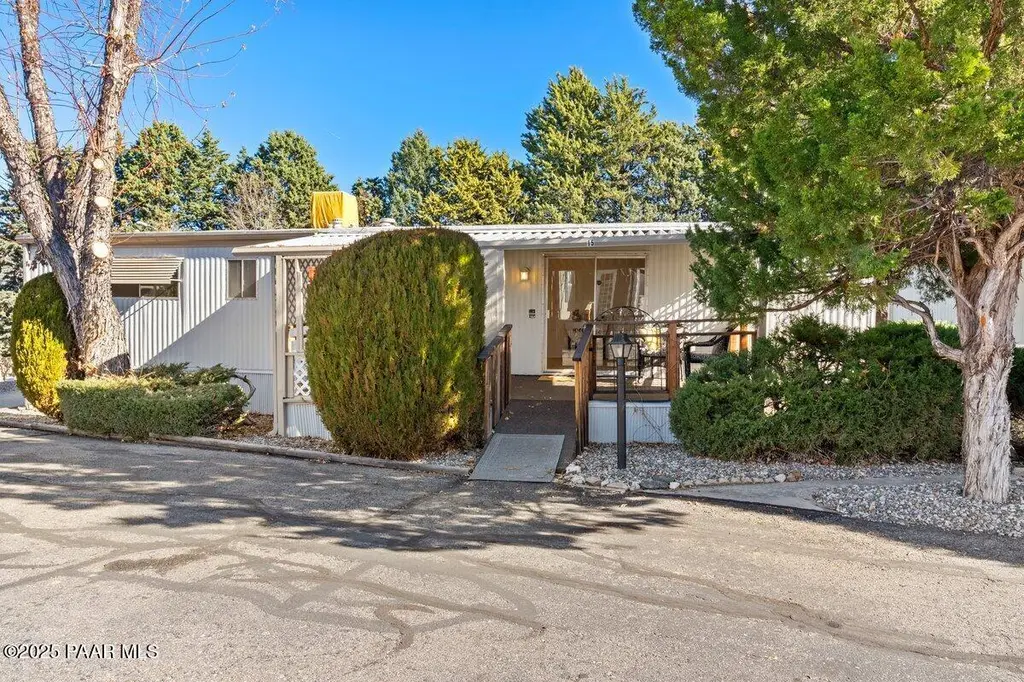
130 N Rush St #15 · Prescott, AZ
Flood risk 8/10 · Major
- FEMA flood zone
- X (unshaded)
- Chance of flooding over 30 yrs
- 0.97%
- Est. flood insurance / yr
- $507 – $1,088
Fire risk 6/10 · Moderate
- Est. fire insurance / yr
- $610 – $1,132
Heat risk 3/10 · Minor
- Hot days now (above 89°F)
- 7 days/yr
- Hot days in 30 yrs
- 17 days/yr
Wind risk 1/10 · Minimal
- Chance of severe wind over 30 yrs
- —
Air-quality risk 1/10 · Minimal
- Unhealthy air days now
- 0 days/yr
- Unhealthy air days in 30 yrs
- 0 days/yr
Risk factors via First Street. Map © Google.
Why this score? — see what drove the B grade
The composite is a weighted blend of 9 inputs, each scored 0–100. Each bar is that input's sub-score; the figure is the points it added to the 100-point composite (weight × sub-score).
- Cash flow +30.0/30.0
- 1% rule +10.0/10.0
- DSCR +10.0/10.0
- ARV discount +7.5/15.0
- Condition / age +4.0/5.0
- Livability +3.7/5.0
- Schools +3.3/10.0
- Rent growth +2.6/5.0
- Appreciation +0.0/10.0
$69,900
🖨 Deal sheet 📄 Offer letter ✓ Due diligence
Listing remarks
Motivated Seller! Super cute 1-bedroom, 1-bath home featuring fresh interior and exterior paint, brand-new luxury vinyl flooring, and a new water heater. Recent upgrades include copper plumbing and a roof covering completed in 2023, giving you peace of mind for years to come. 📍 Conveniently located just 1 mile from downtown Prescott, you'll enjoy easy access to restaurants, shopping, and all the charm the area has to offer. 🌿 Sitting on a nice corner lot, this property boasts a low-maintenance level yard and a handy storage shed. 55+ Community💰 Ask about available financing options--this gem won't last long!
Key facts
- Built 1974
- Listed 188 days
Neighborhood map
What this means for you Summary
Snapshot
- This is a 1-bed/1.0-bath manufactured listed at $70k. Condition is rated good.
Deal economics
- At list price, monthly cash flow is $511 ($6k/yr) — positive.
- The deal already cash-flows at list — no discount required.
- Meets the 1% rule at list price ($1k rent vs $70k).
- Recommended offer: $62k (12.0% below list) — sets the bar for market timing.
- Cap rate 16.2% vs local median 2.4% in Prescott — top-decile yield for the area; either an underpriced asset or a hidden risk that comps aren't pricing in. Stress-test before assuming the spread holds.
Location & tenants
- Location reads 73/100 on livability (#22 in AZ) — a middle-class / working-renter tenant base. Strengths: health & safety A+, amenities A, schools A-; Watch: cost of living D, commute F.
- Prescott Unified District (4466) (urban): math 34% / reading 44% proficiency, ranked #70 of 249 in AZ (top 28%) — families likely to look elsewhere, expect single-tenant / working-renter base with shorter leases.
- Market conditions: Rents flat; 486 active listings in the ZIP; 20 comparable units currently listed for rent nearby; rentals at typical pace (median 21d on market — plan ~3-4 weeks tenant-placement turnaround); 45% of comp listings sitting > 30 days — soft ceiling on asking rent; 2,062 units permitted in Yavapai County in 2024 (98 in 5+ unit buildings).
Forward outlook
- Local home prices are declining (-3.0%/yr); year-one equity from $483 of loan paydown is wiped out by about $2k of value loss. Plan a longer hold.
- Yavapai County population projected at +10% by 2050 — modest demand growth; plan on rents tracking national, not racing it.
- At projected returns (-3.0% appreciation + 0.2% rent growth), your $20k cash investment doubles in ~5 years — after that, you're playing with house money.
Negotiation context
- It's been on market 188 days — a 12% lower offer ($62k) is reasonable based on typical stale-listing flexibility.
- 4 sale attempts since 3y ago; this cycle's ask has dropped $9k (12%) from the opening price — seller is motivated, your offer sets the floor, not the list.
- Current owner paid $54k; 29% above their basis — modest negotiation headroom, anchor on the comps not their cost.
Risks & watch-outs
- Watch-outs: flood insurance adds $66/mo.
- Climate carrying-cost: severe flood risk; major wildfire risk — expect insurance premiums to compound above CPI over the hold.
Questions for the listing agent
- It's been on market 188 days. Have you received any prior offers? Is the seller open to a 12% concession, seller financing, or rate buy-down credit?
- Built in 1974 — when were the roof, HVAC, electrical panel, plumbing, and water heater last replaced?
- What's the actual annual flood-insurance premium (NFIP or private), and is the property in a SFHA with mandatory coverage?
- Why hasn't it sold? Are there any deal-killer items the seller is aware of (foundation, flood, title, zoning, code violations)?
- Is there a deadline driving the sale (1031 exchange, divorce, estate, relocation)? That informs how much negotiation room exists.
- Schools are A-rated — typically a magnet for longer-tenancy family renters. What's the average tenant stay here, and is there a school-zone premium baked into asking?
- What's the average days-on-market for RENTAL listings here right now (not sales)? A rising rental-DOM trend means longer vacancies and softer asking-rent achievability than the comps imply.
- What's the recent tenant-quality profile in this submarket — average credit score on applications, eviction rate, late-payment / NSF rate, and stable-employment percentage? A property-management company in the area should have these aggregated.
- How much new for-sale + rental construction is in the pipeline within 1–3 miles? Heavy new supply typically softens prices + rents 12–24 months out; constrained supply supports both.
Investment metrics
- 1% rule
- 1.92% ✓
- Cap rate
- 16.20%
- Cash-on-cash
- 35.38%
- DSCR
- 2.57
- GRM
- 4.3
CMA / ARV
- ARV (median comp)
- $342,776
- List price
- $69,900
- Delta
- -79.61%
- Verdict
- UNDERPRICED
- Comps
- 8 within 1.0 mi
Show comp detail 1 sale within ~0.75 mi
| Address | Dist | Beds/Ba | Sqft | Sold | Price | $/sf | Match |
|---|---|---|---|---|---|---|---|
| 130 N Rush St #4 | 0.00mi | 1/1.0 | 600 (-4%) | 16mo | $81,750 | $136 | 80 |
Match score weights: distance 35% · size 25% · config 20% · recency 20%. Top-matched comps best support the ARV.
Projected returns pro-forma
-3.0% appreciation · 0.21% rent growth · sell at horizon
- IRR
- 22.8%
- Equity multiple
- 1.90×
- Total profit
- $17,592
- Equity at exit
- $10,422
- IRR
- 28.8%
- Equity multiple
- 3.21×
- Total profit
- $43,223
- Equity at exit
- $6,044
Cash invested: $19,572 (down + closing). Projections, not guarantees.
Landlord ↔ Tenant lean methodology
- Overall (STATE)
- 87 Strongly Landlord-Friendly
- State Arizona
- 87 Strongly Landlord-Friendly · R+3
- County
- — inherits STATE
- City
- — inherits STATE
ZIP-level market 86301
- Home prices YoY
- -21.8%
- Rents YoY
- 0.2%
- Active inventory
- 486
- Price-to-rent
- 4.3×
Monthly cashflow live
- Estimated rent
- $1,342 high interval (Pro) →
- Mortgage (P&I)
- −$367
- Tax est. 1.5%
- −$87 /mo · $1,048/yr
- Insurance
- −$29
- Flood insurance flood zone
- −$66 /mo · $798/yr
- HOA
- −$0
- Vacancy / Maint / Mgmt
- −$282
- Net cashflow
- $511
Break-even live
UW: 25.0% down · 7.5% · 30yr · 1.5% tax · 5.0% vac · 8.0% maint · 8.0% mgmt
Financing live
Cash to close
- Down payment
- $17,475
- Closing costs
- $2,097
- Reserves months
- —
- Total cash needed
- —
Loan-product check · same deal, 3 products live
Conventional
25% down · 7.5% · 30yr
- Down + closing
- —
- Monthly P&I
- —
- Monthly cashflow
- —
- DSCR
- —
- Eligible?
- —
Personal DTI + credit; lowest rate.
DSCR
20% down · 8.5% · 30yr
- Down + closing
- —
- Monthly P&I
- —
- Monthly cashflow
- —
- DSCR
- —
- Eligible?
- —
No personal income docs; deal must DSCR.
Hard money
10% down · 12.0% · 12mo
- Down + closing
- —
- Monthly P&I
- —
- Monthly cashflow
- —
- DSCR
- —
- Eligible?
- —
Short-term bridge; refi at stabilization.
Rent comps 20 comps
| Address | Beds | Baths | Sqft | Rent | $/sqft | DOM | Units | Dist |
|---|---|---|---|---|---|---|---|---|
| 135 S Arizona Ave Unit 1/2 Prescott, AZ | 1.0 | 1.0 | 550 | $1,600 | $2.91 | 43d | 1 | 0.18mi |
| 606 E Willis St Prescott, AZ | 1.0 | 1.0 | 604 | $1,225 | $2.03 | 21d | 1 | 0.26mi |
| 109 N Pleasant St Unit C Prescott, AZ | 1.0 | 1.0 | 750 | $1,395 | $1.86 | 43d | 1 | 0.42mi |
| 314 S Virginia St #2 Prescott, AZ | 1.0 | 1.0 | 700 | $950 | $1.36 | 43d | 1 | 0.49mi |
| 403 S Pleasant St Prescott, AZ | 1.0 | 1.0 | 750 | $1,475 | $1.97 | 43d | 1 | 0.64mi |
| 123 N Cortez St Unit 223 Prescott, AZ | 1.0 | 1.0 | 650 | $1,295 | $1.99 | 21d | 1 | 0.65mi |
| 123 N Cortez St Unit 222 Prescott, AZ | 1.0 | 1.0 | 385 | $1,145 | $2.97 | 21d | 1 | 0.65mi |
| 129 N Cortez St Prescott, AZ | 1.0 | 1.0 | 292 | $1,225 | $4.19 | 44d | 3 | 0.65mi |
| 129 N Cortez St Unit 223 Prescott, AZ | 1.0 | 1.0 | 650 | $1,295 | $1.99 | 21d | 1 | 0.66mi |
| 129 N Cortez St Unit 222 Prescott, AZ | 1.0 | 1.0 | 385 | $1,195 | $3.10 | 21d | 1 | 0.66mi |
| 320 S Cortez St Unit 5 Prescott, AZ | — | 1.0 | 615 | $1,435 | $2.33 | 21d | 1 | 0.79mi |
| 601 S Cortez St Prescott, AZ | — | 1.0 | 445 | $1,100 | $2.47 | 13d | 1 | 1.00mi |
| 408 Madison Ave #4 Prescott, AZ | 2.0 | 1.0 | 680 | $1,200 | $1.76 | 21d | 1 | 1.03mi |
| 410 Madison Ave Unit 3 Prescott, AZ | 2.0 | 1.0 | 680 | $1,200 | $1.76 | 43d | 1 | 1.05mi |
| 570 1st St Apt C Prescott, AZ | 2.0 | 1.0 | 705 | $1,050 | $1.49 | 43d | 1 | 1.06mi |
| 603 Campbell St Apt 01 Prescott, AZ | 2.0 | 1.0 | 720 | $1,000 | $1.39 | 43d | 1 | 1.10mi |
| 601 Campbell St Apt 3 Prescott, AZ | 2.0 | 1.0 | 720 | $1,000 | $1.39 | 43d | 1 | 1.10mi |
| 610 S Granite St Prescott, AZ | 1.0 | 1.0 | 546 | $1,100 | $2.01 | 13d | 1 | 1.19mi |
| 301 W Merritt St Unit 303-A Prescott, AZ | 2.0 | 1.0 | 650 | $1,250 | $1.92 | 21d | 1 | 1.21mi |
| 824 W Gurley St Prescott, AZ | 1.0–2.0 | 1.0 | 711 | $1,175 | $1.65 | 21d | 2 | 1.39mi |
Listing history 28 events
-
2026-06-18days on market $69,900 Active 188 DOM
-
2026-06-17days on market $69,900 Active 187 DOM
-
2026-06-16days on market $69,900 Active 186 DOM
-
2026-06-15days on market $69,900 Active 185 DOM
-
2026-06-14days on market $69,900 Active 183 DOM
-
2026-06-13days on market $69,900 Active 182 DOM
-
2026-06-10days on market $69,900 Active 180 DOM
-
2026-06-09days on market $69,900 Active 179 DOM
-
2026-06-08days on market $69,900 Active 178 DOM
-
2026-06-07days on market $69,900 Active 177 DOM
-
2026-06-05days on market $69,900 Active 174 DOM
-
2026-06-02days on market $69,900 Active 172 DOM
-
2026-06-01days on market $69,900 Active 171 DOM
-
2026-05-31days on market $69,900 Active 170 DOM
-
2026-05-30days on market $69,900 Active 169 DOM
-
2026-04-30price $71,900
-
2026-02-27price $74,900
-
2025-12-12$79,000 Active
-
2025-11-01historical
-
2025-07-25price $87,900
-
2025-06-05price $89,900
-
2025-05-18price $92,500
-
2025-04-24$94,500 Active
-
2023-12-15soldstatus $54,000 Closed
-
2023-12-01status Pending
-
2023-11-16status Active
-
2023-10-20status Pending
-
2023-10-12$65,000 Active
ⓘ Source: listings_history table (triggers on properties + properties_extension) + one-shot
backfill from property_details.listing_events for pre-trigger history.
Climate risk First Street
- Flood 8/10 Severe FEMA zone X (unshaded) · 97% chance over 30 yrs
- Wildfire 6/10 Major
- Heat 3/10 Moderate 7 d/yr ≥89°F today · 17 d/yr by 30 yrs out
- Wind 1/10 Low
- Air quality 1/10 Low 0 unhealthy d/yr today · 0 by 30 yrs out
Nearby sold comps map
Loading sold comps map…
Walkable amenities ~0.75 mi
Loading nearby amenities…
Taxation est. · year 1
- Rental income
- $16,104
- − Mortgage interest
- −$3,915
- − Property taxes
- −$1,048
- − Insurance
- −$1,147
- − Repairs & maintenance
- −$1,288
- − Management
- −$1,288
- − Depreciation
- −$2,033
- Taxable income
- $5,383
- Est. tax owed @ 24.0%
- −$1,292
- After-tax cash flow
- $4,836/yr
For passive investors: Depreciation is non-cash, so a rental often shows a tax loss while cash-flowing — sheltering income. Rental losses are passive: they offset passive income freely, and up to $25,000/yr can offset ordinary (W-2) income if you actively participate and your MAGI is under $100k (phasing out to $0 by $150k); unused losses carry forward. On sale, claimed depreciation is recaptured at up to 25%, and gains may owe capital-gains tax (a 1031 exchange can defer both). Figures are a year-1 estimate at your 24.0% rate — not tax advice; consult a CPA.
Condition & rehab AI · 12 photos
This 1-bedroom, 1-bath home is in excellent condition with recent upgrades and a low-maintenance level yard. It's located just 1 mile from downtown Prescott, making it an ideal investment property.
Value-add opportunities
- Both landscaping — enhances curb appeal and low-maintenance level yard
- Both interior paint — fresh paint improves aesthetics and value
- Both exterior paint — fresh paint enhances curb appeal and value
Renovation cost estimate screening
Value-add ROI direction
- Both landscaping — enhances curb appeal and low-maintenance level yard ↑
- Both interior paint — fresh paint improves aesthetics and value ↑
- Both exterior paint — fresh paint enhances curb appeal and value ↑
ⓘ Cost ranges are severity-bucket heuristics (US national rule-of-thumb). Get contractor quotes + a written scope before underwriting a rehab budget.
Schools (NCES district)
- District
- Prescott Unified District (4466)
- NCES district ID
- 0406730
- Math proficiency
- 34% ▼ -16.00%
- Reading proficiency
- 44% ▼ -13.00%
- Median HH income
- $48,354
- Composite
- 33.47/100
- National rank
- #5450
- State rank
- #70 of 249 in AZ
Livability — Prescott
- Score
- 73/100
- State rank
- #22
- US rank
- #5579
Category grades
Schools grade is shown separately in the Schools card above.
Census & demographics
- Census place
- Prescott, AZ
- County
- Yavapai County · 190,406 people
- City population
- 66,312
- Metro
- Prescott Valley-Prescott, AZ
- Population (ZIP)
- 27,076
- Household income
- $72,652
- Rent vs Own
- Severe rent burden
- 1225.0
Population outlook (Yavapai County) Hauer SSP2
- Today (2025)
- 241,389 people
- By 2030
- 249,523 · +3.4%
- By 2040
- 259,966 · +7.7%
- By 2050
- 264,736 · +9.7%
- By 2075
- 269,334 · +11.6%
- By 2100
- 256,505 · +6.3%
Race, ethnicity, and origin ACS 2023
- Neighborhood character
- Predominantly White (83%)
- Race & ethnicity
- White 83% Hispanic / Latino 9% Two or more races 6% Asian 2% Native American 2%
- Hispanic origin (detail)
- Mexican 7%
- Common ancestry
- Lithuanian 4% Slovak 4% Portuguese 3%
- Foreign-born
- 6% · Canada
- Languages at home
- 92% English-only · Spanish 4% Other Indo-European 1% Other Asian/Pacific 1%
Political lean MEDSL · Yavapai
- 2024 margin
- Solid R (+33.9) · D 32.6% · R 66.5%
- 2008→2024 swing
- -9.5pp toward R · 2008: -24.4pp · 2024: -33.9pp
- All cycles
- 2024: R+33.9 2020: R+29.3 2016: R+31.4 2012: R+30.7 2008: R+24.4
Not yet ingested
- Civics
- —
Market trends
- HPI YoY
- ▼ -97.55%
- Current HPI
- 350.7591
- Rent YoY
- ▲ 0.21%
- Metro
- Prescott Valley-Prescott, AZ
- State GDP YoY
- ▲ 4.54%
- F500 in state
- 20
Industry mix (Fortune 500 HQ in AZ)
| Industry | F500 HQs | Revenue |
|---|---|---|
| Technology | 2 | $13B |
|
||
| Mining / Metals | 1 | $23B |
|
||
| Environmental Services | 1 | $16B |
|
||
| Metals / Steel | 1 | $14B |
|
||
| Technology Distribution | 1 | $9B |
|
||
| Homebuilding | 1 | $8B |
|
||
Price history
+10.6% since first listed13 events — show timeline
- 2026-04-30 Price Changed $71,900 PAARMLS as Distributed by MLS Grid
- 2026-02-27 Price Changed $74,900 PAARMLS as Distributed by MLS Grid
- 2025-12-12 Listed $79,000 PAARMLS as Distributed by MLS Grid
- 2025-11-01 Listing Removed — PAARMLS as Distributed by MLS Grid
- 2025-07-25 Price Changed $87,900 PAARMLS as Distributed by MLS Grid
- 2025-06-05 Price Changed $89,900 PAARMLS as Distributed by MLS Grid
- 2025-05-18 Price Changed $92,500 PAARMLS as Distributed by MLS Grid
- 2025-04-24 Listed $94,500 PAARMLS as Distributed by MLS Grid
- 2023-12-15 Sold (MLS) $54,000 PAARMLS as Distributed by MLS Grid
- 2023-12-01 Pending — PAARMLS as Distributed by MLS Grid
- 2023-11-16 Relisted — PAARMLS as Distributed by MLS Grid
- 2023-10-20 Pending — PAARMLS as Distributed by MLS Grid
- 2023-10-12 Listed $65,000 PAARMLS as Distributed by MLS Grid
Cash-flow waterfall
monthlySold comps — $/sqft
last 12 mo · ≤1 miLoading sold comps…