 Duplex
1733 E Ocean View Ave · Norfolk, VA
Flood risk 1/10 · Minimal
- FEMA flood zone
- X (unshaded)
- Chance of flooding over 30 yrs
- 0.0%
- Est. flood insurance / yr
- $507 – $1,088
Fire risk 1/10 · Minimal
- Est. fire insurance / yr
- $666 – $1,236
Heat risk 9/10 · Severe
- Hot days now (above 104°F)
- 7 days/yr
- Hot days in 30 yrs
- 17 days/yr
Wind risk 8/10 · Major
- Chance of severe wind over 30 yrs
- 80.0%
Air-quality risk 3/10 · Minor
- Unhealthy air days now
- 2 days/yr
- Unhealthy air days in 30 yrs
- 3 days/yr
Risk factors via First Street. Map © Google.
Why this score? — see what drove the B- grade
The composite is a weighted blend of 9 inputs, each scored 0–100. Each bar is that input's sub-score; the figure is the points it added to the 100-point composite (weight × sub-score).
- Cash flow +30.0/30.0
- DSCR +10.0/10.0
- 1% rule +9.8/10.0
- ARV discount +4.2/15.0
- Livability +4.2/5.0
- Rent growth +3.7/5.0
- Schools +3.5/10.0
- Condition / age +2.5/5.0
- Appreciation +0.0/10.0
$274,340
🖨 Deal sheet (PDF) 📄 Offer letter ✓ Due diligence
Multi-family units
County records classify this as Multi-Family (2-4 Unit). Listing-text estimate: 2 units. confirmed
Listing remarks
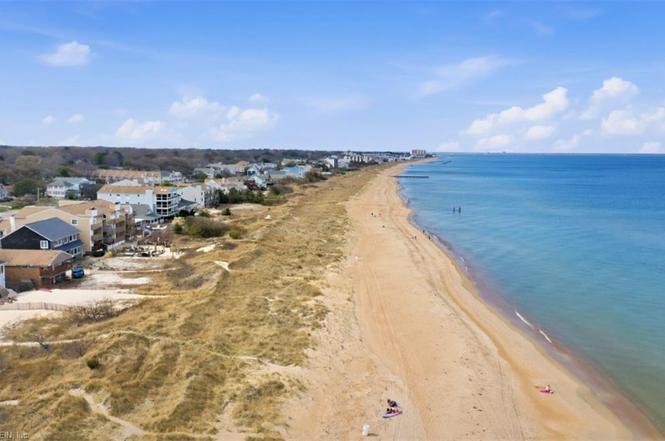
DUPLEX! Investor/Builder alert - MERE STEPS, directly across the street to the CHESAPEAKE BAY and City Beach access! Home is a "tear down" due to recent fire and not safe to enter! Seller selling "AS-IS, WHERE IS" Sellers will make no repairs-Buyers due diligence. Location, Location, Location! Build your dream home, twin home on this prime Ocean View location! Property also features an AWESOME 3 CAR DETACHED GARAGE TOO!
Key facts
- City beach access
- Garage
- Built 1950
Tags
Neighborhood map
What this means for you Summary
Snapshot
- This is a 2 × 2-bed/1.0-bath units multifamily listed at $274k.
Deal economics
- At list price, monthly cash flow is $1k ($15k/yr) — positive. Per door: $605/mo.
- The deal already cash-flows at list — no discount required.
- Meets the 1% rule at list price ($4k rent vs $274k).
- Recommended offer: $266k (3.0% below list) — sets the bar for market timing.
- Cap rate 11.6% vs local median 4.0% in Norfolk — top-decile yield for the area; either an underpriced asset or a hidden risk that comps aren't pricing in. Stress-test before assuming the spread holds.
Location & tenants
- Location reads 83/100 on livability (#43 in VA, #1,026 nationally) — a professional / high-income tenant draw. Strengths: amenities A+, commute A+, health & safety A+; Watch: employment C-, crime F.
- Norfolk City Public School District (urban): math 27% / reading 56% proficiency, ranked #118 of 131 in VA (top 90%) — families likely to look elsewhere, expect single-tenant / working-renter base with shorter leases.
- Zoned schools: Bay View Elementary (math 43% / reading 68%, grade C, #640 of 1,108 statewide, top 58%, 548 students, 98% FRL); Azalea Gardens Middle (math 21% / reading 54%, grade F, #315 of 342 statewide, top 93%, 848 students, 84% FRL); Norview High (math 33% / reading 85%, grade C+, #256 of 319 statewide, top 81%, 1,915 students, 97% FRL) — zoned schools average 93% FRL vs 59% district-wide (34 pts higher); higher-poverty schools than district average — tighter screening recommended.
- Market conditions: Rents rising fast (+4.8%/yr); 198 active listings in the ZIP; 15 comparable units currently listed for rent nearby; rentals at typical pace (median 25d on market — plan ~3-4 weeks tenant-placement turnaround); 47% of comp listings sitting > 30 days — soft ceiling on asking rent; 438 units permitted in Norfolk city in 2024 (273 in 5+ unit buildings).
- At $4,070/mo this rent would consume 72% of the median local household income ($68k/yr) (locally 1948% of renters already pay >50% of income on rent) — very limited rent-growth headroom before tenants either downsize or default.
Forward outlook
- Local home prices are declining (-3.0%/yr); year-one equity from $2k of loan paydown is wiped out by about $8k of value loss. Plan a longer hold.
- At projected returns (-3.0% appreciation + 4.8% rent growth), your $77k cash investment doubles in ~6 years — after that, you're playing with house money.
Negotiation context
- It's been on market 38 days — a 3% lower offer ($266k) is reasonable based on typical stale-listing flexibility.
- 2 sale attempts; this cycle's ask has dropped $25k (8%) from the opening price — seller is motivated, your offer sets the floor, not the list.
- Current owner paid $85k; list at $274k implies a 224% gain — meaningful room to come down on a strong offer.
Risks & watch-outs
- Watch-outs: built in 1950 — expect roof / HVAC / electrical / plumbing capex.
- Climate carrying-cost: severe wind risk, 80% chance of damaging wind over 30y; extreme-heat days projected 7→17/yr by 2055 (HVAC capex compounding) — expect insurance premiums to compound above CPI over the hold.
Questions for the listing agent
- It's been on market 38 days. Have you received any prior offers? Is the seller open to a 3% concession, seller financing, or rate buy-down credit?
- Can we see the unit-by-unit rent roll, current vacancy, and any below-market leases? What's the average tenancy length?
- What capital expenditures (roof, boiler, parking lot, exteriors) have been made in the last 5 years, and what's planned in the next 2?
- Built in 1950 — when were the roof, HVAC, electrical panel, plumbing, and water heater last replaced?
- Is there a deadline driving the sale (1031 exchange, divorce, estate, relocation)? That informs how much negotiation room exists.
- Schools are A-rated — typically a magnet for longer-tenancy family renters. What's the average tenant stay here, and is there a school-zone premium baked into asking?
- Crime grade is F in this area — have there been break-ins, vandalism, or insurance claims at this property in the last 3 years? What carrier currently insures it and at what premium?
- What's the average days-on-market for RENTAL listings here right now (not sales)? A rising rental-DOM trend means longer vacancies and softer asking-rent achievability than the comps imply.
- What's the recent tenant-quality profile in this submarket — average credit score on applications, eviction rate, late-payment / NSF rate, and stable-employment percentage? A property-management company in the area should have these aggregated.
- How much new apartment / multifamily construction is in the pipeline within 1–3 miles? Heavy new supply (>2% of stock underway) typically softens rents 12–24 months out; light construction supports rent growth.
Investment metrics
- 1% rule
- 1.48% ✓
- Cap rate
- 11.59%
- Cash-on-cash
- 18.90%
- DSCR
- 1.84
- GRM
- 5.6
CMA / ARV
- ARV (on-the-fly)
- $255,780
- Comps found
- 1
Show comp detail 1 sale within ~0.75 mi
| Address | Dist | Beds/Ba | Sqft | Sold | Price | $/sf | Match |
|---|---|---|---|---|---|---|---|
| 1733 E Ocean View Ave | 0.00mi | 4/2.0 | 2,600 (-0%) | 1mo | $255,000 | $98 | 99 |
Match score weights: distance 35% · size 25% · config 20% · recency 20%. Top-matched comps best support the ARV.
Projected returns pro-forma
-3.0% appreciation · 4.76% rent growth · sell at horizon
- IRR
- 12.8%
- Equity multiple
- 1.52×
- Total profit
- $40,079
- Equity at exit
- $40,905
- IRR
- 23.1%
- Equity multiple
- 3.16×
- Total profit
- $165,859
- Equity at exit
- $23,720
Cash invested: $76,815 (down + closing). Projections, not guarantees.
Landlord ↔ Tenant lean methodology
- Overall (STATE)
- 55 Moderately Landlord-Leaning
- State Virginia
- 55 Moderately Landlord-Leaning · D+2
- County
- — inherits STATE
- City
- — inherits STATE
ZIP-level market 23503
- Home prices YoY
- -19.9%
- Rents YoY
- 4.8%
- Active inventory
- 198
- Price-to-rent
- 11.2×
Monthly cashflow live
- Estimated rent
- $4,070 high interval (Pro) →
- Mortgage (P&I)
- −$1,439
- Tax from tax record
- −$452 /mo · $5,427/yr
- Insurance
- −$114
- HOA
- −$0
- Vacancy / Maint / Mgmt
- −$855
- Net cashflow
- $1,210
Break-even live
Sensitivity live
| Price | -10% $1,365 | -5% $1,288 | +0% $1,210 | +5% $1,132 | +10% $1,055 |
|---|---|---|---|---|---|
| Rent | -10% $889 | -5% $1,049 | +0% $1,210 | +5% $1,371 | +10% $1,532 |
| Rate | -1.0pp $1,348 | -0.5pp $1,280 | base $1,210 | +0.5pp $1,139 | +1.0pp $1,067 |
2-unit breakdown (identical units grouped — click to expand)
| Units | Beds | Baths | Est. rent |
|---|---|---|---|
| 2× units | 2 | 1 | $4,070 |
| #1 | 2 | 1 | $2,035 |
| #2 | 2 | 1 | $2,035 |
| Total (2 units) | $4,070 | ||
UW: 25.0% down · 7.5% · 30yr · 1.5% tax · 5.0% vac · 8.0% maint · 8.0% mgmt
Financing live
Cash to close
- Down payment
- $68,585
- Closing costs
- $8,230
- Reserves months
- —
- Total cash needed
- —
Loan-product check · same deal, 3 products live
Conventional
25% down · 7.5% · 30yr
- Down + closing
- —
- Monthly P&I
- —
- Monthly cashflow
- —
- DSCR
- —
- Eligible?
- —
Personal DTI + credit; lowest rate.
DSCR
20% down · 8.5% · 30yr
- Down + closing
- —
- Monthly P&I
- —
- Monthly cashflow
- —
- DSCR
- —
- Eligible?
- —
No personal income docs; deal must DSCR.
Hard money
10% down · 12.0% · 12mo
- Down + closing
- —
- Monthly P&I
- —
- Monthly cashflow
- —
- DSCR
- —
- Eligible?
- —
Short-term bridge; refi at stabilization.
Rent comps 15 comps
| Address | Beds | Baths | Sqft | Rent | $/sqft | DOM | Units | Dist |
|---|---|---|---|---|---|---|---|---|
| 1635 E Ocean View Ave Norfolk, VA | 3.0 | 2.0 | 1800 | $2,300 | $1.28 | 16d | 1 | 0.11mi |
| 1623 Kingston Ave Norfolk, VA | 4.0 | 3.5 | 2830 | $3,700 | $1.31 | 45d | 1 | 0.15mi |
| 1611 Modoc Ave Norfolk, VA | 4.0 | 2.0 | 1917 | $2,295 | $1.20 | 25d | 1 | 0.29mi |
| 9408 Willow Ct Norfolk, VA | 3.0 | 2.0 | 2000 | $2,950 | $1.48 | 45d | 1 | 0.49mi |
| 2100 E Ocean View Ave Norfolk, VA | 3.0 | 3.0 | 1836 | $2,295 | $1.25 | 45d | 1 | 0.65mi |
| 2221 Pretty Lake Ave Norfolk, VA | 3.0 | 2.0 | 1800 | $2,640 | $1.47 | 3d | 2 | 0.70mi |
| 9518 3rd Bay St Norfolk, VA | 3.0 | 3.5 | 2111 | $3,000 | $1.42 | 9d | 1 | 0.79mi |
| 9414 Atlans St Norfolk, VA | 4.0 | 2.5 | 2412 | $3,300 | $1.37 | 45d | 1 | 0.95mi |
| 937 E Ocean View Ave Norfolk, VA | 4.0 | 2.5 | 2395 | $3,500 | $1.46 | 25d | 1 | 1.00mi |
| 8504 Chesapeake Blvd Norfolk, VA | 3.0 | 4.0 | 2053 | $2,800 | $1.36 | 45d | 1 | 1.16mi |
| 3209 Pleasant Ave Norfolk, VA | 3.0 | 2.5 | 2261 | $2,900 | $1.28 | 12d | 1 | 1.38mi |
| 9708 Ship Watch Rd Norfolk, VA | 4.0 | 3.5 | 2112 | $3,300 | $1.56 | 25d | 1 | 1.39mi |
| 415 Fresh Meadow Rd Norfolk, VA | 4.0 | 2.0 | 2273 | $3,200 | $1.41 | 45d | 1 | 1.46mi |
| 432 E Gilpin Ave Norfolk, VA | 4.0 | 2.5 | 2202 | $3,200 | $1.45 | 12d | 1 | 1.46mi |
| 424 E Ocean Ave Norfolk, VA | 4.0 | 2.0 | 1953 | $2,650 | $1.36 | 45d | 1 | 1.49mi |
Listing history 10 events
-
2026-04-21status Under Contract
-
2026-04-14price $274,340
-
2026-04-03status Active
-
2026-04-01status Under Contract
-
2026-03-31price $299,340
-
2026-03-20price $249,340
-
2026-03-11$299,340 Active
-
1997-12-23soldstatus $84,600
-
1987-11-04soldstatus $102,900
-
1987-02-23soldstatus $89,900
ⓘ Source: listings_history table (triggers on properties + properties_extension) + one-shot
backfill from property_details.listing_events for pre-trigger history.
Tax reassessment forecast VA · Resets to sale price
- Current annual tax
- $5,427 · $452/mo
- Projected year-2 tax
- $5,427 · $452/mo
- Expected delta
- $0/yr ($0/mo · 0.0%)
ⓘ Screening estimate from a state-policy table — verify with the county assessor before closing.
Climate risk First Street
- Flood 1/10 Low FEMA zone X (unshaded) · 0% chance over 30 yrs
- Wildfire 1/10 Low
- Heat 9/10 Extreme 7 d/yr ≥104°F today · 17 d/yr by 30 yrs out
- Wind 8/10 Severe 80% chance of damaging wind over 30 yrs
- Air quality 3/10 Moderate 2 unhealthy d/yr today · 3 by 30 yrs out
Nearby sold comps map
Loading sold comps map…
Walkable amenities ~0.75 mi
Loading nearby amenities…
Taxation est. · year 1
- Rental income
- $48,840
- − Mortgage interest
- −$15,367
- − Property taxes
- −$5,427
- − Insurance
- −$1,372
- − Repairs & maintenance
- −$3,907
- − Management
- −$3,907
- − Depreciation
- −$7,981
- Taxable income
- $10,879
- Est. tax owed @ 24.0%
- −$2,611
- After-tax cash flow
- $11,910/yr
For passive investors: Depreciation is non-cash, so a rental often shows a tax loss while cash-flowing — sheltering income. Rental losses are passive: they offset passive income freely, and up to $25,000/yr can offset ordinary (W-2) income if you actively participate and your MAGI is under $100k (phasing out to $0 by $150k); unused losses carry forward. On sale, claimed depreciation is recaptured at up to 25%, and gains may owe capital-gains tax (a 1031 exchange can defer both). Figures are a year-1 estimate at your 24.0% rate — not tax advice; consult a CPA.
Schools (NCES district)
- District
- Norfolk City Public School District
- NCES district ID
- 5102670
- Math proficiency
- 27% ▼ -44.00%
- Reading proficiency
- 56% ▼ -10.00%
- Median HH income
- $44,358
- Composite
- 35.08/100
- National rank
- #5026
- State rank
- #118 of 131 in VA
Livability — Norfolk
- Score
- 83/100
- State rank
- #43
- US rank
- #1026
Category grades
Schools grade is shown separately in the Schools card above.
Census & demographics
- Census place
- Norfolk, VA
- County
- Norfolk City · 214,042 people
- City population
- 214,042
- Metro
- Virginia Beach-Norfolk-Newport News, VA-NC
- Population (ZIP)
- 30,216
- Household income
- $67,649
- Rent vs Own
- Severe rent burden
- 1948.0
Population outlook (Norfolk County) Hauer SSP2
- Today (2025)
- 249,032 people
- By 2030
- 252,347 · +1.3%
- By 2040
- 253,644 · +1.9%
- By 2050
- 251,913 · +1.2%
- By 2075
- 245,281 · -1.5%
- By 2100
- 219,548 · -11.8%
Race, ethnicity, and origin ACS 2023
- Neighborhood character
- Diverse neighborhood (Simpson 0.63)
- Race & ethnicity
- White 56% Black 20% Hispanic / Latino 13% Two or more races 9% Asian 3% Native American 1%
- Hispanic origin (detail)
- Mexican 5% Puerto Rican 2%
- Common ancestry
- Lithuanian 2% Slovak 2% Romanian 2%
- Foreign-born
- 9% · Canada, China
- Languages at home
- 87% English-only · Spanish 8% Tagalog/Filipino 1% Other Asian/Pacific 1%
Political lean MEDSL · Norfolk
- 2024 margin
- Solid D (+41.5) · D 70.0% · R 28.5% · Other 1.6%
- 2008→2024 swing
- -1.4pp toward R · 2008: 43.0pp · 2024: 41.5pp
- All cycles
- 2024: D+41.5 2020: D+45.6 2016: D+42.0 2012: D+44.0 2008: D+43.0
Not yet ingested
- Civics
- —
Market trends
- HPI YoY
- ▼ -78.48%
- Current HPI
- 316.1563
- Rent YoY
- ▲ 4.76%
- Metro
- Virginia Beach-Norfolk-Newport News, VA-NC
- State GDP YoY
- ▲ 2.40%
- F500 in state
- 50
Industry mix (Fortune 500 HQ in VA)
| Industry | F500 HQs | Revenue |
|---|---|---|
| Aerospace / Defense | 4 | $236B |
|
||
| Technology / Defense | 3 | $32B |
|
||
| Financial Services | 2 | $176B |
|
||
| Utilities | 2 | $27B |
|
||
| Insurance | 2 | $25B |
|
||
| Technology | 2 | $15B |
|
||
Price history
+205.2% since first listed10 events — show timeline
- 2026-04-21 Pending — REINMLS
- 2026-04-14 Price Changed $274,340 REINMLS
- 2026-04-03 Relisted — REINMLS
- 2026-04-01 Pending — REINMLS
- 2026-03-31 Price Changed $299,340 REINMLS
- 2026-03-20 Price Changed $249,340 REINMLS
- 2026-03-11 Listed $299,340 REINMLS
- 1997-12-23 Sold (Public Records) $84,600 Public Records
- 1987-11-04 Sold (Public Records) $102,900 Public Records
- 1987-02-23 Sold (Public Records) $89,900 Public Records
Property tax history
+6.1%/yrLatest (2025): $5,427 · +2.8% YoY. Source: county tax records.
Cash-flow waterfall
monthlySold comps — $/sqft
last 12 mo · ≤1 miLoading sold comps…