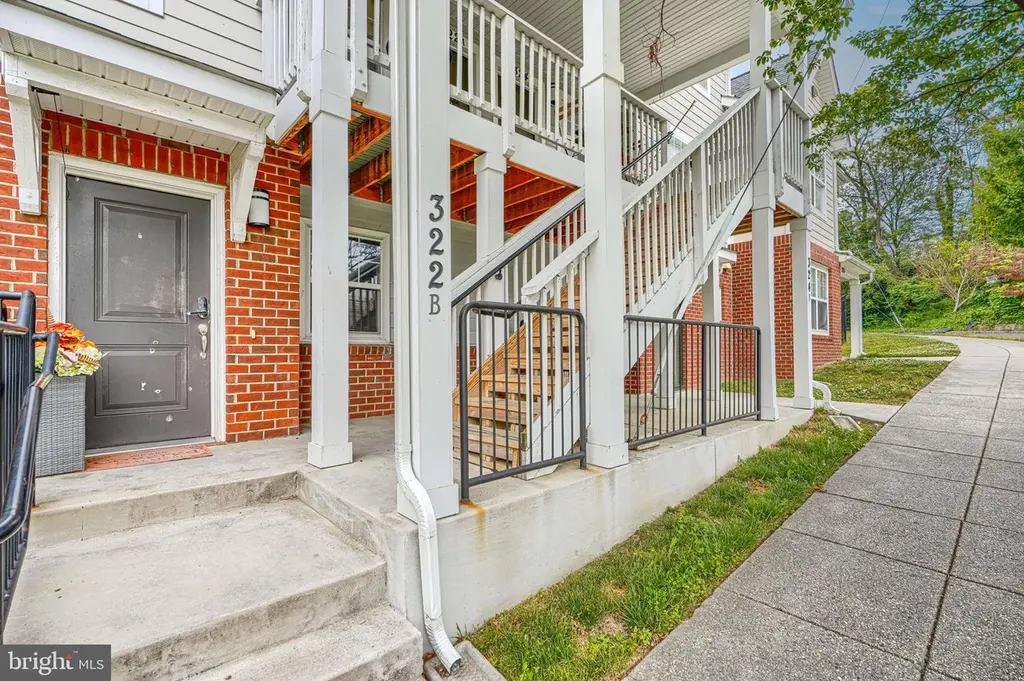
322 St Louis St SE Unit B · Washington, DC
Flood risk No data
- FEMA flood zone
- —
- Chance of flooding over 30 yrs
- —
- Est. flood insurance / yr
- —
Fire risk No data
- Est. fire insurance / yr
- —
Heat risk No data
- Hot days now (above threshold)
- —
- Hot days in 30 yrs
- —
Wind risk No data
- Chance of severe wind over 30 yrs
- —
Air-quality risk No data
- Unhealthy air days now
- —
- Unhealthy air days in 30 yrs
- —
Risk factors via First Street. Map © Google.
Why this score? — see what drove the C- grade
The composite is a weighted blend of 9 inputs, each scored 0–100. Each bar is that input's sub-score; the figure is the points it added to the 100-point composite (weight × sub-score).
- Cash flow +19.2/30.0
- ARV discount +7.5/15.0
- 1% rule +6.2/10.0
- DSCR +6.1/10.0
- Rent growth +4.0/5.0
- Condition / age +4.0/5.0
- Livability +3.7/5.0
- Schools +3.6/10.0
- Appreciation +0.0/10.0
$150,000
🖨 Deal sheet 📄 Offer letter ✓ Due diligence
Listing remarks
AGENTS - PLEASE VIEW AGENT REMARKS IN BRIGHT MLS. Welcome to 322B St. Louis St SE, a well-maintained home offering a great opportunity for buyers seeking value and convenience. This charming residence features a functional layout with bright, open living spaces perfect for both everyday living and entertaining. The home includes a spacious kitchen with ample cabinetry, along with comfortable living and dining areas filled with natural light. Enjoy generously sized bedrooms and a well-appointed bathroom designed for practicality and comfort. Additional highlights include modern touches, ample storage, and a private outdoor space ideal for relaxing or hosting guests Offers may be entered ONLI
Key facts
- $128 HOA
- Built 2019
- Listed 42 days
Property features AI
Finance
- HOA & community: Condo fee of $128.48 monthly including lawn maintenance
Exterior
- Parking: Parking lot
- Utilities: Public water; Public sewer
- Home design: Condominium unit/flat in MARSHALL HEIGHTS; Entry level: 1; Built year per assessor
- Construction: Brick construction; Above-grade and below-grade structures
- Exterior features: Garden-style building (1–4 floors); Tidal water: none; Pets allowed with size/weight restrictions
Interior
- Bedrooms: 2 bedrooms on main level
- Bathrooms: 1 full bathroom on main level
- Heating & cooling: Central heating (electric); Central air conditioning (electric); Electric hot water
- Interior features: No basement; Living area per assessor
- Laundry & utility: Washer/dryer hookup in unit
Neighborhood map
What this means for you Summary
Snapshot
- This is a 2-bed/1.0-bath condo listed at $150k. Condition is rated good.
Deal economics
- At list price, monthly cash flow is $162 ($2k/yr) — positive.
- The deal already cash-flows at list — no discount required.
- Meets the 1% rule at list price ($2k rent vs $150k).
- Recommended offer: $146k (3.0% below list) — sets the bar for market timing.
- Cap rate 7.6% vs local median 2.5% in Washington — top-decile yield for the area; either an underpriced asset or a hidden risk that comps aren't pricing in. Stress-test before assuming the spread holds.
Location & tenants
- Location reads 73/100 on livability (#1 in DC) — a middle-class / working-renter tenant base. Strengths: amenities A+, commute A+, employment A+; Watch: crime F, cost of living F.
- District Of Columbia Public Schools (urban): math 33% / reading 40% proficiency, ranked #8 of 32 in DC (top 25%) — families likely to look elsewhere, expect single-tenant / working-renter base with shorter leases; 65% free/reduced lunch — lower-income household profile, screen leases tightly.
- Market conditions: Rents rising fast (+6.1%/yr); 276 active listings in the ZIP; 40 comparable units currently listed for rent nearby; rentals at typical pace (median 24d on market — plan ~3-4 weeks tenant-placement turnaround); 1,737 units permitted in District of Columbia in 2024 (1,506 in 5+ unit buildings).
- This rent runs 35% of the median local income ($58k/yr) — at the standard rent-burdened threshold; future hikes will face affordability resistance.
Forward outlook
- Local home prices are declining (-3.0%/yr); year-one equity from $1k of loan paydown is wiped out by about $4k of value loss. Plan a longer hold.
- District of Columbia County population projected at +50% by 2050 — long-run rental-demand tailwind backs the buy-and-hold thesis.
Negotiation context
- It's been on market 43 days — a 3% lower offer ($146k) is reasonable based on typical stale-listing flexibility.
Questions for the listing agent
- It's been on market 43 days. Have you received any prior offers? Is the seller open to a 3% concession, seller financing, or rate buy-down credit?
- What does the HOA fee cover, when was the last increase, and are there any pending special assessments or reserve-fund shortfalls?
- Any open or pending special assessments — roof, HVAC, plumbing, elevator, façade? What's the per-unit balance and payoff schedule, and is the seller paying it off at close or rolling it to the buyer?
- Is there a deadline driving the sale (1031 exchange, divorce, estate, relocation)? That informs how much negotiation room exists.
- Crime grade is F in this area — have there been break-ins, vandalism, or insurance claims at this property in the last 3 years? What carrier currently insures it and at what premium?
- What's the average days-on-market for RENTAL listings here right now (not sales)? A rising rental-DOM trend means longer vacancies and softer asking-rent achievability than the comps imply.
- What's the recent tenant-quality profile in this submarket — average credit score on applications, eviction rate, late-payment / NSF rate, and stable-employment percentage? A property-management company in the area should have these aggregated.
- How much new apartment / multifamily construction is in the pipeline within 1–3 miles? Heavy new supply (>2% of stock underway) typically softens rents 12–24 months out; light construction supports rent growth.
Investment metrics
- 1% rule
- 1.12% ✓
- Cap rate
- 7.59%
- Cash-on-cash
- 4.63%
- DSCR
- 1.21
- GRM
- 7.4
CMA / ARV
No comps found within radius.
Projected returns pro-forma
-3.0% appreciation · 6.06% rent growth · sell at horizon
- IRR
- -5.3%
- Equity multiple
- 0.80×
- Total profit
- $-8,550
- Equity at exit
- $22,365
- IRR
- 8.0%
- Equity multiple
- 1.70×
- Total profit
- $29,556
- Equity at exit
- $12,969
Cash invested: $42,000 (down + closing). Projections, not guarantees.
Landlord ↔ Tenant lean methodology
- Overall (CITY)
- 0 Strongly Tenant-Friendly
- State District of Columbia
- 12 Strongly Tenant-Friendly · D+43
- County
- — inherits STATE
- City Washington
- 0 Strongly Tenant-Friendly · D+43
ZIP-level market 20019
- Rents YoY
- 6.1%
- Active inventory
- 276
- Price-to-rent
- 7.4×
Monthly cashflow live
- Estimated rent
- $1,679 high interval (Pro) →
- Mortgage (P&I)
- −$787
- Tax est. 1.5%
- −$188 /mo · $2,250/yr
- Insurance
- −$62
- HOA
- −$128
- Vacancy / Maint / Mgmt
- −$353
- Net cashflow
- $162
Break-even live
UW: 25.0% down · 7.5% · 30yr · 1.5% tax · 5.0% vac · 8.0% maint · 8.0% mgmt
Financing live
Cash to close
- Down payment
- $37,500
- Closing costs
- $4,500
- Reserves months
- —
- Total cash needed
- —
Loan-product check · same deal, 3 products live
Conventional
25% down · 7.5% · 30yr
- Down + closing
- —
- Monthly P&I
- —
- Monthly cashflow
- —
- DSCR
- —
- Eligible?
- —
Personal DTI + credit; lowest rate.
DSCR
20% down · 8.5% · 30yr
- Down + closing
- —
- Monthly P&I
- —
- Monthly cashflow
- —
- DSCR
- —
- Eligible?
- —
No personal income docs; deal must DSCR.
Hard money
10% down · 12.0% · 12mo
- Down + closing
- —
- Monthly P&I
- —
- Monthly cashflow
- —
- DSCR
- —
- Eligible?
- —
Short-term bridge; refi at stabilization.
Rent comps 40 comps
| Address | Beds | Baths | Sqft | Rent | $/sqft | DOM | Units | Dist |
|---|---|---|---|---|---|---|---|---|
| 324 Saint Louis St SE Washington, DC | 2.0 | 1.0 | 640 | $1,750 | $2.73 | 7d | 1 | 0.02mi |
| 4820 C St SE #304 Washington, DC | 2.0 | 1.0 | 635 | $1,600 | $2.52 | 24d | 1 | 0.09mi |
| 4800 C St SE #302 Washington, DC | 1.0 | 1.0 | 502 | $1,440 | $2.87 | 24d | 1 | 0.12mi |
| 4732 Benning Rd SE #102 Washington, DC | 1.0 | 1.0 | 581 | $1,150 | $1.98 | 24d | 1 | 0.17mi |
| 5045 Call Pl SE #203 Washington, DC | 1.0 | 1.0 | 693 | $2,000 | $2.89 | 24d | 1 | 0.18mi |
| 4701 Benning Rd SE Washington, DC | 1.0 | 1.0 | 600 | $1,100 | $1.83 | 24d | 1 | 0.19mi |
| 4919 A St SE Unit 202 Washington, DC | 2.0 | 1.0 | 625 | $1,900 | $3.04 | 24d | 1 | 0.21mi |
| 4930 A St SE Unit 203 Washington, DC | 3.0 | 1.0 | 750 | $2,815 | $3.75 | 24d | 1 | 0.24mi |
| 4511 B St SE Washington, DC | 1.0–2.0 | 1.0 | 675 | $1,650 | $2.44 | 24d | 2 | 0.29mi |
| 5124 Astor Pl SE Washington, DC | 2.0 | 1.0 | 700 | $1,100 | $1.57 | 24d | 1 | 0.31mi |
| 4805 Texas Ave SE Washington, DC | 1.0–2.0 | 1.0 | 775 | $1,400 | $1.81 | 24d | 1 | 0.45mi |
| 5031 H St SE Apt 1 Washington, DC | 1.0 | 1.0 | 565 | $1,095 | $1.94 | 2d | 1 | 0.47mi |
| 5031 H St SE Unit 4 Washington, DC | 1.0 | 1.0 | 530 | $1,195 | $2.25 | 24d | 1 | 0.47mi |
| 5031 H St SE Apt 1 Washington, DC | 1.0 | 1.0 | 530 | $1,095 | $2.07 | 14d | 1 | 0.47mi |
| 819 51st St SE Unit 5 Washington, DC | 1.0 | 1.0 | 650 | $1,000 | $1.54 | 7d | 1 | 0.48mi |
| 4601 Blaine St NE Unit 1 Washington, DC | 2.0 | 1.0 | 750 | $1,500 | $2.00 | 24d | 1 | 0.53mi |
| 429 Burbank St SE Apt 4 Washington, DC | 1.0 | 1.0 | 594 | $1,235 | $2.08 | 24d | 1 | 0.62mi |
| 4236 Benning Rd NE Washington, DC | 1.0 | 1.0 | 700 | $1,095 | $1.56 | 4d | 1 | 0.73mi |
| 5225 Dix St NE Apt 101 Washington, DC | 1.0 | 1.0 | 650 | $1,550 | $2.38 | 24d | 1 | 0.77mi |
| 4040 E Capitol St NE Washington, DC | 1.0–2.0 | 1.0–1.5 | 716 | $1,608 | $2.24 | 7d | 1 | 0.78mi |
| 405 Division Ave NE Unit 201 Washington, DC | 2.0 | 1.0 | 656 | $1,197 | $1.82 | 16d | 1 | 0.78mi |
| 4255 Eads St NE Unit 3 Washington, DC | 2.0 | 1.0 | 610 | $1,750 | $2.87 | 22d | 1 | 0.84mi |
| 599 50th St NE Washington, DC | 1.0–2.0 | 1.0–2.0 | 775 | $2,081 | $2.69 | 24d | 1 | 0.84mi |
| 3738 D St SE Washington, DC | 1.0–2.0 | 1.0 | 542 | $1,549 | $2.86 | 7d | 12 | 0.90mi |
| 4651 Nannie Helen Burroughs Ave NE Washington, DC | 1.0–2.0 | 1.0 | 663 | $1,749 | $2.64 | 5d | 3 | 0.94mi |
| 4348 Southern Ave SE Washington, DC | 2.0 | 1.0 | 650 | $2,300 | $3.54 | 24d | 1 | 0.95mi |
| 4348 Southern Ave SE Unit Radiance Washington, DC | 2.0 | 1.0 | 550 | $2,200 | $4.00 | 18d | 1 | 0.95mi |
| 5601 Nannie Helen Burroughs Ave NE #103 Washington, DC | 1.0 | 1.0 | 675 | $1,375 | $2.04 | 24d | 1 | 1.11mi |
| 5000 Hunt St NE Washington, DC | 2.0 | 1.0 | 629 | $1,325 | $2.11 | 24d | 20 | 1.14mi |
| 305 37th St SE Washington, DC | 1.0–2.0 | 1.0–1.5 | 787 | $1,550 | $1.97 | 24d | 1 | 1.15mi |
| 301 Anacostia Rd SE Unit 2 BEDROOM Washington, DC | 2.0 | 1.0 | 600 | $1,300 | $2.17 | 24d | 1 | 1.21mi |
| 3600 Ely Pl SE Washington, DC | 1.0–3.0 | 1.0 | 719 | $2,088 | $2.90 | 3d | 10 | 1.21mi |
| 212 36th St NE #3 Washington, DC | 3.0 | 1.0 | 750 | $3,450 | $4.60 | 24d | 1 | 1.21mi |
| 212 36th St NE #1 Washington, DC | 2.0 | 1.0 | 750 | $2,550 | $3.40 | 24d | 1 | 1.21mi |
| 3539 A St SE Washington, DC | 1.0–2.0 | 1.0–2.0 | 807 | $1,403 | $1.74 | 17d | 1 | 1.23mi |
| 506 Eastern Ave NE Unit 102 Washington, DC | 1.0 | 1.0 | 650 | $1,199 | $1.84 | 24d | 1 | 1.24mi |
| 323 62nd St NE Washington, DC | 1.0–3.0 | 1.0–2.0 | 908 | $1,867 | $2.06 | 24d | 1 | 1.24mi |
| 195 35th St NE Unit 1 Washington, DC | 2.0 | 1.0 | 716 | $1,800 | $2.51 | 24d | 1 | 1.24mi |
| 319 Anacostia Rd SE Unit 1 Washington, DC | 2.0 | 1.0 | 724 | $1,035 | $1.43 | 24d | 1 | 1.25mi |
| 3516 Ely Pl SE Unit 4 Washington, DC | 1.0 | 1.0 | 700 | $1,450 | $2.07 | 24d | 1 | 1.26mi |
HOA detail condo
- Monthly dues
- $128 · $1,536/yr
- Assessments
- None detected in remarks — confirm with the listing agent.
Listing history 15 events
-
2026-06-18days on market $150,000 Active 43 DOM
-
2026-06-17days on market $150,000 Active 42 DOM
-
2026-06-16days on market $150,000 Active 41 DOM
-
2026-06-15days on market $150,000 Active 40 DOM
-
2026-06-13days on market $150,000 Active 38 DOM
-
2026-06-09days on market $150,000 Active 34 DOM
-
2026-06-08days on market $150,000 Active 33 DOM
-
2026-06-07days on market $150,000 Active 32 DOM
-
2026-06-04days on market $150,000 Active 29 DOM
-
2026-06-03days on market $150,000 Active 28 DOM
-
2026-06-02days on market $150,000 Active 27 DOM
-
2026-06-01days on market $150,000 Active 26 DOM
-
2026-05-31days on market $150,000 Active 25 DOM
-
2026-05-07$150,000 Active
-
2026-05-04historical $150,000
ⓘ Source: listings_history table (triggers on properties + properties_extension) + one-shot
backfill from property_details.listing_events for pre-trigger history.
Nearby sold comps map
Loading sold comps map…
Walkable amenities ~0.75 mi
Loading nearby amenities…
Taxation est. · year 1
- Rental income
- $20,152
- − Mortgage interest
- −$8,402
- − Property taxes
- −$2,250
- − Insurance
- −$750
- − Repairs & maintenance
- −$1,612
- − Management
- −$1,612
- − HOA
- −$1,536
- − Depreciation
- −$4,364
- Taxable loss
- −$374
- Est. tax savings @ 24.0%
- +$90
- After-tax cash flow
- $2,035/yr
For passive investors: Depreciation is non-cash, so a rental often shows a tax loss while cash-flowing — sheltering income. Rental losses are passive: they offset passive income freely, and up to $25,000/yr can offset ordinary (W-2) income if you actively participate and your MAGI is under $100k (phasing out to $0 by $150k); unused losses carry forward. On sale, claimed depreciation is recaptured at up to 25%, and gains may owe capital-gains tax (a 1031 exchange can defer both). Figures are a year-1 estimate at your 24.0% rate — not tax advice; consult a CPA.
Condition & rehab AI · 12 photos
This well-maintained townhouse offers a functional layout with modern updates and ample natural light, making it an attractive option for buyers seeking value and convenience.
Value-add opportunities
- Both Painting exterior brick — Enhances curb appeal and value.
- Both Landscaping improvements — Enhances curb appeal and value.
- Both New flooring in bathrooms — Improves aesthetics and functionality.
- Both New kitchen backsplash — Enhances aesthetics and functionality.
Renovation cost estimate screening
Value-add ROI direction
- Both Painting exterior brick — Enhances curb appeal and value. ↑
- Both Landscaping improvements — Enhances curb appeal and value. ↑
- Both New flooring in bathrooms — Improves aesthetics and functionality. ↑
- Both New kitchen backsplash — Enhances aesthetics and functionality. ↑
ⓘ Cost ranges are severity-bucket heuristics (US national rule-of-thumb). Get contractor quotes + a written scope before underwriting a rehab budget.
Schools (NCES district)
- District
- District Of Columbia Public Schools
- NCES district ID
- 1100030
- Math proficiency
- 33% ▲ 3.00%
- Reading proficiency
- 40% ▲ 5.00%
- Median HH income
- $67,671
- Composite
- 35.84/100
- National rank
- #9606
- State rank
- #8 of 32 in DC
Livability — Washington
- Score
- 73/100
- State rank
- #1
- US rank
- #5327
Category grades
Schools grade is shown separately in the Schools card above.
Census & demographics
- Census place
- Washington, DC
- County
- District of Columbia · 671,873 people
- City population
- 671,873
- Metro
- Washington-Arlington-Alexandria, DC-VA-MD-WV
- Population (ZIP)
- 63,380
- Household income
- $58,296
- Rent vs Own
- Severe rent burden
- 5115.0
Population outlook (District of Columbia County) Hauer SSP2
- Today (2025)
- 821,926 people
- By 2030
- 899,517 · +9.4%
- By 2040
- 1,061,162 · +29.1%
- By 2050
- 1,231,493 · +49.8%
- By 2075
- 1,603,312 · +95.1%
- By 2100
- 1,847,141 · +124.7%
Race, ethnicity, and origin ACS 2023
- Neighborhood character
- Predominantly Black (87%)
- Race & ethnicity
- Black 87% Hispanic / Latino 7% Two or more races 4% White 2%
- Hispanic origin (detail)
- Mexican 1% Dominican 1%
- Foreign-born
- 6% · Canada
- Languages at home
- 91% English-only · Spanish 6% French/Haitian/Cajun 1%
Political lean MEDSL · District of Columbia
- 2024 margin
- Solid D (+86.1) · D 91.2% · R 5.1% · Other 3.8%
- 2008→2024 swing
- +0.1pp no change · 2008: 85.9pp · 2024: 86.1pp
- All cycles
- 2024: D+86.1 2020: D+86.8 2016: D+88.7 2012: D+84.2 2008: D+85.9
Not yet ingested
- Civics
- —
Market trends
- HPI YoY
- ▼ -416.91%
- Current HPI
- 326.4481
- Rent YoY
- ▲ 6.06%
- Metro
- Washington-Arlington-Alexandria, DC-VA-MD-WV
- State GDP YoY
- ▲ 1.33%
- F500 in state
- 6
Industry mix (Fortune 500 HQ in DC)
| Industry | F500 HQs | Revenue |
|---|---|---|
| Financial Services | 1 | $153B |
|
||
| Life Sciences / Industrials | 1 | $25B |
|
||
| Industrial Machinery | 1 | $8B |
|
||
Price history
+0.0% since first listed2 events — show timeline
- 2026-05-07 Listed $150,000 BRIGHT MLS
- 2026-05-04 Coming Soon $150,000 BRIGHT MLS
Cash-flow waterfall
monthlySold comps — $/sqft
last 12 mo · ≤1 miLoading sold comps…