3202 21st Ave W · Bradenton, FL
Flood risk 1/10 · Minimal
- FEMA flood zone
- X (unshaded)
- Chance of flooding over 30 yrs
- 0.0%
- Est. flood insurance / yr
- $507 – $1,088
Fire risk 1/10 · Minimal
- Est. fire insurance / yr
- $947 – $1,759
Heat risk 10/10 · Severe
- Hot days now (above 107°F)
- 7 days/yr
- Hot days in 30 yrs
- 31 days/yr
Wind risk 10/10 · Severe
- Chance of severe wind over 30 yrs
- 99.0%
Air-quality risk 3/10 · Minor
- Unhealthy air days now
- 2 days/yr
- Unhealthy air days in 30 yrs
- 2 days/yr
Risk factors via First Street. Map © Google.
Why this score? — see what drove the C+ grade
The composite is a weighted blend of 9 inputs, each scored 0–100. Each bar is that input's sub-score; the figure is the points it added to the 100-point composite (weight × sub-score).
- Cash flow +21.9/30.0
- ARV discount +15.0/15.0
- DSCR +7.0/10.0
- 1% rule +4.9/10.0
- Schools +4.4/10.0
- Livability +4.0/5.0
- Condition / age +2.5/5.0
- Rent growth +1.9/5.0
- Appreciation +0.0/10.0
$327,000
🖨 Deal sheet 📄 Offer letter ✓ Due diligence
Listing remarks MLS
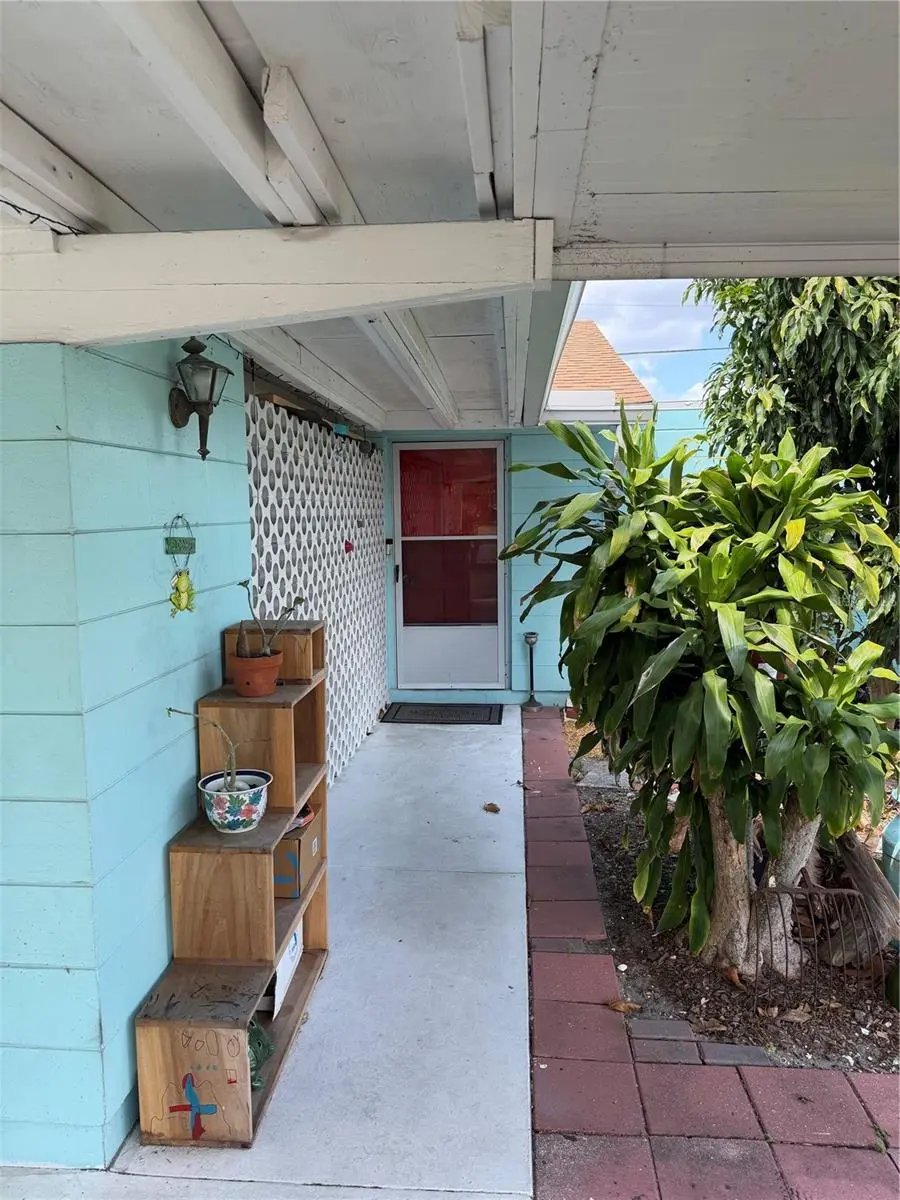
This 3 bedroom 2 bath home features an open floor plan and 1458 sq. ft. of living space. living room and bonus area. Step outside into the privacy of the fenced in backyard.
Key facts
- Ample natural light
- Sufficient workspace
- Driveway parking
Tags
Property features AI
Finance
- Other: Homestead exempt; Lease restrictions apply
- HOA & community: Pets allowed; No HOA association indicated
Exterior
- Parking: Circular driveway; 1-car carport
- Utilities: Public water; Public sewer; Electricity connected; Sewer connected; Water connected; Cable available; Phone available
- Home design: Single family residence; One story; Faces south
- Construction: Block construction; Shingle roof; Slab foundation; Built on a 0.2-acre lot (approx. 83 x 107 ft)
- Exterior features: Rain gutters; Shed(s); Corner lot; Asphalt/paved public road access
Interior
- Kitchen: Range; Range hood; Refrigerator
- Bedrooms: 3 bedrooms
- Flooring: Laminate
- Bathrooms: 2 full bathrooms
- Heating & cooling: Central heating (electric); Central air conditioning
- Interior features: Ceiling fans; Open floorplan
- Laundry & utility: Laundry area (other); Electric water heater
Neighborhood map
What this means for you Summary
Snapshot
- This is a 4-bed/2.0-bath single-family listed at $327k.
Deal economics
- At list price, monthly cash flow is $515 ($6k/yr) — positive.
- The deal already cash-flows at list — no discount required.
- To meet the 1% rule (rent ≥ 1% of price), the offer needs to be $323k (1.2% below list).
- Recommended offer: $307k (6.0% below list) — sets the bar for market timing.
- Cap rate 8.2% vs local median 3.6% in Bradenton — top-decile yield for the area; either an underpriced asset or a hidden risk that comps aren't pricing in. Stress-test before assuming the spread holds.
Location & tenants
- Location reads 81/100 on livability (#101 in FL, #1,528 nationally) — a professional / high-income tenant draw. Strengths: commute A+, cost of living A+, housing A+; Watch: employment D+, crime D, amenities F.
- Manatee (suburban): math 54% / reading 50% proficiency, ranked #26 of 73 in FL (top 36%) — acceptable for families but not a draw, mixed tenant base, ~2y average lease.
- Zoned schools: Jessie P. Miller Elementary School (math 61% / reading 53%, grade C+, #781 of 2,144 statewide, top 38%, 614 students, 66% FRL); Manatee High School (math 32% / reading 47%, grade F, #304 of 667 statewide, top 47%, 1,983 students, 59% FRL).
- Market conditions: Rents soft (-2.4%/yr); 319 active listings in the ZIP; 24 comparable units currently listed for rent nearby; rentals at typical pace (median 24d on market — plan ~3-4 weeks tenant-placement turnaround); 7,472 units permitted in Manatee County in 2024 (1,782 in 5+ unit buildings).
- At $3,232/mo this rent would consume 74% of the median local household income ($53k/yr) (locally 1736% of renters already pay >50% of income on rent) — very limited rent-growth headroom before tenants either downsize or default.
Forward outlook
- Local home prices are declining (-3.0%/yr); year-one equity from $2k of loan paydown is wiped out by about $10k of value loss. Plan a longer hold.
- Manatee County population projected at +43% by 2050 — long-run rental-demand tailwind backs the buy-and-hold thesis.
Negotiation context
- It's been on market 78 days — a 6% lower offer ($307k) is reasonable based on typical stale-listing flexibility.
- 8 sale attempts since 19y ago with the ask held roughly flat each time — persistent listings suggest the price (not the market) is what's stuck; bring a comps-based counter.
- Current owner paid $167k; list at $327k implies a 96% gain — meaningful room to come down on a strong offer.
Risks & watch-outs
- Climate carrying-cost: severe wind risk, 99% chance of damaging wind over 30y; extreme-heat days projected 7→31/yr by 2055 (HVAC capex compounding) — expect insurance premiums to compound above CPI over the hold.
Questions for the listing agent
- It's been on market 78 days. Have you received any prior offers? Is the seller open to a 6% concession, seller financing, or rate buy-down credit?
- Built in 1961 — when were the roof, HVAC, electrical panel, plumbing, and water heater last replaced?
- Why hasn't it sold? Are there any deal-killer items the seller is aware of (foundation, flood, title, zoning, code violations)?
- Is there a deadline driving the sale (1031 exchange, divorce, estate, relocation)? That informs how much negotiation room exists.
- Crime grade is D in this area — have there been break-ins, vandalism, or insurance claims at this property in the last 3 years? What carrier currently insures it and at what premium?
- What's the average days-on-market for RENTAL listings here right now (not sales)? A rising rental-DOM trend means longer vacancies and softer asking-rent achievability than the comps imply.
- What's the recent tenant-quality profile in this submarket — average credit score on applications, eviction rate, late-payment / NSF rate, and stable-employment percentage? A property-management company in the area should have these aggregated.
- How much new for-sale + rental construction is in the pipeline within 1–3 miles? Heavy new supply typically softens prices + rents 12–24 months out; constrained supply supports both.
Investment metrics
- 1% rule
- 0.99% ✗
- Cap rate
- 8.18%
- Cash-on-cash
- 6.76%
- DSCR
- 1.30
- GRM
- 8.4
CMA / ARV
- ARV (on-the-fly)
- $396,576
- Comps found
- 12
Show comp detail 12 sales within ~0.75 mi
| Address | Dist | Beds/Ba | Sqft | Sold | Price | $/sf | Match |
|---|---|---|---|---|---|---|---|
| 3801 21st Ave W | 0.30mi | 3/2.0 (-1) | 1,436 (-2%) | 3mo | $409,000 | $285 | 76 |
| 3014 Southern Pkwy W | 0.20mi | 3/2.0 (-1) | 1,554 (+7%) | 1mo | $409,000 | $263 | 74 |
| 2405 21st Ave W | 0.48mi | 3/2.0 (-1) | 1,452 (-0%) | 2mo | $237,000 | $163 | 70 |
| 1410 35th St W | 0.45mi | 4/2.0 | 1,516 (+4%) | 4mo | $475,000 | $313 | 69 |
| 1411 29th St W | 0.47mi | 3/2.0 (-1) | 1,527 (+5%) | 1mo | $369,000 | $242 | 64 |
| 1111 38th St W | 0.68mi | 3/2.0 (-1) | 1,447 (-1%) | 1mo | $389,000 | $269 | 62 |
| 2502 15th Ave W | 0.62mi | 3/2.0 (-1) | 1,429 (-2%) | 2mo | $455,000 | $318 | 61 |
| 2806 Oxford Dr W | 0.31mi | 3/2.0 (-1) | 1,284 (-12%) | 2mo | $349,000 | $272 | 59 |
| 3218 Oxford Dr W | 0.31mi | 3/2.0 (-1) | 1,638 (+12%) | 2mo | $300,000 | $183 | 58 |
| 2904 Norwich Dr W | 0.44mi | 3/2.0 (-1) | 1,610 (+10%) | 2mo | $439,000 | $273 | 56 |
| 2702 38th St W | 0.42mi | 3/3.0 (-1) | 1,608 (+10%) | 2mo | $440,000 | $274 | 53 |
| 2202 21st St W | 0.68mi | 3/2.0 (-1) | 1,590 (+9%) | 4mo | $400,000 | $252 | 45 |
Match score weights: distance 35% · size 25% · config 20% · recency 20%. Top-matched comps best support the ARV.
Projected returns pro-forma
-3.0% appreciation · 0.0% rent growth · sell at horizon
- IRR
- -9.1%
- Equity multiple
- 0.68×
- Total profit
- $-29,716
- Equity at exit
- $48,757
- IRR
- -3.9%
- Equity multiple
- 0.78×
- Total profit
- $-20,564
- Equity at exit
- $28,273
Cash invested: $91,560 (down + closing). Projections, not guarantees.
Landlord ↔ Tenant lean methodology
- Overall (STATE)
- 87 Strongly Landlord-Friendly
- State Florida
- 87 Strongly Landlord-Friendly · R+3
- County
- — inherits STATE
- City
- — inherits STATE
ZIP-level market 34205
- Rents YoY
- -2.4%
- Active inventory
- 319
- Price-to-rent
- 8.4×
Monthly cashflow live
- Estimated rent
- $3,232 high interval (Pro) →
- Mortgage (P&I)
- −$1,715
- Tax from tax record
- −$187 /mo · $2,243/yr
- Insurance
- −$136
- HOA
- −$0
- Vacancy / Maint / Mgmt
- −$679
- Net cashflow
- $515
Break-even live
UW: 25.0% down · 7.5% · 30yr · 1.5% tax · 5.0% vac · 8.0% maint · 8.0% mgmt
Financing live
Cash to close
- Down payment
- $81,750
- Closing costs
- $9,810
- Reserves months
- —
- Total cash needed
- —
Loan-product check · same deal, 3 products live
Conventional
25% down · 7.5% · 30yr
- Down + closing
- —
- Monthly P&I
- —
- Monthly cashflow
- —
- DSCR
- —
- Eligible?
- —
Personal DTI + credit; lowest rate.
DSCR
20% down · 8.5% · 30yr
- Down + closing
- —
- Monthly P&I
- —
- Monthly cashflow
- —
- DSCR
- —
- Eligible?
- —
No personal income docs; deal must DSCR.
Hard money
10% down · 12.0% · 12mo
- Down + closing
- —
- Monthly P&I
- —
- Monthly cashflow
- —
- DSCR
- —
- Eligible?
- —
Short-term bridge; refi at stabilization.
Rent comps 24 comps
| Address | Beds | Baths | Sqft | Rent | $/sqft | DOM | Units | Dist |
|---|---|---|---|---|---|---|---|---|
| 3109 22nd Ave W Bradenton, FL | 3.0 | 2.0 | 1509 | $2,541 | $1.68 | 11d | 1 | 0.09mi |
| 3301 19th Ave W Bradenton, FL | 4.0 | 2.0 | 1750 | $7,200 | $4.11 | 23d | 1 | 0.13mi |
| 1503 32nd St W Bradenton, FL | 3.0 | 2.0 | 1148 | $2,400 | $2.09 | 23d | 1 | 0.36mi |
| 3807 16th Ave W Bradenton, FL | 3.0 | 2.0 | 1491 | $2,100 | $1.41 | 23d | 1 | 0.45mi |
| 1408 37th Street Ct W Bradenton, FL | 3.0 | 2.0 | 1188 | $2,500 | $2.10 | 3d | 1 | 0.54mi |
| 3806 Southern Pkwy W Bradenton, FL | 3.0 | 2.0 | 1296 | $2,176 | $1.68 | 11d | 1 | 0.55mi |
| 2916 24th St W Bradenton, FL | 3.0 | 2.0 | 1764 | $1,800 | $1.02 | 23d | 1 | 0.69mi |
| 2306 30th Ave W Bradenton, FL | 3.0 | 2.0 | 945 | $1,700 | $1.80 | 23d | 1 | 0.75mi |
| 2004 20th Ave W Bradenton, FL | 3.0 | 2.0 | 1650 | $2,395 | $1.45 | 23d | 1 | 0.76mi |
| 2001 25th Ave W Bradenton, FL | 3.0 | 2.0 | 1370 | $3,000 | $2.19 | 20d | 1 | 0.81mi |
| 1214 21st St W Bradenton, FL | 3.0 | 3.0 | 1841 | $4,300 | $2.34 | 23d | 1 | 0.86mi |
| 3805 7th Ave W Bradenton, FL | 3.0 | 1.0 | 1000 | $2,200 | $2.20 | 23d | 1 | 0.93mi |
| 4904 19th Ave W Bradenton, FL | 3.0 | 2.0 | 1762 | $4,000 | $2.27 | 14d | 1 | 1.02mi |
| 1505 18th Avenue Dr W Bradenton, FL | 3.0 | 1.0 | 886 | $1,875 | $2.12 | 16d | 1 | 1.06mi |
| 5004 22nd Ave W Bradenton, FL | 3.0 | 2.0 | 1577 | $2,500 | $1.59 | 3d | 1 | 1.07mi |
| 1418 18th Avenue Dr W Unit 1418 Bradenton, FL | 3.0 | 2.0 | 1000 | $1,900 | $1.90 | 23d | 1 | 1.15mi |
| 520 22nd St W Unit 1071597P Bradenton, FL | 3.0 | 2.0 | 1582 | $4,235 | $2.68 | 2d | 1 | 1.15mi |
| 4607 7th Ave W Bradenton, FL | 3.0 | 1.0 | 1296 | $1,950 | $1.50 | 23d | 1 | 1.19mi |
| 1319 18th Ave W Bradenton, FL | 3.0 | 2.0 | 1185 | $1,795 | $1.51 | 23d | 1 | 1.19mi |
| 4107 41st St W Bradenton, FL | 3.0 | 2.0 | 1419 | $3,700 | $2.61 | 23d | 1 | 1.21mi |
| 5111 13th Avenue Dr W Bradenton, FL | 3.0 | 2.0 | 1778 | $3,700 | $2.08 | 23d | 1 | 1.24mi |
| 3506 14th St W Bradenton, FL | 3.0 | 1.0–2.0 | 874 | $1,950 | $2.23 | 23d | 5 | 1.26mi |
| 1623 8th Ave W Bradenton, FL | 3.0 | 2.0 | 1650 | $3,500 | $2.12 | 1d | 1 | 1.27mi |
| 3401 50th St W Bradenton, FL | 3.0 | 2.0 | 1418 | $2,699 | $1.90 | 23d | 1 | 1.27mi |
Listing history 34 events
-
2026-06-18days on market $327,000 Active 78 DOM
-
2026-06-17days on market $327,000 Active 77 DOM
-
2026-06-16days on market $327,000 Active 76 DOM
-
2026-06-15days on market $327,000 Active 75 DOM
-
2026-06-13days on market $327,000 Active 73 DOM
-
2026-06-13days on market $327,000 Active 72 DOM
-
2026-06-10days on market $327,000 Active 70 DOM
-
2026-06-09days on market $327,000 Active 69 DOM
-
2026-06-08days on market $327,000 Active 68 DOM
-
2026-06-08days on market $327,000 Active 67 DOM
-
2026-06-03days on market $327,000 Active 63 DOM
-
2026-06-02days on market $327,000 Active 62 DOM
-
2026-06-01days on market $327,000 Active 61 DOM
-
2026-05-31days on market $327,000 Active 60 DOM
-
2026-04-01$327,000 Active
-
2025-10-08historical $2,200
-
2025-09-23$2,200
-
2019-10-01soldstatus $167,000
-
2015-04-10soldstatus $116,500 Sold 173-char remark
Show marketing remark (173 chars)
This 3 bedroom 2 bath home features an open floor plan and 1458 sq. ft. of living space. living room and bonus area. Step outside into the privacy of the fenced in backyard.
-
2015-01-21status Pending 173-char remark
Show marketing remark (173 chars)
This 3 bedroom 2 bath home features an open floor plan and 1458 sq. ft. of living space. living room and bonus area. Step outside into the privacy of the fenced in backyard.
-
2015-01-06$119,900 Active 173-char remark
Show marketing remark (173 chars)
This 3 bedroom 2 bath home features an open floor plan and 1458 sq. ft. of living space. living room and bonus area. Step outside into the privacy of the fenced in backyard.
-
2013-06-05soldstatus $92,099
-
2013-05-23soldstatus $92,099 64-char remark
Show marketing remark (64 chars)
SHORT SALE. Pre-Approved list price by lender. Being SOLD AS-IS.
-
2013-02-18$76,000 64-char remark
Show marketing remark (64 chars)
SHORT SALE. Pre-Approved list price by lender. Being SOLD AS-IS.
-
2011-04-21historical
-
2010-02-19$58,000
-
2007-12-11soldstatus $147,000
-
2007-12-11soldstatus $147,000
-
2007-12-04soldstatus $147,000
-
2007-10-23$149,900
-
2007-10-18historical
-
2007-10-11$149,900
-
2007-10-09$159,900
-
1988-05-31soldstatus $57,500
ⓘ Source: listings_history table (triggers on properties + properties_extension) + one-shot
backfill from property_details.listing_events for pre-trigger history.
Tax reassessment forecast FL · Resets to sale price
- Current annual tax
- $2,243 · $187/mo
- Projected year-2 tax
- $2,714 · $226/mo
- Expected delta
- +$471/yr (+$39/mo · 21.0%)
ⓘ Screening estimate from a state-policy table — verify with the county assessor before closing.
Climate risk First Street
- Flood 1/10 Low FEMA zone X (unshaded) · 0% chance over 30 yrs
- Wildfire 1/10 Low
- Heat 10/10 Extreme 7 d/yr ≥107°F today · 31 d/yr by 30 yrs out
- Wind 10/10 Extreme 99% chance of damaging wind over 30 yrs
- Air quality 3/10 Moderate 2 unhealthy d/yr today · 2 by 30 yrs out
Nearby sold comps map
Loading sold comps map…
Walkable amenities ~0.75 mi
Loading nearby amenities…
Taxation est. · year 1
- Rental income
- $38,787
- − Mortgage interest
- −$18,317
- − Property taxes
- −$2,243
- − Insurance
- −$1,635
- − Repairs & maintenance
- −$3,103
- − Management
- −$3,103
- − Depreciation
- −$9,513
- Taxable income
- $873
- Est. tax owed @ 24.0%
- −$210
- After-tax cash flow
- $5,976/yr
For passive investors: Depreciation is non-cash, so a rental often shows a tax loss while cash-flowing — sheltering income. Rental losses are passive: they offset passive income freely, and up to $25,000/yr can offset ordinary (W-2) income if you actively participate and your MAGI is under $100k (phasing out to $0 by $150k); unused losses carry forward. On sale, claimed depreciation is recaptured at up to 25%, and gains may owe capital-gains tax (a 1031 exchange can defer both). Figures are a year-1 estimate at your 24.0% rate — not tax advice; consult a CPA.
Schools (NCES district)
- District
- Manatee
- NCES district ID
- 1201230
- Math proficiency
- 54% ▼ -6.00%
- Reading proficiency
- 50% ▼ -2.00%
- Median HH income
- $49,607
- Composite
- 44.43/100
- National rank
- #2806
- State rank
- #26 of 73 in FL
Livability — Bradenton
- Score
- 81/100
- State rank
- #101
- US rank
- #1528
Category grades
Schools grade is shown separately in the Schools card above.
Census & demographics
- Census place
- Bradenton, FL
- County
- Manatee County · 416,364 people
- City population
- 227,091
- Metro
- North Port-Sarasota-Bradenton, FL
- Population (ZIP)
- 31,946
- Household income
- $52,525
- Rent vs Own
- Severe rent burden
- 1736.0
Population outlook (Manatee County) Hauer SSP2
- Today (2025)
- 447,342 people
- By 2030
- 488,911 · +9.3%
- By 2040
- 567,934 · +27.0%
- By 2050
- 637,995 · +42.6%
- By 2075
- 781,970 · +74.8%
- By 2100
- 848,272 · +89.6%
Race, ethnicity, and origin ACS 2023
- Neighborhood character
- Predominantly White (65%)
- Race & ethnicity
- White 65% Hispanic / Latino 18% Black 10% Two or more races 9% Asian 2% Native American 1%
- Hispanic origin (detail)
- Mexican 7% Puerto Rican 4% Cuban 1%
- Common ancestry
- Hispanic 2% Romanian 2% Lithuanian 2%
- Foreign-born
- 15% · Canada, Vietnam
- Languages at home
- 78% English-only · Spanish 14% French/Haitian/Cajun 2% German/W. Germanic 1%
Political lean MEDSL · Manatee
- 2024 margin
- Strong R (+23.5) · D 37.9% · R 61.4%
- 2008→2024 swing
- -16.5pp toward R · 2008: -7.0pp · 2024: -23.5pp
- All cycles
- 2024: R+23.5 2020: R+16.1 2016: R+17.1 2012: R+12.5 2008: R+7.0
Not yet ingested
- Civics
- —
Market trends
- HPI YoY
- ▼ -310.18%
- Current HPI
- 369.8239
- Rent YoY
- ▼ -2.43%
- Metro
- North Port-Sarasota-Bradenton, FL
- State GDP YoY
- ▲ 3.28%
- F500 in state
- 36
Industry mix (Fortune 500 HQ in FL)
| Industry | F500 HQs | Revenue |
|---|---|---|
| Industrial Technology | 2 | $29B |
|
||
| Insurance | 2 | $17B |
|
||
| Retail | 1 | $60B |
|
||
| Technology Distribution | 1 | $58B |
|
||
| Homebuilding | 1 | $35B |
|
||
| Technology Manufacturing | 1 | $35B |
|
||
Price history
+468.7% since first listed20 events — show timeline
- 2026-04-01 Listed $327,000 Stellar MLS as Distributed by MLS Grid
- 2025-10-08 Rental Removed $2,200 STELLARMLS
- 2025-09-23 Listed for Rent $2,200 STELLARMLS
- 2019-10-01 Sold (Public Records) $167,000 Public Records
- 2015-04-10 Sold (MLS) $116,500 Stellar MLS as Distributed by MLS Grid
- 2015-01-21 Pending — Stellar MLS as Distributed by MLS Grid
- 2015-01-06 Listed $119,900 Stellar MLS as Distributed by MLS Grid
- 2013-06-05 Sold (Public Records) $92,099 Public Records
- 2013-05-23 Sold (MLS) $92,099 Stellar MLS as Distributed by MLS Grid
- 2013-02-18 Listed $76,000 Stellar MLS as Distributed by MLS Grid
- 2011-04-21 Listing Removed — Stellar MLS as Distributed by MLS Grid
- 2010-02-19 Listed $58,000 Stellar MLS as Distributed by MLS Grid
- 2007-12-11 Sold (Public Records) $147,000 Public Records
- 2007-12-11 Sold (MLS) $147,000 Stellar MLS as Distributed by MLS Grid
- 2007-12-04 Sold (MLS) $147,000 Stellar MLS as Distributed by MLS Grid
- 2007-10-23 Listed $149,900 Stellar MLS as Distributed by MLS Grid
- 2007-10-18 Listing Removed — Stellar MLS as Distributed by MLS Grid
- 2007-10-11 Listed $149,900 Stellar MLS as Distributed by MLS Grid
- 2007-10-09 Listed $159,900 Stellar MLS as Distributed by MLS Grid
- 1988-05-31 Sold (Public Records) $57,500 Public Records
Property tax history
+4.1%/yrLatest (2025): $2,243 · +3.2% YoY. Source: county tax records.
Cash-flow waterfall
monthlySold comps — $/sqft
last 12 mo · ≤1 miLoading sold comps…