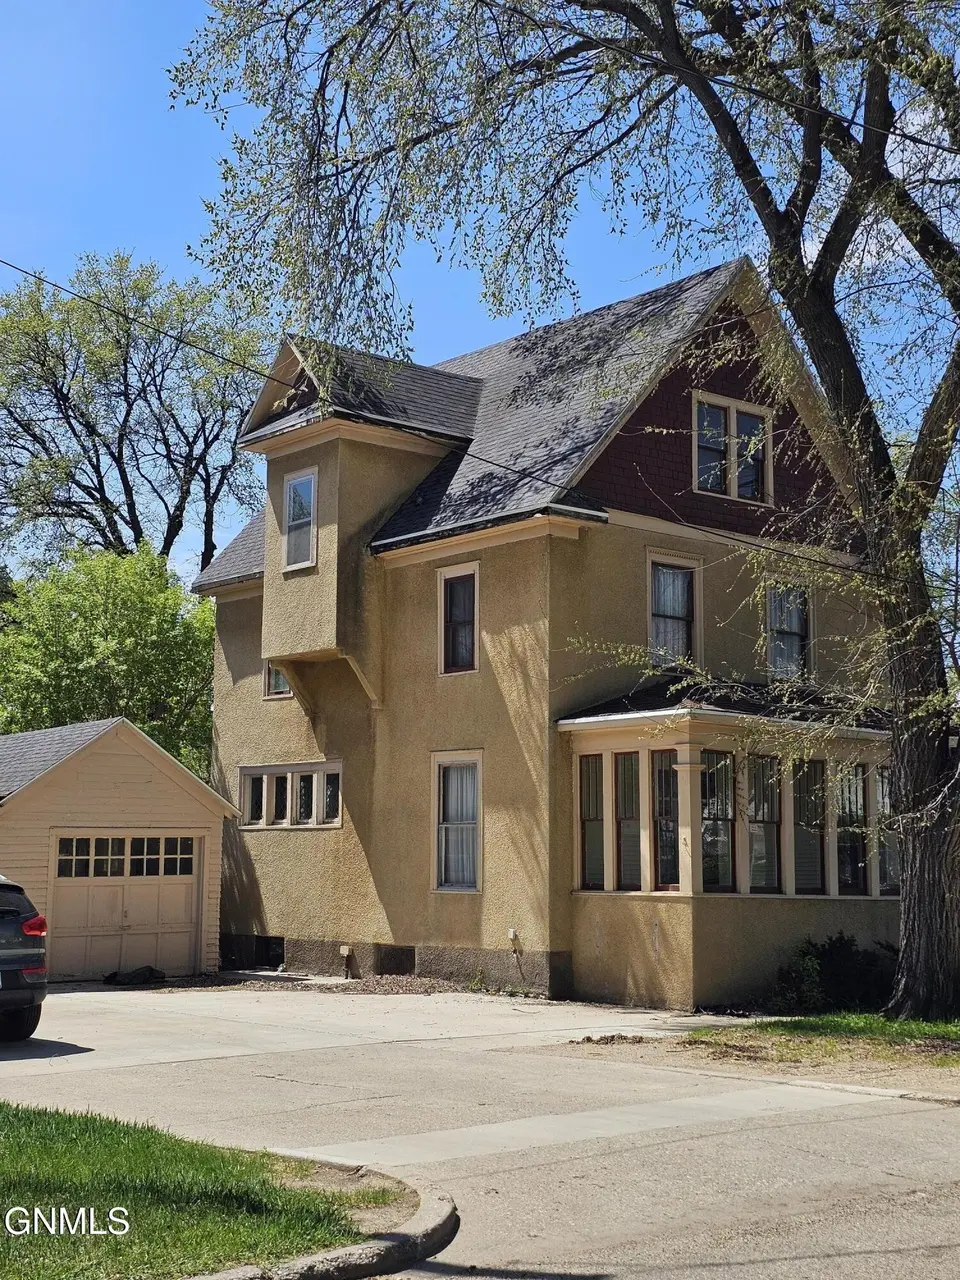
413 E B Ave E · Bismarck, ND
Flood risk 1/10 · Minimal
- FEMA flood zone
- X (unshaded)
- Chance of flooding over 30 yrs
- 0.0%
- Est. flood insurance / yr
- $473 – $860
Fire risk 2/10 · Minimal
- Est. fire insurance / yr
- $1,289 – $2,393
Heat risk 2/10 · Minimal
- Hot days now (above 97°F)
- 7 days/yr
- Hot days in 30 yrs
- 12 days/yr
Wind risk 2/10 · Minimal
- Chance of severe wind over 30 yrs
- —
Air-quality risk 4/10 · Minor
- Unhealthy air days now
- 5 days/yr
- Unhealthy air days in 30 yrs
- 5 days/yr
Risk factors via First Street. Map © Google.
Why this score? — see what drove the C- grade
The composite is a weighted blend of 9 inputs, each scored 0–100. Each bar is that input's sub-score; the figure is the points it added to the 100-point composite (weight × sub-score).
- ARV discount +15.0/15.0
- Cash flow +13.8/30.0
- Rent growth +5.0/5.0
- DSCR +4.2/10.0
- Livability +4.0/5.0
- 1% rule +3.9/10.0
- Schools +3.7/10.0
- Condition / age +2.2/5.0
- Appreciation +0.0/10.0
$209,900
🖨 Deal sheet (PDF) 📄 Offer letter ✓ Due diligence
Key facts
- Timeless character
- Original details
- Intricate woodwork
Tags
Property features AI
Exterior
- Parking: Detached or attached garage not specified — 1 garage space
- Utilities: Public water; Public sewer
- Home design: Single-family residence; Residential property
- Construction: Wood siding; Synthetic stucco exterior
- Exterior features: No notable exterior features listed
Interior
- Kitchen: Dishwasher; Range; Refrigerator
- Bathrooms: 1 full bathroom
- Heating & cooling: Baseboard heating (natural gas); No cooling
- Interior features: Window treatments; Unfinished basement
Neighborhood map
What this means for you Summary
Snapshot
- This is a 6-bed/1.0-bath single-family listed at $210k. Condition is rated fair.
Deal economics
- At list price, monthly cash flow is $21 ($251/yr) — positive.
- The deal already cash-flows at list — no discount required.
- To meet the 1% rule (rent ≥ 1% of price), the offer needs to be $186k (11.3% below list).
- Recommended offer: $186k (11.3% below list) — sets the bar for 1% rule.
- Cap rate 6.4% vs local median 3.1% in Bismarck — top-decile yield for the area; either an underpriced asset or a hidden risk that comps aren't pricing in. Stress-test before assuming the spread holds.
Location & tenants
- Location reads 79/100 on livability (#5 in ND, #2,213 nationally) — a middle-class / working-renter tenant base. Strengths: housing A+, health & safety A+, cost of living A; Watch: crime C-, amenities D+, commute F.
- Bismarck 1 (urban): math 41% / reading 42% proficiency, ranked #25 of 53 in ND (top 47%) — families likely to look elsewhere, expect single-tenant / working-renter base with shorter leases; only 19% free/reduced lunch — higher-income household profile.
- Zoned schools: Becep Center (332 students, 0% FRL); Wachter Middle School (math 34% / reading 34%, grade F, #26 of 35 statewide, top 79%, 1,000 students, 30% FRL); Bismarck High School (math 22% / reading 38%, grade F, #90 of 144 statewide, top 66%, 1,333 students, 27% FRL) — zoned schools at 19% FRL track the district average.
- Market conditions: Rents rising fast (+10.8%/yr); 128 active listings in the ZIP; 1 comparable units currently listed for rent nearby; 259 units permitted in Burleigh County in 2024 (0 in 5+ unit buildings).
- This rent runs 33% of the median local income ($69k/yr) — at the standard rent-burdened threshold; future hikes will face affordability resistance.
Forward outlook
- Local home prices are declining (-3.0%/yr); year-one equity from $1k of loan paydown is wiped out by about $6k of value loss. Plan a longer hold.
- Burleigh County population projected at +61% by 2050 — long-run rental-demand tailwind backs the buy-and-hold thesis.
Negotiation context
- It's been on market 76 days — a 6% lower offer ($197k) is reasonable based on typical stale-listing flexibility.
Risks & watch-outs
- Watch-outs: built in 1914 — expect roof / HVAC / electrical / plumbing capex.
Questions for the listing agent
- It's been on market 76 days. Have you received any prior offers? Is the seller open to a 11% concession, seller financing, or rate buy-down credit?
- Have any recent inspections been done? Can we get a copy of the seller's disclosures and any deferred-maintenance estimates?
- Built in 1914 — when were the roof, HVAC, electrical panel, plumbing, and water heater last replaced?
- Why hasn't it sold? Are there any deal-killer items the seller is aware of (foundation, flood, title, zoning, code violations)?
- Is there a deadline driving the sale (1031 exchange, divorce, estate, relocation)? That informs how much negotiation room exists.
- Schools are B-rated — typically a magnet for longer-tenancy family renters. What's the average tenant stay here, and is there a school-zone premium baked into asking?
- What's the average days-on-market for RENTAL listings here right now (not sales)? A rising rental-DOM trend means longer vacancies and softer asking-rent achievability than the comps imply.
- What's the recent tenant-quality profile in this submarket — average credit score on applications, eviction rate, late-payment / NSF rate, and stable-employment percentage? A property-management company in the area should have these aggregated.
- How much new for-sale + rental construction is in the pipeline within 1–3 miles? Heavy new supply typically softens prices + rents 12–24 months out; constrained supply supports both.
Investment metrics
- 1% rule
- 0.89% ✗
- Cap rate
- 6.41%
- Cash-on-cash
- 0.43%
- DSCR
- 1.02
- GRM
- 9.4
CMA / ARV
- ARV (on-the-fly)
- $262,856
- Comps found
- 3
Show comp detail 3 sales within ~0.75 mi
| Address | Dist | Beds/Ba | Sqft | Sold | Price | $/sf | Match |
|---|---|---|---|---|---|---|---|
| 909 1st St N | 0.37mi | 5/2.0 (-1) | 2,168 (-4%) | 4mo | $364,900 | $168 | 63 |
| 130 Boulevard Ave W | 0.55mi | 6/2.0 | 2,140 (-6%) | 9mo | $247,900 | $116 | 53 |
| 521 N 10th St | 0.41mi | 5/2.5 (-1) | 2,468 (+9%) | 15mo | $140,000 | $57 | 43 |
Match score weights: distance 35% · size 25% · config 20% · recency 20%. Top-matched comps best support the ARV.
Projected returns pro-forma
-3.0% appreciation · 8.0% rent growth · sell at horizon
- IRR
- -10.1%
- Equity multiple
- 0.61×
- Total profit
- $-22,809
- Equity at exit
- $31,297
- IRR
- 5.1%
- Equity multiple
- 1.46×
- Total profit
- $26,771
- Equity at exit
- $18,148
Cash invested: $58,772 (down + closing). Projections, not guarantees.
Landlord ↔ Tenant lean methodology
- Overall (STATE)
- 82 Strongly Landlord-Friendly
- State North Dakota
- 82 Strongly Landlord-Friendly · R+20
- County
- — inherits STATE
- City
- — inherits STATE
ZIP-level market 58501
- Rents YoY
- 10.8%
- Active inventory
- 128
- Price-to-rent
- 9.4×
Monthly cashflow live
- Estimated rent
- $1,863 medium interval (Pro) →
- Mortgage (P&I)
- −$1,101
- Tax est. 1.5%
- −$262 /mo · $3,148/yr
- Insurance
- −$87
- HOA
- −$0
- Vacancy / Maint / Mgmt
- −$391
- Net cashflow
- $21
Break-even live
Sensitivity live
| Price | -10% $166 | -5% $93 | +0% $21 | +5% $-52 | +10% $-124 |
|---|---|---|---|---|---|
| Rent | -10% $-126 | -5% $-53 | +0% $21 | +5% $94 | +10% $168 |
| Rate | -1.0pp $127 | -0.5pp $74 | base $21 | +0.5pp $-33 | +1.0pp $-89 |
UW: 25.0% down · 7.5% · 30yr · 1.5% tax · 5.0% vac · 8.0% maint · 8.0% mgmt
Financing live
Cash to close
- Down payment
- $52,475
- Closing costs
- $6,297
- Reserves months
- —
- Total cash needed
- —
Loan-product check · same deal, 3 products live
Conventional
25% down · 7.5% · 30yr
- Down + closing
- —
- Monthly P&I
- —
- Monthly cashflow
- —
- DSCR
- —
- Eligible?
- —
Personal DTI + credit; lowest rate.
DSCR
20% down · 8.5% · 30yr
- Down + closing
- —
- Monthly P&I
- —
- Monthly cashflow
- —
- DSCR
- —
- Eligible?
- —
No personal income docs; deal must DSCR.
Hard money
10% down · 12.0% · 12mo
- Down + closing
- —
- Monthly P&I
- —
- Monthly cashflow
- —
- DSCR
- —
- Eligible?
- —
Short-term bridge; refi at stabilization.
Rent comps 1 comps
| Address | Beds | Baths | Sqft | Rent | $/sqft | DOM | Units | Dist |
|---|---|---|---|---|---|---|---|---|
| 1513 N 18th St Bismarck, ND | 5.0 | 2.0 | 2100 | $2,250 | $1.07 | 23d | 1 | 1.28mi |
Listing history 23 events
-
2026-06-21days on market $209,900 Active 76 DOM
-
2026-06-19days on market $209,900 Active 74 DOM
-
2026-06-18days on market $209,900 Active 73 DOM
-
2026-06-17days on market $209,900 Active 72 DOM
-
2026-06-16days on market $209,900 Active 71 DOM
-
2026-06-15days on market $209,900 Active 70 DOM
-
2026-06-14days on market $209,900 Active 68 DOM
-
2026-06-13days on market $209,900 Active 67 DOM
-
2026-06-10days on market $209,900 Active 65 DOM
-
2026-06-09days on market $209,900 Active 64 DOM
-
2026-06-08days on market $209,900 Active 63 DOM
-
2026-06-07days on market $209,900 Active 62 DOM
-
2026-06-05days on market $209,900 Active 59 DOM
-
2026-06-03days on market $209,900 Active 58 DOM
-
2026-06-02days on market $209,900 Active 57 DOM
-
2026-06-01days on market $209,900 Active 56 DOM
-
2026-05-31days on market $209,900 Active 55 DOM
-
2026-05-30days on market $209,900 Active 54 DOM
-
2026-05-05price $209,900
-
2026-04-06$219,900 Active
-
2026-03-02price $229,900
-
2025-11-06price $249,900
-
2025-08-06price $269,900
ⓘ Source: listings_history table (triggers on properties + properties_extension) + one-shot
backfill from property_details.listing_events for pre-trigger history.
Climate risk First Street
- Flood 1/10 Low FEMA zone X (unshaded) · 0% chance over 30 yrs
- Wildfire 2/10 Low
- Heat 2/10 Low 7 d/yr ≥97°F today · 12 d/yr by 30 yrs out
- Wind 2/10 Low
- Air quality 4/10 Moderate 5 unhealthy d/yr today · 5 by 30 yrs out
Nearby sold comps map
Loading sold comps map…
Walkable amenities ~0.75 mi
Loading nearby amenities…
Taxation est. · year 1
- Rental income
- $22,352
- − Mortgage interest
- −$11,758
- − Property taxes
- −$3,148
- − Insurance
- −$1,050
- − Repairs & maintenance
- −$1,788
- − Management
- −$1,788
- − Depreciation
- −$6,106
- Taxable loss
- −$3,286
- Est. tax savings @ 24.0%
- +$789
- After-tax cash flow
- $1,040/yr
For passive investors: Depreciation is non-cash, so a rental often shows a tax loss while cash-flowing — sheltering income. Rental losses are passive: they offset passive income freely, and up to $25,000/yr can offset ordinary (W-2) income if you actively participate and your MAGI is under $100k (phasing out to $0 by $150k); unused losses carry forward. On sale, claimed depreciation is recaptured at up to 25%, and gains may owe capital-gains tax (a 1031 exchange can defer both). Figures are a year-1 estimate at your 24.0% rate — not tax advice; consult a CPA.
Condition & rehab AI · 12 photos
This property requires moderate renovations to improve its condition and increase its value. Focus on updating the kitchen and bathroom, as well as the exterior, to attract more buyers and renters.
Repairs flagged
- Major kitchen cabinets — severely outdated and in poor condition
- Major bathroom fixtures — missing and in poor condition
- Moderate roof — visible wear
Value-add opportunities
- Both kitchen renovation — modernizing the kitchen can significantly increase both resale and rental value
- Both bathroom renovation — upgrading the bathroom can also boost both resale and rental value
- Both exterior painting and landscaping — improving the exterior can enhance curb appeal and attract more buyers/renters
Renovation cost estimate screening
| Repair item | Severity | Est. cost |
|---|---|---|
| kitchen cabinets · severely outdated and in poor condition | Major | $15,000–50,000 |
| bathroom fixtures · missing and in poor condition | Major | $15,000–50,000 |
| roof · visible wear | Moderate | $3,000–15,000 |
| Total estimated repair cost · 3 items | $33,000–115,000 |
Value-add ROI direction
- Both kitchen renovation — modernizing the kitchen can significantly increase both resale and rental value ↑
- Both bathroom renovation — upgrading the bathroom can also boost both resale and rental value ↑
- Both exterior painting and landscaping — improving the exterior can enhance curb appeal and attract more buyers/renters ↑
ⓘ Cost ranges are severity-bucket heuristics (US national rule-of-thumb). Get contractor quotes + a written scope before underwriting a rehab budget.
Schools (NCES district)
- District
- Bismarck 1
- NCES district ID
- 3800014
- Math proficiency
- 41% ▼ -5.00%
- Reading proficiency
- 42% ▼ -6.00%
- Median HH income
- $60,649
- Composite
- 36.76/100
- National rank
- #4577
- State rank
- #25 of 53 in ND
Livability — Bismarck
- Score
- 79/100
- State rank
- #5
- US rank
- #2213
Category grades
Schools grade is shown separately in the Schools card above.
Census & demographics
- Census place
- Bismarck, ND
- County
- Burleigh County · 97,300 people
- City population
- 97,300
- Metro
- Bismarck, ND
- Population (ZIP)
- 29,405
- Household income
- $68,755
- Rent vs Own
- Severe rent burden
- 865.0
Population outlook (Burleigh County) Hauer SSP2
- Today (2025)
- 119,359 people
- By 2030
- 133,047 · +11.5%
- By 2040
- 161,545 · +35.3%
- By 2050
- 191,960 · +60.8%
- By 2075
- 274,569 · +130.0%
- By 2100
- 350,910 · +194.0%
Race, ethnicity, and origin ACS 2023
- Neighborhood character
- Predominantly White (82%)
- Race & ethnicity
- White 82% Native American 5% Two or more races 5% Black 4% Hispanic / Latino 4%
- Common ancestry
- Portuguese 14% Scotch-Irish 3% Lithuanian 3%
- Foreign-born
- 4% · Canada
- Languages at home
- 96% English-only · Spanish 2%
Political lean MEDSL · Burleigh
- 2024 margin
- Solid R (+43.2) · D 27.5% · R 70.7% · Other 1.8%
- 2008→2024 swing
- -19.7pp toward R · 2008: -23.6pp · 2024: -43.2pp
- All cycles
- 2024: R+43.2 2020: R+40.2 2016: R+46.1 2012: R+32.1 2008: R+23.6
Not yet ingested
- Civics
- —
Market trends
- HPI YoY
- ▼ -260.24%
- Current HPI
- 218.67
- Rent YoY
- ▲ 10.82%
- Metro
- Bismarck, ND
- State GDP YoY
- ▲ 2.09%
- F500 in state
- 2
Industry mix (Fortune 500 HQ in ND)
| Industry | F500 HQs | Revenue |
|---|---|---|
| Utilities / Construction | 1 | $6B |
|
||
Price history
-22.2% since first listed5 events — show timeline
- 2026-05-05 Price Changed $209,900 GNMLS
- 2026-04-06 Listed $219,900 GNMLS
- 2026-03-02 Price Changed $229,900 GNMLS
- 2025-11-06 Price Changed $249,900 GNMLS
- 2025-08-06 Price Changed $269,900 GNMLS
Cash-flow waterfall
monthlySold comps — $/sqft
last 12 mo · ≤1 miLoading sold comps…