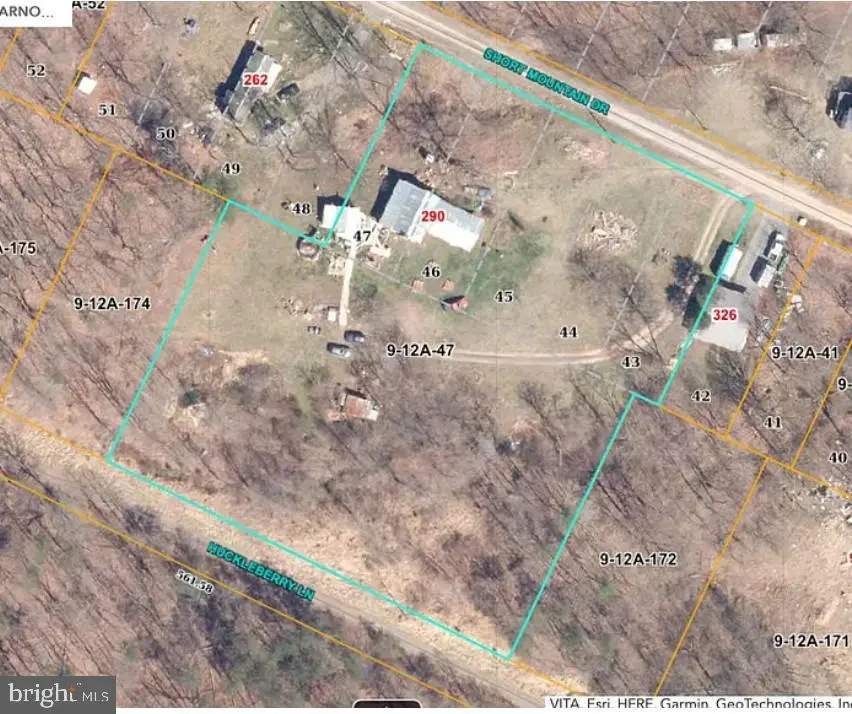
290 Short Mountain Dr · Augusta, WV
Flood risk 1/10 · Minimal
- FEMA flood zone
- X (unshaded)
- Chance of flooding over 30 yrs
- 0.0%
- Est. flood insurance / yr
- $507 – $1,088
Fire risk 5/10 · Moderate
- Est. fire insurance / yr
- $787 – $1,461
Heat risk 4/10 · Minor
- Hot days now (above 97°F)
- 7 days/yr
- Hot days in 30 yrs
- 18 days/yr
Wind risk 2/10 · Minimal
- Chance of severe wind over 30 yrs
- —
Air-quality risk 1/10 · Minimal
- Unhealthy air days now
- 0 days/yr
- Unhealthy air days in 30 yrs
- 0 days/yr
Risk factors via First Street. Map © Google.
Why this score? — see what drove the B grade
The composite is a weighted blend of 9 inputs, each scored 0–100. Each bar is that input's sub-score; the figure is the points it added to the 100-point composite (weight × sub-score).
- Cash flow +30.0/30.0
- 1% rule +10.0/10.0
- DSCR +10.0/10.0
- ARV discount +7.5/15.0
- Appreciation +5.6/10.0
- Schools +2.6/10.0
- Rent growth +2.5/5.0
- Livability +2.5/5.0
- Condition / age +2.5/5.0
$69,000
🖨 Deal sheet 📄 Offer letter ✓ Due diligence
Listing remarks
Bank-owned opportunity in Elk Horn Subdivision! Situated on 2.7 acres, this 2-bedroom, 1-bath mobile home offers great potential for investors, flippers, or buyers looking for a renovation project. Features include a living room, eat-in kitchen, and two bedrooms sharing a full hall bath. Property requires a full rehab and is being sold as-is. Bring your vision and make this property your own!
Key facts
- 2.7 acre lot
- Built 1974
- Listed 41 days
Property features AI
Finance
- Other: Fee simple ownership
- HOA & community: Annual HOA fee of $150
Exterior
- Parking: Driveway
- Utilities: Well water; On-site septic; Electric available; Water available; Sewer available
- Home design: Single-wide mobile home (pre-1976); Major rehab needed
- Construction: Frame construction; Metal roof; Other foundation
- Exterior features: Outside city limits (Sherman); Additional parcel included (0912A0174)
Interior
- Bedrooms: Two bedrooms on the main level
- Bathrooms: One full bathroom; One half bathroom
- Heating & cooling: Wood-burning stove heating; Window air conditioning units; Electric hot water
- Interior features: Drywall walls and ceilings; One fireplace
Neighborhood map
What this means for you Summary
Snapshot
- This is a 2-bed/1.5-bath single-family listed at $69k.
Deal economics
- At list price, monthly cash flow is $522 ($6k/yr) — positive.
- The deal already cash-flows at list — no discount required.
- Meets the 1% rule at list price ($1k rent vs $69k).
- Recommended offer: $67k (3.0% below list) — sets the bar for market timing.
Location & tenants
- Location reads: area grade B — affects rentability + tenant quality, not the cash-flow math above.
- Hampshire County Schools (rural): math 25% / reading 38% proficiency, ranked #30 of 55 in WV (top 54%) — families likely to look elsewhere, expect single-tenant / working-renter base with shorter leases.
- Market conditions: 37 active listings in the ZIP; 124 units permitted in Hampshire County in 2024 (0 in 5+ unit buildings).
Forward outlook
- In year one you build about $1k of equity ($477 loan paydown + $777 appreciation (1.1% local appreciation)).
- Hampshire County population projected at -29% by 2050 — secular population decline; favor cash flow + early exit over multi-decade hold.
- At projected returns (1.1% appreciation + 3.0% rent growth), your $19k cash investment doubles in ~3 years — after that, you're playing with house money.
Negotiation context
- It's been on market 42 days — a 3% lower offer ($67k) is reasonable based on typical stale-listing flexibility.
- 3 sale attempts since 4y ago; this cycle's ask has dropped $10k (12%) from the opening price — seller is motivated, your offer sets the floor, not the list.
Risks & watch-outs
- Climate carrying-cost: moderate wildfire risk — expect insurance premiums to compound above CPI over the hold.
Questions for the listing agent
- It's been on market 42 days. Have you received any prior offers? Is the seller open to a 3% concession, seller financing, or rate buy-down credit?
- Built in 1974 — when were the roof, HVAC, electrical panel, plumbing, and water heater last replaced?
- What does the HOA fee cover, when was the last increase, and are there any pending special assessments or reserve-fund shortfalls?
- Is there a deadline driving the sale (1031 exchange, divorce, estate, relocation)? That informs how much negotiation room exists.
- What's the average days-on-market for RENTAL listings here right now (not sales)? A rising rental-DOM trend means longer vacancies and softer asking-rent achievability than the comps imply.
- What's the recent tenant-quality profile in this submarket — average credit score on applications, eviction rate, late-payment / NSF rate, and stable-employment percentage? A property-management company in the area should have these aggregated.
- How much new for-sale + rental construction is in the pipeline within 1–3 miles? Heavy new supply typically softens prices + rents 12–24 months out; constrained supply supports both.
Investment metrics
- 1% rule
- 1.74% ✓
- Cap rate
- 15.37%
- Cash-on-cash
- 32.43%
- DSCR
- 2.44
- GRM
- 4.8
CMA / ARV
No comps found within radius.
Projected returns pro-forma
1.13% appreciation · 3.0% rent growth · sell at horizon
- IRR
- 35.0%
- Equity multiple
- 2.81×
- Total profit
- $34,957
- Equity at exit
- $24,011
- IRR
- 37.1%
- Equity multiple
- 5.49×
- Total profit
- $86,695
- Equity at exit
- $32,263
Cash invested: $19,320 (down + closing). Projections, not guarantees.
Landlord ↔ Tenant lean methodology
- Overall (STATE)
- 83 Strongly Landlord-Friendly
- State West Virginia
- 83 Strongly Landlord-Friendly · R+22
- County
- — inherits STATE
- City
- — inherits STATE
ZIP-level market 26704
- Home prices YoY
- 0.6%
- Active inventory
- 37
- Price-to-rent
- 4.8×
Monthly cashflow live
- Estimated rent
- $1,203 medium interval (Pro) →
- Mortgage (P&I)
- −$362
- Tax from tax record
- −$25 /mo · $299/yr
- Insurance
- −$29
- HOA
- −$13
- Vacancy / Maint / Mgmt
- −$253
- Net cashflow
- $522
Break-even live
UW: 25.0% down · 7.5% · 30yr · 1.5% tax · 5.0% vac · 8.0% maint · 8.0% mgmt
Financing live
Cash to close
- Down payment
- $17,250
- Closing costs
- $2,070
- Reserves months
- —
- Total cash needed
- —
Loan-product check · same deal, 3 products live
Conventional
25% down · 7.5% · 30yr
- Down + closing
- —
- Monthly P&I
- —
- Monthly cashflow
- —
- DSCR
- —
- Eligible?
- —
Personal DTI + credit; lowest rate.
DSCR
20% down · 8.5% · 30yr
- Down + closing
- —
- Monthly P&I
- —
- Monthly cashflow
- —
- DSCR
- —
- Eligible?
- —
No personal income docs; deal must DSCR.
Hard money
10% down · 12.0% · 12mo
- Down + closing
- —
- Monthly P&I
- —
- Monthly cashflow
- —
- DSCR
- —
- Eligible?
- —
Short-term bridge; refi at stabilization.
HOA detail
- Monthly dues
- $13 · $156/yr
Listing history 22 events
-
2026-06-19days on market $69,000 Active 42 DOM
-
2026-06-18days on market $69,000 Active 41 DOM
-
2026-06-17days on market $69,000 Active 40 DOM
-
2026-06-17price $69,000 Active 39 DOM
-
2026-06-16days on market $78,500 Active 39 DOM
-
2026-06-15days on market $78,500 Active 38 DOM
-
2026-06-14days on market $78,500 Active 36 DOM
-
2026-06-12days on market $78,500 Active 35 DOM
-
2026-06-09days on market $78,500 Active 32 DOM
-
2026-06-08days on market $78,500 Active 31 DOM
-
2026-06-07days on market $78,500 Active 30 DOM
-
2026-06-05days on market $78,500 Active 27 DOM
-
2026-06-03days on market $78,500 Active 26 DOM
-
2026-06-02days on market $78,500 Active 25 DOM
-
2026-06-01days on market $78,500 Active 24 DOM
-
2026-05-31days on market $78,500 Active 23 DOM
-
2026-05-30days on market $78,500 Active 22 DOM
-
2026-05-08$78,500 Active
-
2024-02-13soldstatus $95,000
-
2022-11-04soldstatus $85,000 Closed
-
2022-10-06Active Under Contract
-
2022-10-06$85,000
ⓘ Source: listings_history table (triggers on properties + properties_extension) + one-shot
backfill from property_details.listing_events for pre-trigger history.
Tax reassessment forecast WV · Resets to sale price
- Current annual tax
- $299 · $25/mo
- Projected year-2 tax
- $407 · $34/mo
- Expected delta
- +$108/yr (+$9/mo · 35.9%)
ⓘ Screening estimate from a state-policy table — verify with the county assessor before closing.
Climate risk First Street
- Flood 1/10 Low FEMA zone X (unshaded) · 0% chance over 30 yrs
- Wildfire 5/10 Major
- Heat 4/10 Moderate 7 d/yr ≥97°F today · 18 d/yr by 30 yrs out
- Wind 2/10 Low
- Air quality 1/10 Low 0 unhealthy d/yr today · 0 by 30 yrs out
Nearby sold comps map
Loading sold comps map…
Walkable amenities ~0.75 mi
Loading nearby amenities…
Taxation est. · year 1
- Rental income
- $14,440
- − Mortgage interest
- −$3,865
- − Property taxes
- −$299
- − Insurance
- −$345
- − Repairs & maintenance
- −$1,155
- − Management
- −$1,155
- − HOA
- −$156
- − Depreciation
- −$2,007
- Taxable income
- $5,456
- Est. tax owed @ 24.0%
- −$1,310
- After-tax cash flow
- $4,955/yr
For passive investors: Depreciation is non-cash, so a rental often shows a tax loss while cash-flowing — sheltering income. Rental losses are passive: they offset passive income freely, and up to $25,000/yr can offset ordinary (W-2) income if you actively participate and your MAGI is under $100k (phasing out to $0 by $150k); unused losses carry forward. On sale, claimed depreciation is recaptured at up to 25%, and gains may owe capital-gains tax (a 1031 exchange can defer both). Figures are a year-1 estimate at your 24.0% rate — not tax advice; consult a CPA.
Schools (NCES district)
- District
- Hampshire County Schools
- NCES district ID
- 5400420
- Math proficiency
- 25% ▼ -16.00%
- Reading proficiency
- 38% ▼ -8.00%
- Median HH income
- $32,170
- Composite
- 25.69/100
- National rank
- #7392
- State rank
- #30 of 55 in WV
Livability — Augusta
No livability data for this city. (Only ~50 U.S. cities are tracked.)
Census & demographics
- Population (ZIP)
- 5,403
Population outlook (Hampshire County) Hauer SSP2
- Today (2025)
- 21,820 people
- By 2030
- 20,690 · -5.2%
- By 2040
- 18,089 · -17.1%
- By 2050
- 15,413 · -29.4%
- By 2075
- 10,421 · -52.2%
- By 2100
- 6,842 · -68.6%
Race, ethnicity, and origin ACS 2023
- Neighborhood character
- Predominantly White (94%)
- Race & ethnicity
- White 94% Hispanic / Latino 3% Black 2% Two or more races 1%
- Common ancestry
- Lithuanian 6% Slovak 4% Serbian 2%
- Foreign-born
- 0%
- Languages at home
- 99% English-only · Spanish 1%
Political lean MEDSL · Hampshire
- 2024 margin
- Solid R (+62.6) · D 18.0% · R 80.6% · Other 1.4%
- 2008→2024 swing
- -35.8pp toward R · 2008: -26.8pp · 2024: -62.6pp
- All cycles
- 2024: R+62.6 2020: R+60.4 2016: R+59.2 2012: R+40.4 2008: R+26.8
Not yet ingested
- Civics
- —
Market trends
- HPI YoY
- ▲ 1.13%
- Current HPI
- 188.2808
- Rent YoY
- —
- Metro
- —
- State GDP YoY
- —
- F500 in state
- 0
Price history
-7.6% since first listed5 events — show timeline
- 2026-05-08 Listed $78,500 BRIGHT MLS
- 2024-02-13 Sold (Public Records) $95,000 Public Records
- 2022-11-04 Sold (MLS) $85,000 BRIGHT MLS
- 2022-10-06 Listed — BRIGHT MLS
- 2022-10-06 Listed $85,000 BRIGHT MLS
Property tax history
+1.3%/yrLatest (2025): $299 · -48.4% YoY. Source: county tax records.
Cash-flow waterfall
monthlySold comps — $/sqft
last 12 mo · ≤1 miLoading sold comps…