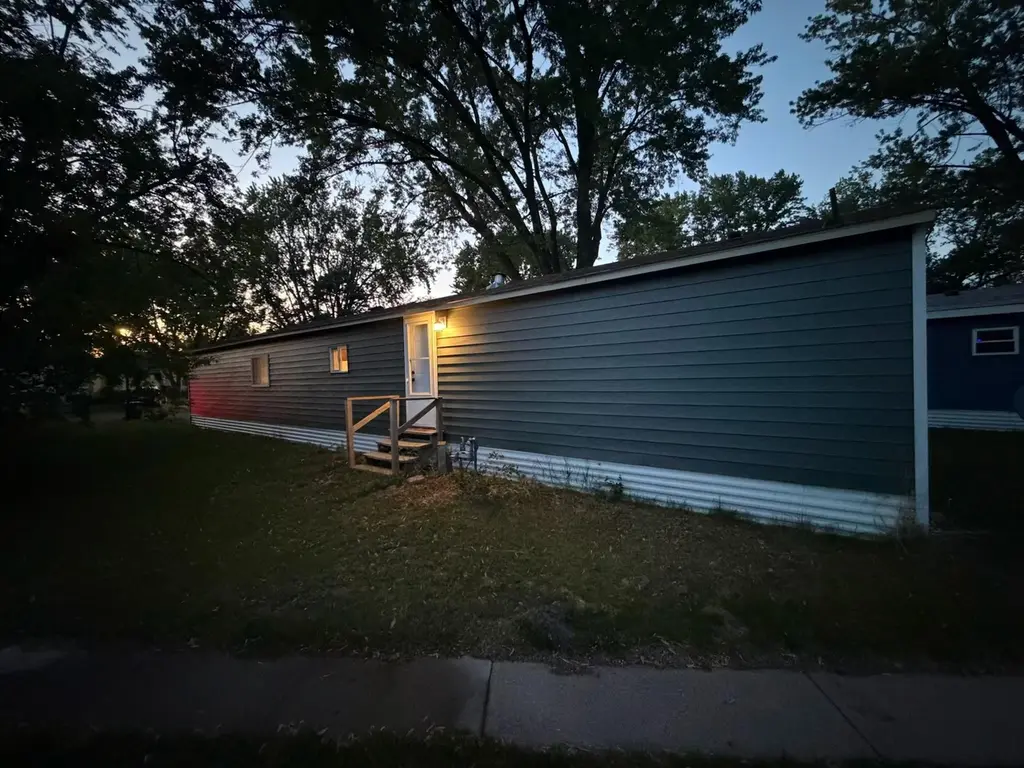
3328 90th Dr NE · Blaine, MN
Flood risk 1/10 · Minimal
- FEMA flood zone
- X (unshaded)
- Chance of flooding over 30 yrs
- 0.0%
- Est. flood insurance / yr
- $473 – $860
Fire risk 1/10 · Minimal
- Est. fire insurance / yr
- $888 – $1,650
Heat risk 2/10 · Minimal
- Hot days now (above 100°F)
- 7 days/yr
- Hot days in 30 yrs
- 14 days/yr
Wind risk 2/10 · Minimal
- Chance of severe wind over 30 yrs
- —
Air-quality risk 2/10 · Minimal
- Unhealthy air days now
- 1 days/yr
- Unhealthy air days in 30 yrs
- 1 days/yr
Risk factors via First Street. Map © Google.
Why this score? — see what drove the D+ grade
The composite is a weighted blend of 9 inputs, each scored 0–100. Each bar is that input's sub-score; the figure is the points it added to the 100-point composite (weight × sub-score).
- Cash flow +15.0/30.0
- ARV discount +7.5/15.0
- 1% rule +5.0/10.0
- DSCR +5.0/10.0
- Schools +4.0/10.0
- Condition / age +4.0/5.0
- Rent growth +3.6/5.0
- Livability +3.6/5.0
- Appreciation +0.0/10.0
$49,900
🖨 Deal sheet 📄 Offer letter ✓ Due diligence
Listing remarks
Affordable homeownership starts here! Skip the rent cycle and start building equity! This home is perfect for anyone looking for an affordable place to call their own. Conveniently located near shopping, dining, and parks. Easy access to highways and public transportation. Opportunities like this don't come around often, schedule your showing today. Land rent is $675.00 Monthly.
Key facts
- Conveniently located
- Built 1985
- Listed 15 days
Tags
Property features AI
Finance
- Other: Living area approximately 925 square feet
- Financial info: Monthly land lease: $675
- HOA & community: Centennial Square Manufactured Homes Park (land is leased)
Exterior
- Parking: Asphalt parking
- Utilities: City water connected; City sewer connected; Natural gas
- Home design: Residential manufactured home; One story
- Construction: Foundation area approximately 925; Age of roof 8 years or less; No basement
- Exterior features: Storage shed; No fencing; City street frontage; Publicly maintained road
Interior
- Kitchen: Range; Refrigerator; Exhaust fan
- Bedrooms: 2 bedrooms (both on the main level)
- Bathrooms: 1 full bathroom; 1 three-quarter bathroom; Private primary bath
- Heating & cooling: Forced air heating; Window air conditioning units
- Interior features: All living facilities on one level; Main floor primary bedroom; Main floor bedroom; Main floor laundry
- Laundry & utility: Washer; Dryer; Laundry on main level
Neighborhood map
What this means for you Summary
Snapshot
- This is a 2-bed/2.0-bath manufactured listed at $50k. Condition is rated good.
Deal economics
- At list price, monthly cash flow is $2k ($19k/yr) — positive.
- The deal already cash-flows at list — no discount required.
- Meets the 1% rule at list price ($2k rent vs $50k).
- Recommended offer: $49k (1.5% below list) — sets the bar for market timing.
- Cap rate 44.3% vs local median 3.9% in Blaine — top-decile yield for the area; either an underpriced asset or a hidden risk that comps aren't pricing in. Stress-test before assuming the spread holds.
Location & tenants
- Location reads 71/100 on livability (#315 in MN) — a middle-class / working-renter tenant base. Strengths: employment A+, housing A+, crime A; Watch: amenities F, commute F.
- Spring Lake Park Public Schools (suburban): math 41% / reading 49% proficiency, ranked #162 of 301 in MN (top 54%) — families likely to look elsewhere, expect single-tenant / working-renter base with shorter leases.
- Market conditions: Rents rising fast (+4.4%/yr); 245 active listings in the ZIP; 2 comparable units currently listed for rent nearby; high-income renter base; 1,083 units permitted in Anoka County in 2024 (134 in 5+ unit buildings).
Forward outlook
- Local home prices are declining (-3.0%/yr); year-one equity from $345 of loan paydown is wiped out by about $1k of value loss. Plan a longer hold.
- Anoka County population projected at +11% by 2050 — modest demand growth; plan on rents tracking national, not racing it.
- At projected returns (-3.0% appreciation + 4.4% rent growth), your $14k cash investment doubles in ~1 year — after that, you're playing with house money.
Negotiation context
- It's been on market 15 days — a 2% lower offer ($49k) is reasonable based on typical stale-listing flexibility.
Questions for the listing agent
- Is there a deadline driving the sale (1031 exchange, divorce, estate, relocation)? That informs how much negotiation room exists.
- Schools are B-rated — typically a magnet for longer-tenancy family renters. What's the average tenant stay here, and is there a school-zone premium baked into asking?
- The area grade is low — what's the realistic commute time and amenity access for the typical tenant pool here? Any planned neighborhood developments (good or bad) we should know about?
- What's the average days-on-market for RENTAL listings here right now (not sales)? A rising rental-DOM trend means longer vacancies and softer asking-rent achievability than the comps imply.
- What's the recent tenant-quality profile in this submarket — average credit score on applications, eviction rate, late-payment / NSF rate, and stable-employment percentage? A property-management company in the area should have these aggregated.
- How much new for-sale + rental construction is in the pipeline within 1–3 miles? Heavy new supply typically softens prices + rents 12–24 months out; constrained supply supports both.
Investment metrics
- 1% rule
- 4.77% ✓
- Cap rate
- 44.32%
- Cash-on-cash
- 135.83%
- DSCR
- 7.04
- GRM
- 1.7
CMA / ARV
No comps found within radius.
Projected returns pro-forma
-3.0% appreciation · 4.42% rent growth · sell at horizon
- IRR
- —
- Equity multiple
- 7.88×
- Total profit
- $96,099
- Equity at exit
- $7,440
- IRR
- —
- Equity multiple
- 17.32×
- Total profit
- $227,993
- Equity at exit
- $4,314
Cash invested: $13,972 (down + closing). Projections, not guarantees.
Landlord ↔ Tenant lean methodology
- Overall (STATE)
- 46 Balanced
- State Minnesota
- 46 Balanced · D+2
- County
- — inherits STATE
- City
- — inherits STATE
ZIP-level market 55449
- Home prices YoY
- -23.8%
- Rents YoY
- 4.4%
- Active inventory
- 245
- Price-to-rent
- 1.7×
Monthly cashflow live
- Estimated rent
- $2,382 medium interval (Pro) →
- Mortgage (P&I)
- −$262
- Tax from tax record
- −$18 /mo · $210/yr
- Insurance
- −$21
- HOA
- −$0
- Vacancy / Maint / Mgmt
- −$500
- Net cashflow
- $1,581
Break-even live
UW: 25.0% down · 7.5% · 30yr · 1.5% tax · 5.0% vac · 8.0% maint · 8.0% mgmt
Financing live
Cash to close
- Down payment
- $12,475
- Closing costs
- $1,497
- Reserves months
- —
- Total cash needed
- —
Loan-product check · same deal, 3 products live
Conventional
25% down · 7.5% · 30yr
- Down + closing
- —
- Monthly P&I
- —
- Monthly cashflow
- —
- DSCR
- —
- Eligible?
- —
Personal DTI + credit; lowest rate.
DSCR
20% down · 8.5% · 30yr
- Down + closing
- —
- Monthly P&I
- —
- Monthly cashflow
- —
- DSCR
- —
- Eligible?
- —
No personal income docs; deal must DSCR.
Hard money
10% down · 12.0% · 12mo
- Down + closing
- —
- Monthly P&I
- —
- Monthly cashflow
- —
- DSCR
- —
- Eligible?
- —
Short-term bridge; refi at stabilization.
Rent comps 2 comps
| Address | Beds | Baths | Sqft | Rent | $/sqft | DOM | Units | Dist |
|---|---|---|---|---|---|---|---|---|
| 9001 Griggs Ave Circle Pines, MN | 2.0 | 1.0–2.0 | 761 | $2,520 | $3.31 | 1d | 22 | 0.86mi |
| 5891 Rice Creek Pkwy Shoreview, MN | 1.0–2.0 | 1.0–2.0 | 926 | $2,251 | $2.43 | 1d | 18 | 1.14mi |
Listing history 10 events
-
2026-06-18days on market $49,900 Active 15 DOM
-
2026-06-17days on market $49,900 Active 14 DOM
-
2026-06-16days on market $49,900 Active 13 DOM
-
2026-06-15days on market $49,900 Active 12 DOM
-
2026-06-13days on market $49,900 Active 10 DOM
-
2026-06-09pricedays on market $49,900 Active 6 DOM
-
2026-06-08days on market $54,900 Active 5 DOM
-
2026-06-07days on market $54,900 Active 4 DOM
-
2026-06-04remarks 381-char remark
-
2026-06-04$54,900 Active 1 DOM
ⓘ Source: listings_history table (triggers on properties + properties_extension) + one-shot
backfill from property_details.listing_events for pre-trigger history.
Tax reassessment forecast MN · Partial reset (capped growth)
- Current annual tax
- $210 · $18/mo
- Projected year-2 tax
- $385 · $32/mo
- Expected delta
- +$174/yr (+$15/mo · 82.9%)
ⓘ Screening estimate from a state-policy table — verify with the county assessor before closing.
Climate risk First Street
- Flood 1/10 Low FEMA zone X (unshaded) · 0% chance over 30 yrs
- Wildfire 1/10 Low
- Heat 2/10 Low 7 d/yr ≥100°F today · 14 d/yr by 30 yrs out
- Wind 2/10 Low
- Air quality 2/10 Low 1 unhealthy d/yr today · 1 by 30 yrs out
Nearby sold comps map
Loading sold comps map…
Walkable amenities ~0.75 mi
Loading nearby amenities…
Taxation est. · year 1
- Rental income
- $28,580
- − Mortgage interest
- −$2,795
- − Property taxes
- −$210
- − Insurance
- −$250
- − Repairs & maintenance
- −$2,286
- − Management
- −$2,286
- − Depreciation
- −$1,452
- Taxable income
- $19,300
- Est. tax owed @ 24.0%
- −$4,632
- After-tax cash flow
- $14,346/yr
For passive investors: Depreciation is non-cash, so a rental often shows a tax loss while cash-flowing — sheltering income. Rental losses are passive: they offset passive income freely, and up to $25,000/yr can offset ordinary (W-2) income if you actively participate and your MAGI is under $100k (phasing out to $0 by $150k); unused losses carry forward. On sale, claimed depreciation is recaptured at up to 25%, and gains may owe capital-gains tax (a 1031 exchange can defer both). Figures are a year-1 estimate at your 24.0% rate — not tax advice; consult a CPA.
Condition & rehab AI · 12 photos
This manufactured home is in excellent condition with recent updates, making it a great investment for both resale and rental.
Value-add opportunities
- Both Painting exterior — Enhances curb appeal and value
- Both Landscaping — Improves curb appeal and rental value
- Both New outdoor lighting — Enhances safety and curb appeal
Renovation cost estimate screening
Value-add ROI direction
- Both Painting exterior — Enhances curb appeal and value ↑
- Both Landscaping — Improves curb appeal and rental value ↑
- Both New outdoor lighting — Enhances safety and curb appeal ↑
ⓘ Cost ranges are severity-bucket heuristics (US national rule-of-thumb). Get contractor quotes + a written scope before underwriting a rehab budget.
Schools (NCES district)
- District
- Spring Lake Park Public Schools
- NCES district ID
- 2733330
- Math proficiency
- 41% ▼ -6.00%
- Reading proficiency
- 49% ▼ -8.00%
- Median HH income
- $65,602
- Composite
- 40.11/100
- National rank
- #3802
- State rank
- #162 of 301 in MN
Livability — Blaine
- Score
- 71/100
- State rank
- #315
- US rank
- #7073
Category grades
Schools grade is shown separately in the Schools card above.
Census & demographics
- Census place
- Blaine, MN
- County
- Anoka County · 277,116 people
- City population
- 67,472
- Metro
- Minneapolis-St. Paul-Bloomington, MN-WI
- Population (ZIP)
- 34,443
- Household income
- $131,832
- Rent vs Own
- Severe rent burden
- 275.0
Population outlook (Anoka County) Hauer SSP2
- Today (2025)
- 375,223 people
- By 2030
- 387,850 · +3.4%
- By 2040
- 407,239 · +8.5%
- By 2050
- 417,541 · +11.3%
- By 2075
- 448,447 · +19.5%
- By 2100
- 464,954 · +23.9%
Race, ethnicity, and origin ACS 2023
- Neighborhood character
- Predominantly White (73%)
- Race & ethnicity
- White 73% Asian 10% Black 9% Two or more races 6% Hispanic / Latino 4%
- Common ancestry
- Portuguese 10% Romanian 5% Lithuanian 3%
- Foreign-born
- 14% · Canada, Vietnam, China
- Languages at home
- 79% English-only · Arabic 4% Other Asian/Pacific 4% Spanish 3%
Political lean MEDSL · Anoka
- 2024 margin
- Toss-up / Even · D 46.6% · R 51.0% · Other 2.4%
- 2008→2024 swing
- -2.0pp toward R · 2008: -2.4pp · 2024: -4.4pp
- All cycles
- 2024: R+4.4 2020: R+1.9 2016: R+9.7 2012: R+2.6 2008: R+2.4
Not yet ingested
- Civics
- —
Market trends
- HPI YoY
- ▼ -70.24%
- Current HPI
- 225.2348
- Rent YoY
- ▲ 4.42%
- Metro
- Minneapolis-St. Paul-Bloomington, MN-WI
- State GDP YoY
- ▲ 2.41%
- F500 in state
- 34
Industry mix (Fortune 500 HQ in MN)
| Industry | F500 HQs | Revenue |
|---|---|---|
| Healthcare | 2 | $407B |
|
||
| Retail | 2 | $150B |
|
||
| Consumer Goods | 2 | $32B |
|
||
| Industrial Machinery | 2 | $6B |
|
||
| Agriculture | 1 | $40B |
|
||
| Healthcare / Medical Devices | 1 | $32B |
|
||
Price history
1 event — show timeline
- 2026-06-03 Listed $54,900 NORTHSTARMLS as Distributed by MLS Grid
Property tax history
+42.1%/yrLatest (2026): $210 · +35.3% YoY. Source: county tax records.
Cash-flow waterfall
monthlySold comps — $/sqft
last 12 mo · ≤1 miLoading sold comps…