11452 Canton Dr · Los Angeles, CA
Flood risk 8/10 · Major
- FEMA flood zone
- X (unshaded)
- Chance of flooding over 30 yrs
- 0.78%
- Est. flood insurance / yr
- $507 – $1,088
Fire risk 3/10 · Minor
- Est. fire insurance / yr
- $659 – $1,223
Heat risk 5/10 · Moderate
- Hot days now (above 92°F)
- 7 days/yr
- Hot days in 30 yrs
- 21 days/yr
Wind risk 1/10 · Minimal
- Chance of severe wind over 30 yrs
- —
Air-quality risk 5/10 · Moderate
- Unhealthy air days now
- 7 days/yr
- Unhealthy air days in 30 yrs
- 7 days/yr
Risk factors via First Street. Map © Google.
Why this score? — see what drove the F grade
The composite is a weighted blend of 9 inputs, each scored 0–100. Each bar is that input's sub-score; the figure is the points it added to the 100-point composite (weight × sub-score).
- ARV discount +7.5/15.0
- Cash flow +5.1/30.0
- Schools +3.6/10.0
- Livability +3.4/5.0
- Condition / age +2.5/5.0
- Rent growth +2.2/5.0
- 1% rule +0.1/10.0
- DSCR +0.0/10.0
- Appreciation +0.0/10.0
$1,179,900
🖨 Deal sheet 📄 Offer letter ✓ Due diligence
Listing remarks MLS
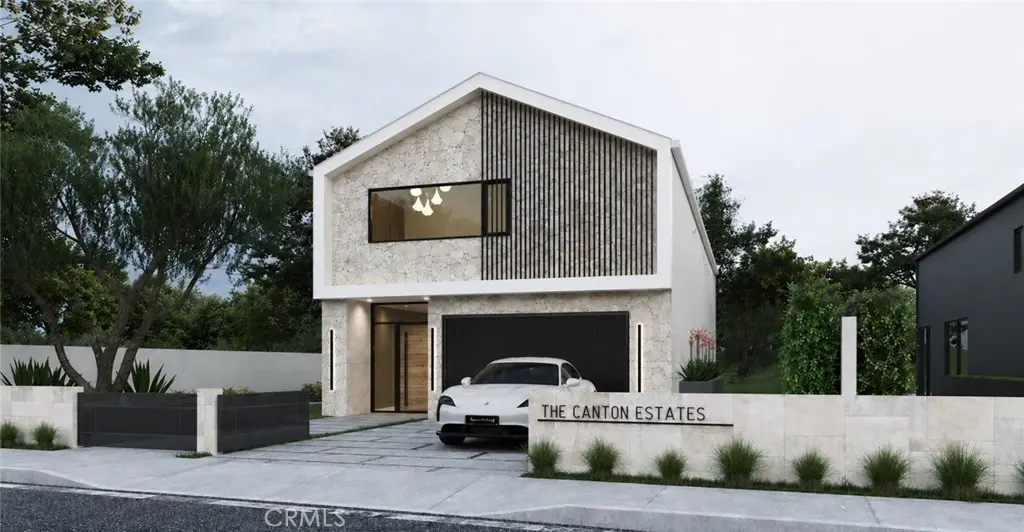
Set on a quiet, tree-lined street just across the street from Fryman Canyon, this stunning 6,636 sq ft modern farmhouse sits in one of LA's most coveted celebrity enclaves — within the top-rated Carpenter School District and surrounded by the natural beauty of the Santa Monica Mountains. The open-concept floor plan flows effortlessly across multiple levels, anchored by a spacious lower-level basement and spaces designed for effortless entertaining. This shovel-ready 10,935 sq ft lot comes with fully approved architectural plans, PAID building permits, all city clearances secured. No years of notorious permitting delays, no haul route, no caissons. Gentle 5% slope. Opportunities like this — where the hard work is done and the canvas is still blank — are extraordinarily rare in Studio City Hills. Seller financing available.
Key facts
- Fryman canyon
- Lower-level basement
- Shovel-ready lot
Tags
Neighborhood map
What this means for you Summary
Snapshot
- This is a 5-bed/6.0-bath land listed at $1.18M.
Deal economics
- At list price, monthly cash flow is $-3k ($-33k/yr) — negative.
- To cash-flow at today's rent, offer at most $688k (41.7% below list).
- To meet the 1% rule (rent ≥ 1% of price), the offer needs to be $605k (48.7% below list).
- Recommended offer: $605k (48.7% below list) — sets the bar for 1% rule.
- Cap rate 3.5% vs local median 2.1% in Los Angeles — top-decile yield for the area; either an underpriced asset or a hidden risk that comps aren't pricing in. Stress-test before assuming the spread holds.
Location & tenants
- Location reads 68/100 on livability (#273 in CA) — a middle-class / working-renter tenant base. Strengths: amenities A+, commute A+, employment B; Watch: health & safety C-, schools D+, crime F.
- Los Angeles Unified (urban): math 29% / reading 54% proficiency, ranked #223 of 517 in CA (top 43%) — families likely to look elsewhere, expect single-tenant / working-renter base with shorter leases; 67% free/reduced lunch — lower-income household profile, screen leases tightly.
- Market conditions: Rents soft (-1.1%/yr); 171 active listings in the ZIP; 14 comparable units currently listed for rent nearby; rentals lingering (median 44d on market — plan ~5-8 weeks vacancy on turnover, expect pricing pressure); 50% of comp listings sitting > 30 days — soft ceiling on asking rent; high-income renter base; 19,697 units permitted in Los Angeles County in 2024 (9,426 in 5+ unit buildings).
- At $6,054/mo this rent would consume 51% of the median local household income ($142k/yr) (locally 1988% of renters already pay >50% of income on rent) — very limited rent-growth headroom before tenants either downsize or default.
Forward outlook
- Local home prices are declining (-3.0%/yr); year-one equity from $8k of loan paydown is wiped out by about $35k of value loss. Plan a longer hold.
- Los Angeles County population projected at +9% by 2050 — modest demand growth; plan on rents tracking national, not racing it.
Negotiation context
- It's been on market 63 days — a 6% lower offer ($1.11M) is reasonable based on typical stale-listing flexibility.
- 14 sale attempts since 7y ago; this cycle's ask has dropped $169k (13%) from the opening price — seller is motivated, your offer sets the floor, not the list.
Risks & watch-outs
- Watch-outs: flood insurance adds $66/mo.
- Climate carrying-cost: severe flood risk; extreme-heat days projected 7→21/yr by 2055 (HVAC capex compounding) — expect insurance premiums to compound above CPI over the hold.
Questions for the listing agent
- What do current leases actually rent for vs. the listed asking? Can we see a recent rent roll and the last 12 months of T-12 income?
- It's been on market 63 days. Have you received any prior offers? Is the seller open to a 49% concession, seller financing, or rate buy-down credit?
- What's the actual annual flood-insurance premium (NFIP or private), and is the property in a SFHA with mandatory coverage?
- Why hasn't it sold? Are there any deal-killer items the seller is aware of (foundation, flood, title, zoning, code violations)?
- Is there a deadline driving the sale (1031 exchange, divorce, estate, relocation)? That informs how much negotiation room exists.
- Schools are D-rated, which usually means shorter tenancies and higher turnover. Who's the typical renter profile here, and what's been the actual vacancy rate?
- Crime grade is F in this area — have there been break-ins, vandalism, or insurance claims at this property in the last 3 years? What carrier currently insures it and at what premium?
- The area grade is low — what's the realistic commute time and amenity access for the typical tenant pool here? Any planned neighborhood developments (good or bad) we should know about?
- What's the average days-on-market for RENTAL listings here right now (not sales)? A rising rental-DOM trend means longer vacancies and softer asking-rent achievability than the comps imply.
- What's the recent tenant-quality profile in this submarket — average credit score on applications, eviction rate, late-payment / NSF rate, and stable-employment percentage? A property-management company in the area should have these aggregated.
- How much new for-sale + rental construction is in the pipeline within 1–3 miles? Heavy new supply typically softens prices + rents 12–24 months out; constrained supply supports both.
Investment metrics
- 1% rule
- 0.51% ✗
- Cap rate
- 3.53%
- Cash-on-cash
- -9.86%
- DSCR
- 0.56
- GRM
- 16.2
CMA / ARV
- ARV (median comp)
- $4,563,322
- List price
- $1,179,900
- Delta
- -74.14%
- Verdict
- UNDERPRICED
- Comps
- 20 within 1.0 mi
Projected returns pro-forma
-3.0% appreciation · 0.0% rent growth · sell at horizon
- IRR
- -37.5%
- Equity multiple
- -0.17×
- Total profit
- $-386,417
- Equity at exit
- $175,927
- IRR
- -75.0%
- Equity multiple
- -0.92×
- Total profit
- $-634,336
- Equity at exit
- $102,016
Cash invested: $330,372 (down + closing). Projections, not guarantees.
Landlord ↔ Tenant lean methodology
- Overall (CITY)
- 0 Strongly Tenant-Friendly
- State California
- 18 Strongly Tenant-Friendly · D+13
- County
- — inherits STATE
- City Los Angeles
- 0 Strongly Tenant-Friendly · D+22
ZIP-level market 91604
- Rents YoY
- -1.1%
- Active inventory
- 171
- Price-to-rent
- 16.2×
Monthly cashflow live
- Estimated rent
- $6,054 medium interval (Pro) →
- Mortgage (P&I)
- −$6,188
- Tax from tax record
- −$819 /mo · $9,832/yr
- Insurance
- −$492
- Flood insurance flood zone
- −$66 /mo · $798/yr
- HOA
- −$0
- Vacancy / Maint / Mgmt
- −$1,271
- Net cashflow
- $-2,782
Break-even live
UW: 25.0% down · 7.5% · 30yr · 1.5% tax · 5.0% vac · 8.0% maint · 8.0% mgmt
Financing live
Cash to close
- Down payment
- $294,975
- Closing costs
- $35,397
- Reserves months
- —
- Total cash needed
- —
Loan-product check · same deal, 3 products live
Conventional
25% down · 7.5% · 30yr
- Down + closing
- —
- Monthly P&I
- —
- Monthly cashflow
- —
- DSCR
- —
- Eligible?
- —
Personal DTI + credit; lowest rate.
DSCR
20% down · 8.5% · 30yr
- Down + closing
- —
- Monthly P&I
- —
- Monthly cashflow
- —
- DSCR
- —
- Eligible?
- —
No personal income docs; deal must DSCR.
Hard money
10% down · 12.0% · 12mo
- Down + closing
- —
- Monthly P&I
- —
- Monthly cashflow
- —
- DSCR
- —
- Eligible?
- —
Short-term bridge; refi at stabilization.
Rent comps 14 comps
| Address | Beds | Baths | Sqft | Rent | $/sqft | DOM | Units | Dist |
|---|---|---|---|---|---|---|---|---|
| 3254 Oakdell Rd Studio City, CA | 5.0 | 6.0 | 6028 | $16,999 | $2.82 | 43d | 1 | 0.42mi |
| 7966 Mulholland Dr Los Angeles, CA | 4.0 | 5.5 | 5554 | $27,000 | $4.86 | 15d | 1 | 0.81mi |
| 4226 Lemp Ave Studio City, CA | 5.0 | 6.0 | 5254 | $24,999 | $4.76 | 43d | 1 | 0.92mi |
| 11955 Pinnacle Pl Beverly Hills, CA | 4.0 | 6.0 | 5017 | $25,000 | $4.98 | 24d | 1 | 0.98mi |
| 12001 Crest Ct Beverly Hills, CA | 5.0 | 6.0 | 5292 | $40,000 | $7.56 | 44d | 1 | 1.12mi |
| 12140 Summit Ct Beverly Hills, CA | 6.0 | 5.5 | 9600 | $60,000 | $6.25 | 43d | 1 | 1.14mi |
| 2500 Briarcrest Rd Beverly Hills, CA | 4.0 | 6.0 | 5860 | $43,000 | $7.34 | 43d | 1 | 1.22mi |
| 4435 Camellia Ave North Hollywood, CA | 5.0 | 6.0 | 5130 | $19,000 | $3.70 | 1d | 1 | 1.27mi |
| 9530 Hidden Valley Rd Beverly Hills, CA | 5.0 | 5.5 | 5096 | $20,000 | $3.92 | 18d | 1 | 1.32mi |
| 7940 Vulcan Dr Los Angeles, CA | 4.0 | 6.0 | 5273 | $19,900 | $3.77 | 7d | 1 | 1.36mi |
| 3624 Avenida del Sol Studio City, CA | 4.0 | 4.0 | 4694 | $9,980 | $2.13 | 43d | 1 | 1.40mi |
| 2463 Achilles Dr Los Angeles, CA | 4.0 | 5.0 | 4727 | $28,500 | $6.03 | 43d | 1 | 1.42mi |
| 4156 Sunswept Dr Studio City, CA | 6.0 | 7.0 | 5706 | $15,000 | $2.63 | 14d | 1 | 1.43mi |
| 9023 Alto Cedro Dr Beverly Hills, CA | 6.0 | 6.0 | 5000 | $25,000 | $5.00 | 1d | 1 | 1.45mi |
Listing history 37 events
-
2026-06-18days on market $1,179,900 Active 63 DOM
-
2026-06-17days on market $1,179,900 Active 62 DOM
-
2026-06-16days on market $1,179,900 Active 61 DOM
-
2026-06-15days on market $1,179,900 Active 60 DOM
-
2026-06-13days on market $1,179,900 Active 58 DOM
-
2026-06-09days on market $1,179,900 Active 54 DOM
-
2026-06-08days on market $1,179,900 Active 53 DOM
-
2026-06-07pricedays on market $1,179,900 Active 52 DOM
-
2026-06-04days on market $1,349,000 Active 49 DOM
-
2026-06-03days on market $1,349,000 Active 48 DOM
-
2026-06-02days on market $1,349,000 Active 47 DOM
-
2026-06-01days on market $1,349,000 Active 46 DOM
-
2026-05-31days on market $1,349,000 Active 45 DOM
-
2026-04-16$1,349,000 Active 851-char remark
Show marketing remark (851 chars)
Set on a quiet, tree-lined street just across the street from Fryman Canyon, this stunning 6,636 sq ft modern farmhouse sits in one of LA's most coveted celebrity enclaves — within the top-rated Carpenter School District and surrounded by the natural beauty of the Santa Monica Mountains. The open-concept floor plan flows effortlessly across multiple levels, anchored by a spacious lower-level basement and spaces designed for effortless entertaining. This shovel-ready 10,935 sq ft lot comes with fully approved architectural plans, PAID building permits, all city clearances secured. No years of notorious permitting delays, no haul route, no caissons. Gentle 5% slope. Opportunities like this — where the hard work is done and the canvas is still blank — are extraordinarily rare in Studio City Hills. Seller financing available.
-
2026-04-08historical
-
2026-04-08historical
-
2026-01-22status Active
-
2026-01-20status Active
-
2025-11-12$3,100,000 Active
-
2025-11-12$3,100,000 Active
-
2025-08-29historical
-
2025-08-29historical
-
2025-06-05$1,588,000 Active
-
2025-05-28$1,588,000 Active
-
2020-04-17historical Withdrawn
-
2020-03-06historical Withdrawn
-
2020-03-06historical
-
2019-07-11historical Canceled
-
2019-07-11Active
-
2019-07-11historical Canceled
-
2019-07-11Active
-
2019-07-11$1,385,000
-
2019-07-11historical
-
2019-05-02Active
-
2019-04-17Active
-
2019-04-17$1,385,000
ⓘ Source: listings_history table (triggers on properties + properties_extension) + one-shot
backfill from property_details.listing_events for pre-trigger history.
Tax reassessment forecast CA · Resets to sale price
- Current annual tax
- $9,832 · $819/mo
- Projected year-2 tax
- $9,832 · $819/mo
- Expected delta
- $0/yr ($0/mo · 0.0%)
ⓘ Screening estimate from a state-policy table — verify with the county assessor before closing.
Climate risk First Street
- Flood 8/10 Severe FEMA zone X (unshaded) · 78% chance over 30 yrs
- Wildfire 3/10 Moderate
- Heat 5/10 Major 7 d/yr ≥92°F today · 21 d/yr by 30 yrs out
- Wind 1/10 Low
- Air quality 5/10 Major 7 unhealthy d/yr today · 7 by 30 yrs out
Nearby sold comps map
Loading sold comps map…
Walkable amenities ~0.75 mi
Loading nearby amenities…
Taxation est. · year 1
- Rental income
- $72,646
- − Mortgage interest
- −$66,093
- − Property taxes
- −$9,832
- − Insurance
- −$6,697
- − Repairs & maintenance
- −$5,812
- − Management
- −$5,812
- − Depreciation
- −$34,324
- Taxable loss
- −$55,923
- Est. tax savings @ 24.0%
- +$13,422
- After-tax cash flow
- $-19,967/yr
For passive investors: Depreciation is non-cash, so a rental often shows a tax loss while cash-flowing — sheltering income. Rental losses are passive: they offset passive income freely, and up to $25,000/yr can offset ordinary (W-2) income if you actively participate and your MAGI is under $100k (phasing out to $0 by $150k); unused losses carry forward. On sale, claimed depreciation is recaptured at up to 25%, and gains may owe capital-gains tax (a 1031 exchange can defer both). Figures are a year-1 estimate at your 24.0% rate — not tax advice; consult a CPA.
Schools (NCES district)
- District
- Los Angeles Unified
- NCES district ID
- 0622710
- Math proficiency
- 29% ▼ -4.00%
- Reading proficiency
- 54% ▲ 10.00%
- Median HH income
- $50,403
- Composite
- 35.67/100
- National rank
- #4875
- State rank
- #223 of 517 in CA
Livability — Los Angeles
- Score
- 68/100
- State rank
- #273
- US rank
- #9237
Category grades
Schools grade is shown separately in the Schools card above.
Census & demographics
- Census place
- Los Angeles, CA
- County
- Los Angeles County · 9,444,647 people
- City population
- 3,838,149
- Metro
- Los Angeles-Long Beach-Anaheim, CA
- Population (ZIP)
- 32,469
- Household income
- $141,875
- Rent vs Own
- Severe rent burden
- 1988.0
Population outlook (Los Angeles County) Hauer SSP2
- Today (2025)
- 10,940,515 people
- By 2030
- 11,256,481 · +2.9%
- By 2040
- 11,729,929 · +7.2%
- By 2050
- 11,948,407 · +9.2%
- By 2075
- 11,818,114 · +8.0%
- By 2100
- 10,842,928 · -0.9%
Race, ethnicity, and origin ACS 2023
- Neighborhood character
- Predominantly White (68%)
- Race & ethnicity
- White 68% Two or more races 12% Hispanic / Latino 11% Asian 8% Black 5%
- Hispanic origin (detail)
- Mexican 6%
- Common ancestry
- Scotch-Irish 6% Romanian 5% Italian 4%
- Foreign-born
- 18% · Canada, South Korea, China
- Languages at home
- 79% English-only · Other Indo-European 5% Spanish 5% Russian/Polish/Slavic 4%
Political lean MEDSL · Los Angeles
- 2024 margin
- Solid D (+32.9) · D 64.8% · R 31.9% · Other 3.3%
- 2008→2024 swing
- -7.4pp toward R · 2008: 40.4pp · 2024: 32.9pp
- All cycles
- 2024: D+32.9 2020: D+44.2 2016: D+48.0 2012: D+40.0 2008: D+40.4
Not yet ingested
- Civics
- —
Market trends
- HPI YoY
- ▼ -826.89%
- Current HPI
- 425.8112
- Rent YoY
- ▼ -1.09%
- Metro
- Los Angeles-Long Beach-Anaheim, CA
- State GDP YoY
- ▲ 3.21%
- F500 in state
- 116
Industry mix (Fortune 500 HQ in CA)
| Industry | F500 HQs | Revenue |
|---|---|---|
| Technology | 27 | $1,492B |
|
||
| Financial Services | 3 | $174B |
|
||
| Retail | 3 | $44B |
|
||
| Insurance | 3 | $26B |
|
||
| Media / Entertainment | 2 | $115B |
|
||
| Pharmaceuticals / Biotech | 2 | $62B |
|
||
Price history
-2.6% since first listed24 events — show timeline
- 2026-04-16 Listed $1,349,000 CRMLS
- 2026-04-16 Listed $1,349,000 CRMLS
- 2026-04-08 Listing Removed — CRMLS
- 2026-04-08 Listing Removed — CRMLS
- 2026-01-22 Relisted — CRMLS
- 2026-01-20 Relisted — CRMLS
- 2025-11-12 Listed $3,100,000 CRMLS
- 2025-11-12 Listed $3,100,000 CRMLS
- 2025-08-29 Listing Removed — CRMLS
- 2025-08-29 Listing Removed — CRMLS
- 2025-06-05 Listed $1,588,000 CRMLS
- 2025-05-28 Listed $1,588,000 CRMLS
- 2020-04-17 Delisted — TheMLS
- 2020-03-06 Listing Removed — SDMLS
- 2020-03-06 Delisted — TheMLS
- 2019-07-11 Listing Removed — SDMLS
- 2019-07-11 Listed $1,385,000 SDMLS
- 2019-07-11 Listed — TheMLS
- 2019-07-11 Delisted — TheMLS
- 2019-07-11 Listed — TheMLS
- 2019-07-11 Delisted — TheMLS
- 2019-05-02 Listed — TheMLS
- 2019-04-17 Listed $1,385,000 SDMLS
- 2019-04-17 Listed — TheMLS
Property tax history
+2.0%/yrLatest (2025): $9,832 · +0.6% YoY. Source: county tax records.
Cash-flow waterfall
monthlySold comps — $/sqft
last 12 mo · ≤1 miLoading sold comps…