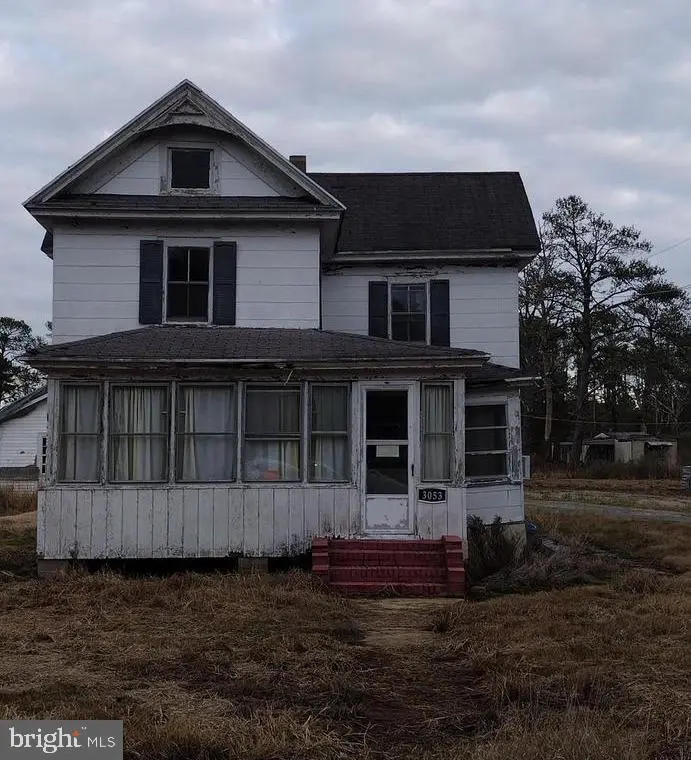
3053 Lawsonia Rd · Crisfield, MD
Flood risk 10/10 · Severe
- FEMA flood zone
- AE
- Chance of flooding over 30 yrs
- 0.99%
- Est. flood insurance / yr
- $1,737 – $8,500
Fire risk 5/10 · Moderate
- Est. fire insurance / yr
- $755 – $1,403
Heat risk 9/10 · Severe
- Hot days now (above 101°F)
- 7 days/yr
- Hot days in 30 yrs
- 19 days/yr
Wind risk 8/10 · Major
- Chance of severe wind over 30 yrs
- 80.0%
Air-quality risk 2/10 · Minimal
- Unhealthy air days now
- 1 days/yr
- Unhealthy air days in 30 yrs
- 2 days/yr
Risk factors via First Street. Map © Google.
Why this score? — see what drove the A- grade
The composite is a weighted blend of 9 inputs, each scored 0–100. Each bar is that input's sub-score; the figure is the points it added to the 100-point composite (weight × sub-score).
- Cash flow +30.0/30.0
- ARV discount +15.0/15.0
- 1% rule +10.0/10.0
- DSCR +10.0/10.0
- Appreciation +10.0/10.0
- Livability +3.4/5.0
- Rent growth +2.5/5.0
- Condition / age +2.5/5.0
- Schools +1.5/10.0
$40,000
🖨 Deal sheet 📄 Offer letter ✓ Due diligence
Listing remarks MLS
A great opportunity to rehab or take it down and build. Public sewer. Priced for the land. Bring your best offer Seller is motivated!
Key facts
- 8,832 sq ft lot
- Built 1900
- Listed 20 days
Property features AI
Finance
- Other: Pets allowed with no pet restrictions
- HOA & community: Ground rent paid annually
Exterior
- Parking: Parking lot
- Utilities: Electric heating fuel; Electric hot water; Public sewer; Public water and well
- Home design: Detached property; Fee simple ownership; Major rehab needed
- Construction: Built with mixed stick-built construction; Asbestos present in construction materials; Asbestos shingle roof (unknown in some records); Block and brick/mortar foundation
- Exterior features: Level lot; Rural setting; Corner lot; Above- and below-grade structures noted; Located in FEMA flood zone AE
Interior
- Kitchen: Refrigerator; Stove
- Bedrooms: 2 bedrooms on the main level
- Flooring: Hardwood flooring; Laminate flooring
- Bathrooms: 1 full bathroom on the main level; 1 full bathroom total
- Interior features: Attic; Family room off the kitchen; Master bath(s); Kitchen with table space
Neighborhood map
What this means for you Summary
Snapshot
- This is a 2-bed/1.0-bath single-family listed at $40k.
Deal economics
- At list price, monthly cash flow is $107 ($1k/yr) — positive.
- The deal already cash-flows at list — no discount required.
- Meets the 1% rule at list price ($1k rent vs $40k).
- Recommended offer: $39k (1.5% below list) — sets the bar for market timing.
- Cap rate 22.3% vs local median 1.5% in Crisfield — top-decile yield for the area; either an underpriced asset or a hidden risk that comps aren't pricing in. Stress-test before assuming the spread holds.
Location & tenants
- Location reads 68/100 on livability (#199 in MD) — a middle-class / working-renter tenant base. Strengths: crime A+, cost of living A+, health & safety A+; Watch: schools F, amenities F, commute F.
- Somerset County Public Schools (town): math 12% / reading 23% proficiency, ranked #22 of 24 in MD (top 92%) — low school quality limits family demand, transient renter base, plan for 1-2y turnover; 64% free/reduced lunch — lower-income household profile, screen leases tightly.
- Market conditions: 92 active listings in the ZIP; 49 units permitted in Somerset County in 2024 (0 in 5+ unit buildings).
Forward outlook
- In year one you build about $4k of equity ($277 loan paydown + $4k appreciation (10.0% local appreciation)).
- Somerset County population projected at -16% by 2050 — secular population decline; favor cash flow + early exit over multi-decade hold.
- At projected returns (10.0% appreciation + 3.0% rent growth), your $11k cash investment doubles in ~2 years — after that, you're playing with house money.
- By year 7, paydown + projected appreciation supports a ~$31k cash-out refi (75% LTV) — recoverable capital for the next deal without selling this one.
Negotiation context
- It's been on market 20 days — a 2% lower offer ($39k) is reasonable based on typical stale-listing flexibility.
- 5 sale attempts since 22y ago with the ask held roughly flat each time — persistent listings suggest the price (not the market) is what's stuck; bring a comps-based counter.
- Current owner paid $12k; list at $40k implies a 220% gain — meaningful room to come down on a strong offer.
Risks & watch-outs
- Watch-outs: flood insurance adds $427/mo; built in 1900 — expect roof / HVAC / electrical / plumbing capex.
- Climate carrying-cost: in FEMA flood zone AE (mandatory federal flood insurance); severe wind risk, 80% chance of damaging wind over 30y; moderate wildfire risk; extreme-heat days projected 7→19/yr by 2055 (HVAC capex compounding) — expect insurance premiums to compound above CPI over the hold.
Questions for the listing agent
- Built in 1900 — when were the roof, HVAC, electrical panel, plumbing, and water heater last replaced?
- What's the actual annual flood-insurance premium (NFIP or private), and is the property in a SFHA with mandatory coverage?
- Is there a deadline driving the sale (1031 exchange, divorce, estate, relocation)? That informs how much negotiation room exists.
- Schools are F-rated, which usually means shorter tenancies and higher turnover. Who's the typical renter profile here, and what's been the actual vacancy rate?
- What's the average days-on-market for RENTAL listings here right now (not sales)? A rising rental-DOM trend means longer vacancies and softer asking-rent achievability than the comps imply.
- What's the recent tenant-quality profile in this submarket — average credit score on applications, eviction rate, late-payment / NSF rate, and stable-employment percentage? A property-management company in the area should have these aggregated.
- How much new for-sale + rental construction is in the pipeline within 1–3 miles? Heavy new supply typically softens prices + rents 12–24 months out; constrained supply supports both.
Investment metrics
- 1% rule
- 2.56% ✓
- Cap rate
- 22.29%
- Cash-on-cash
- 57.15%
- DSCR
- 3.54
- GRM
- 3.3
CMA / ARV
- ARV (on-the-fly)
- $79,800
- Comps found
- 5
Show comp detail 5 sales within ~0.75 mi
| Address | Dist | Beds/Ba | Sqft | Sold | Price | $/sf | Match |
|---|---|---|---|---|---|---|---|
| 3053 Lawsonia Rd | 0.00mi | 2/1.0 | 1,064 (0%) | 13mo | $12,500 | $12 | 89 |
| 2990 Byrdtown Rd | 0.14mi | 3/1.0 (+1) | 1,000 (-6%) | 6mo | $119,000 | $119 | 73 |
| 2902 Byrdtown Rd | 0.32mi | 3/1.0 (+1) | 1,072 (+1%) | 14mo | $80,000 | $75 | 67 |
| 2800 Calvary Rd | 0.70mi | 3/1.0 (+1) | 1,048 (-2%) | 1mo | $10,000 | $10 | 60 |
| 3343 Lawsonia Rd | 0.59mi | 2/2.0 | 1,205 (+13%) | 16mo | $137,000 | $114 | 33 |
Match score weights: distance 35% · size 25% · config 20% · recency 20%. Top-matched comps best support the ARV.
Projected returns pro-forma
10.0% appreciation · 3.0% rent growth · sell at horizon
- IRR
- 32.9%
- Equity multiple
- 3.58×
- Total profit
- $28,868
- Equity at exit
- $36,035
- IRR
- 28.6%
- Equity multiple
- 8.16×
- Total profit
- $80,211
- Equity at exit
- $77,711
Cash invested: $11,200 (down + closing). Projections, not guarantees.
Landlord ↔ Tenant lean methodology
- Overall (STATE)
- 27 Tenant-Leaning
- State Maryland
- 27 Tenant-Leaning · D+14
- County
- — inherits STATE
- City
- — inherits STATE
ZIP-level market 21817
- Home prices YoY
- 7.3%
- Active inventory
- 92
- Price-to-rent
- 3.3×
Monthly cashflow live
- Estimated rent
- $1,025 medium interval (Pro) →
- Mortgage (P&I)
- −$210
- Tax from tax record
- −$50 /mo · $597/yr
- Insurance
- −$17
- Flood insurance flood zone
- −$427 /mo · $5,118/yr
- HOA
- −$0
- Vacancy / Maint / Mgmt
- −$215
- Net cashflow
- $107
Break-even live
UW: 25.0% down · 7.5% · 30yr · 1.5% tax · 5.0% vac · 8.0% maint · 8.0% mgmt
Financing live
Cash to close
- Down payment
- $10,000
- Closing costs
- $1,200
- Reserves months
- —
- Total cash needed
- —
Loan-product check · same deal, 3 products live
Conventional
25% down · 7.5% · 30yr
- Down + closing
- —
- Monthly P&I
- —
- Monthly cashflow
- —
- DSCR
- —
- Eligible?
- —
Personal DTI + credit; lowest rate.
DSCR
20% down · 8.5% · 30yr
- Down + closing
- —
- Monthly P&I
- —
- Monthly cashflow
- —
- DSCR
- —
- Eligible?
- —
No personal income docs; deal must DSCR.
Hard money
10% down · 12.0% · 12mo
- Down + closing
- —
- Monthly P&I
- —
- Monthly cashflow
- —
- DSCR
- —
- Eligible?
- —
Short-term bridge; refi at stabilization.
Listing history 15 events
-
2026-06-18days on market $40,000 Active 20 DOM
-
2026-06-17days on market $40,000 Active 19 DOM
-
2026-06-16days on market $40,000 Active 18 DOM
-
2026-06-15days on market $40,000 Active 17 DOM
-
2026-06-14days on market $40,000 Active 15 DOM
-
2026-06-13days on market $40,000 Active 14 DOM
-
2026-06-10days on market $40,000 Active 12 DOM
-
2026-06-09days on market $40,000 Active 11 DOM
-
2026-06-08days on market $40,000 Active 10 DOM
-
2026-06-07days on market $40,000 Active 9 DOM
-
2026-06-02days on market $40,000 Active 4 DOM
-
2026-06-01days on market $40,000 Active 3 DOM
-
2026-05-31days on market $40,000 Active 2 DOM
-
2026-05-30remarks 323-char remark
-
2026-05-30$40,000 Active 1 DOM
ⓘ Source: listings_history table (triggers on properties + properties_extension) + one-shot
backfill from property_details.listing_events for pre-trigger history.
Tax reassessment forecast MD · Partial reset (capped growth)
- Current annual tax
- $597 · $50/mo
- Projected year-2 tax
- $597 · $50/mo
- Expected delta
- $0/yr ($0/mo · 0.0%)
ⓘ Screening estimate from a state-policy table — verify with the county assessor before closing.
Climate risk First Street
- Flood 10/10 Extreme FEMA zone AE · 99% chance over 30 yrs
- Wildfire 5/10 Major
- Heat 9/10 Extreme 7 d/yr ≥101°F today · 19 d/yr by 30 yrs out
- Wind 8/10 Severe 80% chance of damaging wind over 30 yrs
- Air quality 2/10 Low 1 unhealthy d/yr today · 2 by 30 yrs out
Nearby sold comps map
Loading sold comps map…
Walkable amenities ~0.75 mi
Loading nearby amenities…
Taxation est. · year 1
- Rental income
- $12,297
- − Mortgage interest
- −$2,241
- − Property taxes
- −$597
- − Insurance
- −$5,318
- − Repairs & maintenance
- −$984
- − Management
- −$984
- − Depreciation
- −$1,164
- Taxable income
- $1,010
- Est. tax owed @ 24.0%
- −$242
- After-tax cash flow
- $1,040/yr
For passive investors: Depreciation is non-cash, so a rental often shows a tax loss while cash-flowing — sheltering income. Rental losses are passive: they offset passive income freely, and up to $25,000/yr can offset ordinary (W-2) income if you actively participate and your MAGI is under $100k (phasing out to $0 by $150k); unused losses carry forward. On sale, claimed depreciation is recaptured at up to 25%, and gains may owe capital-gains tax (a 1031 exchange can defer both). Figures are a year-1 estimate at your 24.0% rate — not tax advice; consult a CPA.
Schools (NCES district)
- District
- Somerset County Public Schools
- NCES district ID
- 2400570
- Math proficiency
- 12% ▼ -7.00%
- Reading proficiency
- 23% ▼ -14.00%
- Median HH income
- $38,810
- Composite
- 14.73/100
- National rank
- #9396
- State rank
- #22 of 24 in MD
Livability — Crisfield
- Score
- 68/100
- State rank
- #199
- US rank
- #9181
Category grades
Schools grade is shown separately in the Schools card above.
Census & demographics
- Population (ZIP)
- 4,102
Population outlook (Somerset County) Hauer SSP2
- Today (2025)
- 24,474 people
- By 2030
- 23,547 · -3.8%
- By 2040
- 21,498 · -12.2%
- By 2050
- 20,427 · -16.5%
- By 2075
- 16,594 · -32.2%
- By 2100
- 12,132 · -50.4%
Race, ethnicity, and origin ACS 2023
- Neighborhood character
- Predominantly White (72%)
- Race & ethnicity
- White 72% Black 20% Two or more races 4% Hispanic / Latino 3% Asian 1%
- Common ancestry
- Italian 2% Serbian 1% Romanian 1%
- Foreign-born
- 2% · Canada
- Languages at home
- 97% English-only · Spanish 2%
Political lean MEDSL · Somerset
- 2024 margin
- R (+17.4) · D 40.2% · R 57.5% · Other 2.3%
- 2008→2024 swing
- -14.8pp toward R · 2008: -2.6pp · 2024: -17.4pp
- All cycles
- 2024: R+17.4 2020: R+14.8 2016: R+17.9 2012: R+2.5 2008: R+2.6
Not yet ingested
- Civics
- —
Market trends
- HPI YoY
- ▲ 19.92%
- Current HPI
- 292.866
- Rent YoY
- —
- Metro
- —
- State GDP YoY
- ▲ 2.97%
- F500 in state
- 12
Industry mix (Fortune 500 HQ in MD)
| Industry | F500 HQs | Revenue |
|---|---|---|
| Aerospace / Defense | 1 | $71B |
|
||
| Utilities | 1 | $25B |
|
||
| Hotels | 1 | $24B |
|
||
| Consumer Goods | 1 | $7B |
|
||
| Real Estate | 1 | $6B |
|
||
| Chemicals | 1 | $2B |
|
||
Price history
-42.8% since first listed14 events — show timeline
- 2026-05-30 Listed $40,000 BRIGHT MLS
- 2025-05-19 Sold (MLS) $12,500 BRIGHT MLS
- 2025-05-14 Price Changed $12,500 BRIGHT MLS
- 2025-05-14 Contingent — BRIGHT MLS
- 2025-04-30 Price Changed $16,500 BRIGHT MLS
- 2025-04-30 Relisted — BRIGHT MLS
- 2025-04-23 Contingent — BRIGHT MLS
- 2025-04-18 Price Changed $22,950 BRIGHT MLS
- 2025-02-03 Price Changed $35,000 BRIGHT MLS
- 2024-12-22 Listed $50,000 BRIGHT MLS
- 2015-03-13 Sold (MLS) $6,000 BRIGHT MLS
- 2015-02-09 Listed $7,900 BRIGHT MLS
- 2004-11-18 Listing Removed — BRIGHT MLS
- 2004-08-13 Listed $69,900 BRIGHT MLS
Property tax history
+2.7%/yrLatest (2025): $597 · +13.1% YoY. Source: county tax records.
Cash-flow waterfall
monthlySold comps — $/sqft
last 12 mo · ≤1 miLoading sold comps…