11250 Playa St #43 · Culver City, CA
Flood risk 5/10 · Moderate
- FEMA flood zone
- X (unshaded)
- Chance of flooding over 30 yrs
- 0.24%
- Est. flood insurance / yr
- $507 – $1,088
Fire risk 2/10 · Minimal
- Est. fire insurance / yr
- $659 – $1,223
Heat risk 5/10 · Moderate
- Hot days now (above 85°F)
- 7 days/yr
- Hot days in 30 yrs
- 20 days/yr
Wind risk 1/10 · Minimal
- Chance of severe wind over 30 yrs
- —
Air-quality risk 4/10 · Minor
- Unhealthy air days now
- 6 days/yr
- Unhealthy air days in 30 yrs
- 7 days/yr
Risk factors via First Street. Map © Google.
Why this score? — see what drove the C+ grade
The composite is a weighted blend of 9 inputs, each scored 0–100. Each bar is that input's sub-score; the figure is the points it added to the 100-point composite (weight × sub-score).
- Cash flow +25.3/30.0
- DSCR +8.3/10.0
- ARV discount +7.0/15.0
- 1% rule +6.6/10.0
- Schools +5.2/10.0
- Livability +3.7/5.0
- Rent growth +3.0/5.0
- Condition / age +2.2/5.0
- Appreciation +0.0/10.0
$198,000
🖨 Deal sheet 📄 Offer letter ✓ Due diligence
Listing remarks MLS
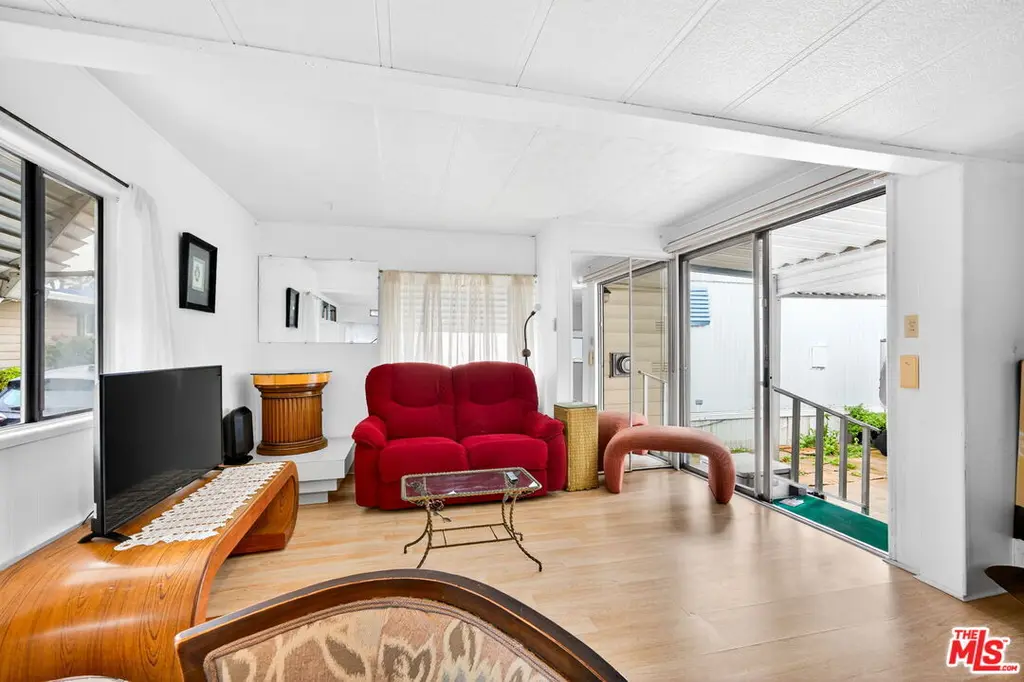
Charming single-level 1-bedroom home in a well-located Culver City community. This light-filled residence offers a functional and comfortable layout with wood-style flooring, a bright living area, and a covered porch that extends your living space outdoors. The kitchen is equipped with a gas range, refrigerator, microwave, and an in-unit stacked washer and dryer for everyday convenience. While legally configured as a 1-bedroom, the home may function best as a studio-style layout with a large walk-in closet or bonus storage area, giving buyers flexibility in how they use the space. Enjoy a front sitting area and a central location near Westfield Fox Hills, Culver City Transit Center, Trader Joe's, Whole Foods, Sprouts, local dining, parks, hiking trails, and a nearby dog park. Space rent is approximately $440 per month. This is an income-restricted property, offering an opportunity for qualified buyers to own in Culver City at a more accessible price point. For a single occupant, the maximum allowable income is $53,000 per year. Buyer to verify space rent, park rules, and qualification requirements with management.
Key facts
- Ample cabinetry
- Enclosed porch
- Tiled finishes
Tags
Neighborhood map
What this means for you Summary
Snapshot
- This is a 1-bed/1.0-bath manufactured listed at $198k. Condition is rated fair.
Deal economics
- At list price, monthly cash flow is $447 ($5k/yr) — positive.
- The deal already cash-flows at list — no discount required.
- Meets the 1% rule at list price ($2k rent vs $198k).
- Recommended offer: $174k (12.0% below list) — sets the bar for market timing.
- Cap rate 9.0% vs local median 2.0% in Culver City — top-decile yield for the area; either an underpriced asset or a hidden risk that comps aren't pricing in. Stress-test before assuming the spread holds.
Location & tenants
- Location reads 73/100 on livability (#163 in CA) — a middle-class / working-renter tenant base. Strengths: schools A+, amenities A+, commute A+; Watch: health & safety C-, crime F, cost of living F.
- Culver City Unified (suburban): math 53% / reading 62% proficiency, ranked #79 of 517 in CA (top 15%) — acceptable for families but not a draw, mixed tenant base, ~2y average lease.
- Market conditions: Rents rising (+2.0%/yr); 111 active listings in the ZIP; solid renter incomes; 19,697 units permitted in Los Angeles County in 2024 (9,426 in 5+ unit buildings).
Forward outlook
- Local home prices are declining (-3.0%/yr); year-one equity from $1k of loan paydown is wiped out by about $6k of value loss. Plan a longer hold.
- Los Angeles County population projected at +9% by 2050 — modest demand growth; plan on rents tracking national, not racing it.
Negotiation context
- It's been on market 169 days — a 12% lower offer ($174k) is reasonable based on typical stale-listing flexibility.
- 4 sale attempts since 3y ago; this cycle's ask has dropped $17k (8%) from the opening price — seller is motivated, your offer sets the floor, not the list.
Risks & watch-outs
- Watch-outs: built in 1955 — expect roof / HVAC / electrical / plumbing capex.
- Climate carrying-cost: moderate flood risk; extreme-heat days projected 7→20/yr by 2055 (HVAC capex compounding) — expect insurance premiums to compound above CPI over the hold.
Questions for the listing agent
- It's been on market 169 days. Have you received any prior offers? Is the seller open to a 12% concession, seller financing, or rate buy-down credit?
- Have any recent inspections been done? Can we get a copy of the seller's disclosures and any deferred-maintenance estimates?
- Built in 1955 — when were the roof, HVAC, electrical panel, plumbing, and water heater last replaced?
- Why hasn't it sold? Are there any deal-killer items the seller is aware of (foundation, flood, title, zoning, code violations)?
- Is there a deadline driving the sale (1031 exchange, divorce, estate, relocation)? That informs how much negotiation room exists.
- Schools are A-rated — typically a magnet for longer-tenancy family renters. What's the average tenant stay here, and is there a school-zone premium baked into asking?
- Crime grade is F in this area — have there been break-ins, vandalism, or insurance claims at this property in the last 3 years? What carrier currently insures it and at what premium?
- What's the average days-on-market for RENTAL listings here right now (not sales)? A rising rental-DOM trend means longer vacancies and softer asking-rent achievability than the comps imply.
- What's the recent tenant-quality profile in this submarket — average credit score on applications, eviction rate, late-payment / NSF rate, and stable-employment percentage? A property-management company in the area should have these aggregated.
- How much new for-sale + rental construction is in the pipeline within 1–3 miles? Heavy new supply typically softens prices + rents 12–24 months out; constrained supply supports both.
Investment metrics
- 1% rule
- 1.16% ✓
- Cap rate
- 9.00%
- Cash-on-cash
- 9.68%
- DSCR
- 1.43
- GRM
- 7.2
CMA / ARV
- ARV (median comp)
- $195,907
- List price
- $198,000
- Delta
- 1.07%
- Verdict
- FAIR
- Comps
- 7 within 1.0 mi
Show comp detail 2 sales within ~0.75 mi
| Address | Dist | Beds/Ba | Sqft | Sold | Price | $/sf | Match |
|---|---|---|---|---|---|---|---|
| 11250 Playa St #34 | 0.03mi | 1/1.0 | 540 (+9%) | 2mo | $178,000 | $330 | 82 |
| 11250 Playa St #98 | 0.07mi | 1/1.0 | 550 (+11%) | 20mo | $200,000 | $364 | 62 |
Match score weights: distance 35% · size 25% · config 20% · recency 20%. Top-matched comps best support the ARV.
Projected returns pro-forma
-3.0% appreciation · 2.03% rent growth · sell at horizon
- IRR
- -2.8%
- Equity multiple
- 0.90×
- Total profit
- $-5,794
- Equity at exit
- $29,522
- IRR
- 5.8%
- Equity multiple
- 1.41×
- Total profit
- $22,826
- Equity at exit
- $17,119
Cash invested: $55,440 (down + closing). Projections, not guarantees.
Landlord ↔ Tenant lean methodology
- Overall (STATE)
- 18 Strongly Tenant-Friendly
- State California
- 18 Strongly Tenant-Friendly · D+13
- County
- — inherits STATE
- City
- — inherits STATE
ZIP-level market 90230
- Rents YoY
- 2.0%
- Active inventory
- 111
- Price-to-rent
- 7.2×
Monthly cashflow live
- Estimated rent
- $2,298 medium interval (Pro) →
- Mortgage (P&I)
- −$1,038
- Tax est. 1.5%
- −$248 /mo · $2,970/yr
- Insurance
- −$82
- HOA
- −$0
- Vacancy / Maint / Mgmt
- −$483
- Net cashflow
- $447
Break-even live
UW: 25.0% down · 7.5% · 30yr · 1.5% tax · 5.0% vac · 8.0% maint · 8.0% mgmt
Financing live
Cash to close
- Down payment
- $49,500
- Closing costs
- $5,940
- Reserves months
- —
- Total cash needed
- —
Loan-product check · same deal, 3 products live
Conventional
25% down · 7.5% · 30yr
- Down + closing
- —
- Monthly P&I
- —
- Monthly cashflow
- —
- DSCR
- —
- Eligible?
- —
Personal DTI + credit; lowest rate.
DSCR
20% down · 8.5% · 30yr
- Down + closing
- —
- Monthly P&I
- —
- Monthly cashflow
- —
- DSCR
- —
- Eligible?
- —
No personal income docs; deal must DSCR.
Hard money
10% down · 12.0% · 12mo
- Down + closing
- —
- Monthly P&I
- —
- Monthly cashflow
- —
- DSCR
- —
- Eligible?
- —
Short-term bridge; refi at stabilization.
Listing history 20 events
-
2026-06-18days on market $198,000 Active 169 DOM
-
2026-06-17days on market $198,000 Active 168 DOM
-
2026-06-16days on market $198,000 Active 167 DOM
-
2026-06-15days on market $198,000 Active 166 DOM
-
2026-06-13days on market $198,000 Active 164 DOM
-
2026-06-13days on market $198,000 Active 163 DOM
-
2026-06-09days on market $198,000 Active 160 DOM
-
2026-06-08days on market $198,000 Active 159 DOM
-
2026-06-07days on market $198,000 Active 158 DOM
-
2026-06-04days on market $198,000 Active 155 DOM
-
2026-06-03days on market $198,000 Active 154 DOM
-
2026-06-02days on market $198,000 Active 153 DOM
-
2026-06-01days on market $198,000 Active 152 DOM
-
2026-05-31days on market $198,000 Active 151 DOM
-
2026-02-02price $198,000 1131-char remark
Show marketing remark (1131 chars)
Charming single-level 1-bedroom home in a well-located Culver City community. This light-filled residence offers a functional and comfortable layout with wood-style flooring, a bright living area, and a covered porch that extends your living space outdoors. The kitchen is equipped with a gas range, refrigerator, microwave, and an in-unit stacked washer and dryer for everyday convenience. While legally configured as a 1-bedroom, the home may function best as a studio-style layout with a large walk-in closet or bonus storage area, giving buyers flexibility in how they use the space. Enjoy a front sitting area and a central location near Westfield Fox Hills, Culver City Transit Center, Trader Joe's, Whole Foods, Sprouts, local dining, parks, hiking trails, and a nearby dog park. Space rent is approximately $440 per month. This is an income-restricted property, offering an opportunity for qualified buyers to own in Culver City at a more accessible price point. For a single occupant, the maximum allowable income is $53,000 per year. Buyer to verify space rent, park rules, and qualification requirements with management.
-
2025-12-31$214,999 Active 1131-char remark
Show marketing remark (1131 chars)
Charming single-level 1-bedroom home in a well-located Culver City community. This light-filled residence offers a functional and comfortable layout with wood-style flooring, a bright living area, and a covered porch that extends your living space outdoors. The kitchen is equipped with a gas range, refrigerator, microwave, and an in-unit stacked washer and dryer for everyday convenience. While legally configured as a 1-bedroom, the home may function best as a studio-style layout with a large walk-in closet or bonus storage area, giving buyers flexibility in how they use the space. Enjoy a front sitting area and a central location near Westfield Fox Hills, Culver City Transit Center, Trader Joe's, Whole Foods, Sprouts, local dining, parks, hiking trails, and a nearby dog park. Space rent is approximately $440 per month. This is an income-restricted property, offering an opportunity for qualified buyers to own in Culver City at a more accessible price point. For a single occupant, the maximum allowable income is $53,000 per year. Buyer to verify space rent, park rules, and qualification requirements with management.
-
2025-11-24Active
-
2025-11-18historical
-
2025-11-15Active
-
2023-11-18Active
ⓘ Source: listings_history table (triggers on properties + properties_extension) + one-shot
backfill from property_details.listing_events for pre-trigger history.
Climate risk First Street
- Flood 5/10 Major FEMA zone X (unshaded) · 24% chance over 30 yrs
- Wildfire 2/10 Low
- Heat 5/10 Major 7 d/yr ≥85°F today · 20 d/yr by 30 yrs out
- Wind 1/10 Low
- Air quality 4/10 Moderate 6 unhealthy d/yr today · 7 by 30 yrs out
Nearby sold comps map
Loading sold comps map…
Walkable amenities ~0.75 mi
Loading nearby amenities…
Taxation est. · year 1
- Rental income
- $27,577
- − Mortgage interest
- −$11,091
- − Property taxes
- −$2,970
- − Insurance
- −$990
- − Repairs & maintenance
- −$2,206
- − Management
- −$2,206
- − Depreciation
- −$5,760
- Taxable income
- $2,353
- Est. tax owed @ 24.0%
- −$565
- After-tax cash flow
- $4,801/yr
For passive investors: Depreciation is non-cash, so a rental often shows a tax loss while cash-flowing — sheltering income. Rental losses are passive: they offset passive income freely, and up to $25,000/yr can offset ordinary (W-2) income if you actively participate and your MAGI is under $100k (phasing out to $0 by $150k); unused losses carry forward. On sale, claimed depreciation is recaptured at up to 25%, and gains may owe capital-gains tax (a 1031 exchange can defer both). Figures are a year-1 estimate at your 24.0% rate — not tax advice; consult a CPA.
Condition & rehab AI · 13 photos
A charming single-level mobile home with average condition, requiring some cosmetic updates and maintenance to improve its resale and rental value.
Repairs flagged
- Minor Kitchen appliances — The appliances are functional but may need cleaning or minor repairs.
- Minor Bathroom fixtures — The fixtures are functional but may need cleaning or minor repairs.
- Minor Landscaping — The landscaping could be improved with some updates.
Value-add opportunities
- Resale Paint interior walls and trim — Fresh paint can make the interior look more appealing and modern.
- Resale Replace flooring — New flooring can significantly improve the home's appearance and value.
- Resale Update kitchen appliances — Modern appliances can make the kitchen more functional and attractive to potential buyers.
- Resale Update bathroom fixtures — Modern fixtures can make the bathroom more functional and attractive to potential buyers.
- Both Landscaping improvements — Improved landscaping can enhance curb appeal and add value to both resale and rental.
Renovation cost estimate screening
| Repair item | Severity | Est. cost |
|---|---|---|
| Kitchen appliances · The appliances are functional but may need cleaning or minor repairs. | Minor | $500–3,000 |
| Bathroom fixtures · The fixtures are functional but may need cleaning or minor repairs. | Minor | $500–3,000 |
| Landscaping · The landscaping could be improved with some updates. | Minor | $500–3,000 |
| Total estimated repair cost · 3 items | $1,500–9,000 |
Value-add ROI direction
- Resale Paint interior walls and trim — Fresh paint can make the interior look more appealing and modern. ↑
- Resale Replace flooring — New flooring can significantly improve the home's appearance and value. ↑
- Resale Update kitchen appliances — Modern appliances can make the kitchen more functional and attractive to potential buyers. ↑
- Resale Update bathroom fixtures — Modern fixtures can make the bathroom more functional and attractive to potential buyers. ↑
- Both Landscaping improvements — Improved landscaping can enhance curb appeal and add value to both resale and rental. ↑
ⓘ Cost ranges are severity-bucket heuristics (US national rule-of-thumb). Get contractor quotes + a written scope before underwriting a rehab budget.
Schools (NCES district)
- District
- Culver City Unified
- NCES district ID
- 0610260
- Math proficiency
- 53% ▼ -3.00%
- Reading proficiency
- 62% ▼ -8.00%
- Median HH income
- $78,489
- Composite
- 51.7/100
- National rank
- #1689
- State rank
- #79 of 517 in CA
Livability — Culver City
- Score
- 73/100
- State rank
- #163
- US rank
- #5340
Category grades
Schools grade is shown separately in the Schools card above.
Census & demographics
- Census place
- Culver City, CA
- County
- Los Angeles County · 9,444,647 people
- City population
- 47,563
- Metro
- Los Angeles-Long Beach-Anaheim, CA
- Population (ZIP)
- 31,009
- Household income
- $107,109
- Rent vs Own
- Severe rent burden
- 1428.0
Population outlook (Los Angeles County) Hauer SSP2
- Today (2025)
- 10,940,515 people
- By 2030
- 11,256,481 · +2.9%
- By 2040
- 11,729,929 · +7.2%
- By 2050
- 11,948,407 · +9.2%
- By 2075
- 11,818,114 · +8.0%
- By 2100
- 10,842,928 · -0.9%
Race, ethnicity, and origin ACS 2023
- Neighborhood character
- Highly diverse neighborhood (Simpson 0.74)
- Race & ethnicity
- White 37% Hispanic / Latino 30% Two or more races 20% Asian 17% Black 8%
- Hispanic origin (detail)
- Mexican 23%
- Common ancestry
- Italian 3% Romanian 2% Scotch-Irish 2%
- Foreign-born
- 26% · Canada, China, South Korea
- Languages at home
- 56% English-only · Spanish 25% Other Asian/Pacific 5% Other Indo-European 5%
Political lean MEDSL · Los Angeles
- 2024 margin
- Solid D (+32.9) · D 64.8% · R 31.9% · Other 3.3%
- 2008→2024 swing
- -7.4pp toward R · 2008: 40.4pp · 2024: 32.9pp
- All cycles
- 2024: D+32.9 2020: D+44.2 2016: D+48.0 2012: D+40.0 2008: D+40.4
Not yet ingested
- Civics
- —
Market trends
- HPI YoY
- ▼ -1229.17%
- Current HPI
- 460.1149
- Rent YoY
- ▲ 2.03%
- Metro
- Los Angeles-Long Beach-Anaheim, CA
- State GDP YoY
- ▲ 3.21%
- F500 in state
- 116
Industry mix (Fortune 500 HQ in CA)
| Industry | F500 HQs | Revenue |
|---|---|---|
| Technology | 27 | $1,492B |
|
||
| Financial Services | 3 | $174B |
|
||
| Retail | 3 | $44B |
|
||
| Insurance | 3 | $26B |
|
||
| Media / Entertainment | 2 | $115B |
|
||
| Pharmaceuticals / Biotech | 2 | $62B |
|
||
Price history
-7.9% since first listed6 events — show timeline
- 2026-02-02 Price Changed $198,000 TheMLS
- 2025-12-31 Listed $214,999 TheMLS
- 2025-11-24 Listed — TheMLS
- 2025-11-18 Listing Removed — bridgeMLS, Bay East AOR, or Contra Costa AOR
- 2025-11-15 Listed — bridgeMLS, Bay East AOR, or Contra Costa AOR
- 2023-11-18 Listed — TheMLS
Cash-flow waterfall
monthlySold comps — $/sqft
last 12 mo · ≤1 miLoading sold comps…