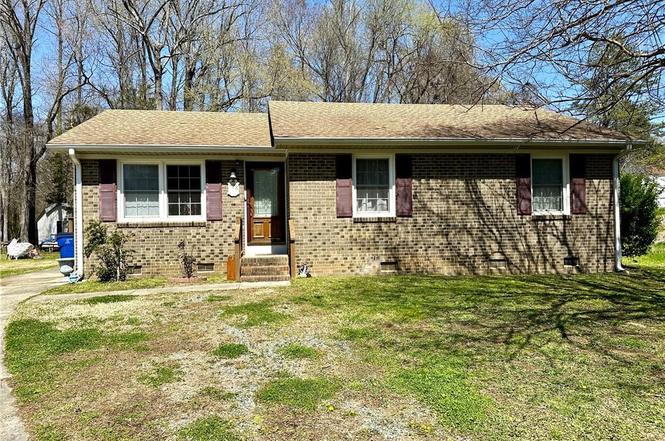
528 Carol Leigh Dr · Gibsonville, NC
Flood risk 6/10 · Moderate
- FEMA flood zone
- X (unshaded)
- Chance of flooding over 30 yrs
- 0.72%
- Est. flood insurance / yr
- $507 – $1,088
Fire risk 2/10 · Minimal
- Est. fire insurance / yr
- $906 – $1,684
Heat risk 5/10 · Moderate
- Hot days now (above 104°F)
- 7 days/yr
- Hot days in 30 yrs
- 18 days/yr
Wind risk 5/10 · Moderate
- Chance of severe wind over 30 yrs
- 22.0%
Air-quality risk 2/10 · Minimal
- Unhealthy air days now
- 2 days/yr
- Unhealthy air days in 30 yrs
- 2 days/yr
Risk factors via First Street. Map © Google.
Why this score? — see what drove the C+ grade
The composite is a weighted blend of 9 inputs, each scored 0–100. Each bar is that input's sub-score; the figure is the points it added to the 100-point composite (weight × sub-score).
- Cash flow +22.7/30.0
- ARV discount +15.0/15.0
- DSCR +7.3/10.0
- 1% rule +4.8/10.0
- Livability +3.7/5.0
- Schools +3.6/10.0
- Rent growth +2.5/5.0
- Condition / age +2.5/5.0
- Appreciation +0.0/10.0
$175,000
🖨 Deal sheet 📄 Offer letter ✓ Due diligence
Listing remarks
GIBSONVILLE Single Family! 3Br 1.5Ba with Brick and Vinyl Exterior! Great Opportunity as a fixer upper having lot of potential! Good floorplan layout. Den could be an extra bedroom, office, or playroom. This is a great first home or investment property. Large side deck. Multiple storage buildings. Convenient location and sold AS IS!
Key facts
- Large side deck
- Convenient location
- 0.26 acre lot
Tags
Property features AI
Finance
- Other: Publicly maintained road access
- HOA & community: No homeowners association; Subdivision: Carol Leigh
Exterior
- Parking: Driveway (paved); no garage
- Utilities: Public water; Public sewer; Electric water heater
- Home design: Residential stick/site-built house; One story
- Construction: Built in 1975; Brick and vinyl siding exterior
- Exterior features: No fencing; City lot; Level, flat lot
Interior
- Kitchen: Microwave; Dishwasher; Free-standing electric range; Electric water heater
- Bedrooms: All bedrooms on the main level
- Flooring: Carpet; Vinyl
- Bathrooms: 1 full bathroom; 1 half bathroom
- Heating & cooling: Heat pump for heating and cooling; Electric heating
- Interior features: Primary bedroom located on the main level; Pulldown attic stairs
- Laundry & utility: Washer hookup; Dryer connection; Laundry on the main level
Neighborhood map
What this means for you Summary
Snapshot
- This is a 3-bed/1.5-bath single-family listed at $175k.
Deal economics
- At list price, monthly cash flow is $300 ($4k/yr) — positive.
- The deal already cash-flows at list — no discount required.
- To meet the 1% rule (rent ≥ 1% of price), the offer needs to be $172k (1.7% below list).
- Recommended offer: $170k (3.0% below list) — sets the bar for market timing.
- Cap rate 8.3% vs local median 4.2% in Gibsonville — top-decile yield for the area; either an underpriced asset or a hidden risk that comps aren't pricing in. Stress-test before assuming the spread holds.
Location & tenants
- Location reads 73/100 on livability (#79 in NC) — a middle-class / working-renter tenant base. Strengths: employment A+, cost of living A+, housing A+; Watch: health & safety C-, amenities F, commute F.
- Guilford County Schools (urban): math 39% / reading 45% proficiency, ranked #99 of 178 in NC (top 56%) — families likely to look elsewhere, expect single-tenant / working-renter base with shorter leases.
- Zoned schools: Gibsonville Elementary (math 46% / reading 46%, grade D-, #551 of 1,410 statewide, top 40%, 564 students, 60% FRL); Eastern Guilford Middle (math 26% / reading 38%, grade F, #317 of 475 statewide, top 68%, 980 students, 75% FRL); Eastern Guilford High (math 25% / reading 37%, grade F, #454 of 535 statewide, top 85%, 1,198 students, 67% FRL) — zoned schools average 68% FRL vs 52% district-wide (15 pts higher); higher-poverty schools than district average — tighter screening recommended.
- Market conditions: 215 active listings in the ZIP; 8 comparable units currently listed for rent nearby; rentals at typical pace (median 21d on market — plan ~3-4 weeks tenant-placement turnaround); solid renter incomes; 3,843 units permitted in Guilford County in 2024 (2,397 in 5+ unit buildings).
Forward outlook
- Local home prices are declining (-3.0%/yr); year-one equity from $1k of loan paydown is wiped out by about $5k of value loss. Plan a longer hold.
- Guilford County population projected at +26% by 2050 — long-run rental-demand tailwind backs the buy-and-hold thesis.
Negotiation context
- It's been on market 31 days — a 3% lower offer ($170k) is reasonable based on typical stale-listing flexibility.
- 2 sale attempts with the ask held roughly flat each time — persistent listings suggest the price (not the market) is what's stuck; bring a comps-based counter.
- Current owner paid $26k; list at $175k implies a 560% gain — meaningful room to come down on a strong offer.
Risks & watch-outs
- Climate carrying-cost: major flood risk; moderate wind risk, 22% chance of damaging wind over 30y; extreme-heat days projected 7→18/yr by 2055 (HVAC capex compounding) — expect insurance premiums to compound above CPI over the hold.
Questions for the listing agent
- It's been on market 31 days. Have you received any prior offers? Is the seller open to a 3% concession, seller financing, or rate buy-down credit?
- Built in 1975 — when were the roof, HVAC, electrical panel, plumbing, and water heater last replaced?
- Is there a deadline driving the sale (1031 exchange, divorce, estate, relocation)? That informs how much negotiation room exists.
- Schools are D-rated, which usually means shorter tenancies and higher turnover. Who's the typical renter profile here, and what's been the actual vacancy rate?
- What's the average days-on-market for RENTAL listings here right now (not sales)? A rising rental-DOM trend means longer vacancies and softer asking-rent achievability than the comps imply.
- What's the recent tenant-quality profile in this submarket — average credit score on applications, eviction rate, late-payment / NSF rate, and stable-employment percentage? A property-management company in the area should have these aggregated.
- How much new for-sale + rental construction is in the pipeline within 1–3 miles? Heavy new supply typically softens prices + rents 12–24 months out; constrained supply supports both.
Investment metrics
- 1% rule
- 0.98% ✗
- Cap rate
- 8.35%
- Cash-on-cash
- 7.34%
- DSCR
- 1.33
- GRM
- 8.5
CMA / ARV
- ARV (on-the-fly)
- $284,240
- Comps found
- 12
Show comp detail 12 sales within ~0.75 mi
| Address | Dist | Beds/Ba | Sqft | Sold | Price | $/sf | Match |
|---|---|---|---|---|---|---|---|
| 1100 Lashley Park Dr | 0.42mi | 3/2.0 | 1,421 (-5%) | 3mo | $248,000 | $175 | 67 |
| 1005 Lashley Park Dr | 0.34mi | 3/2.0 | 1,400 (-6%) | 7mo | $269,000 | $192 | 66 |
| 216 Cypress Ct | 0.53mi | 3/2.5 | 1,445 (-3%) | 3mo | $275,000 | $190 | 63 |
| 308 Burlington Ave | 0.54mi | 3/1.5 | 1,482 (-1%) | 13mo | $195,000 | $132 | 62 |
| 1212 Lashley Park Dr | 0.39mi | 3/2.0 | 1,345 (-10%) | 4mo | $276,000 | $205 | 59 |
| 232 Burlington Ave | 0.51mi | 3/2.0 | 1,376 (-8%) | 2mo | $65,000 | $47 | 59 |
| 1311 Dogwood Dr | 0.58mi | 3/2.0 | 1,531 (+2%) | 10mo | $328,999 | $215 | 59 |
| 330 Alamance St | 0.43mi | 3/2.0 | 1,598 (+7%) | 10mo | $330,000 | $207 | 58 |
| 225 Cummings St | 0.53mi | 2/1.0 (-1) | 1,509 (+1%) | 20mo | $190,000 | $126 | 50 |
| 519 W Main St | 0.53mi | 3/2.0 | 1,370 (-8%) | 14mo | $239,000 | $174 | 48 |
| 612 Scott Dr | 0.61mi | 3/2.0 | 1,425 (-5%) | 18mo | $278,000 | $195 | 46 |
| 317 Wood St | 0.72mi | 4/2.0 (+1) | 1,623 (+8%) | 8mo | $210,000 | $129 | 39 |
Match score weights: distance 35% · size 25% · config 20% · recency 20%. Top-matched comps best support the ARV.
Projected returns pro-forma
-3.0% appreciation · 3.0% rent growth · sell at horizon
- IRR
- -5.1%
- Equity multiple
- 0.81×
- Total profit
- $-9,331
- Equity at exit
- $26,093
- IRR
- 4.5%
- Equity multiple
- 1.33×
- Total profit
- $16,190
- Equity at exit
- $15,131
Cash invested: $49,000 (down + closing). Projections, not guarantees.
Landlord ↔ Tenant lean methodology
- Overall (STATE)
- 85 Strongly Landlord-Friendly
- State North Carolina
- 85 Strongly Landlord-Friendly · R+3
- County
- — inherits STATE
- City
- — inherits STATE
ZIP-level market 27249
- Home prices YoY
- -24.2%
- Active inventory
- 215
- Price-to-rent
- 8.5×
Monthly cashflow live
- Estimated rent
- $1,720 high interval (Pro) →
- Mortgage (P&I)
- −$918
- Tax from tax record
- −$68 /mo · $816/yr
- Insurance
- −$73
- HOA
- −$0
- Vacancy / Maint / Mgmt
- −$361
- Net cashflow
- $300
Break-even live
UW: 25.0% down · 7.5% · 30yr · 1.5% tax · 5.0% vac · 8.0% maint · 8.0% mgmt
Financing live
Cash to close
- Down payment
- $43,750
- Closing costs
- $5,250
- Reserves months
- —
- Total cash needed
- —
Loan-product check · same deal, 3 products live
Conventional
25% down · 7.5% · 30yr
- Down + closing
- —
- Monthly P&I
- —
- Monthly cashflow
- —
- DSCR
- —
- Eligible?
- —
Personal DTI + credit; lowest rate.
DSCR
20% down · 8.5% · 30yr
- Down + closing
- —
- Monthly P&I
- —
- Monthly cashflow
- —
- DSCR
- —
- Eligible?
- —
No personal income docs; deal must DSCR.
Hard money
10% down · 12.0% · 12mo
- Down + closing
- —
- Monthly P&I
- —
- Monthly cashflow
- —
- DSCR
- —
- Eligible?
- —
Short-term bridge; refi at stabilization.
Rent comps 8 comps
| Address | Beds | Baths | Sqft | Rent | $/sqft | DOM | Units | Dist |
|---|---|---|---|---|---|---|---|---|
| 433 Homestead St Unit B Gibsonville, NC | 2.0 | 1.5 | 950 | $975 | $1.03 | 23d | 1 | 0.41mi |
| 713 E Joyner St Unit 713 A-C JOYNER STREET-B Gibsonville, NC | 2.0 | 1.0 | 900 | $975 | $1.08 | 23d | 1 | 0.60mi |
| 515 Burlington Ave Gibsonville, NC | 3.0 | 1.0 | 962 | $1,450 | $1.51 | 21d | 1 | 0.68mi |
| 206 N Wyrick St Gibsonville, NC | 3.0 | 1.5 | 1040 | $1,610 | $1.55 | 21d | 1 | 0.80mi |
| 124 Crosscut Ln Gibsonville, NC | 3.0 | 2.5 | 1667 | $1,825 | $1.09 | 23d | 1 | 0.97mi |
| 231 Graphite Dr Gibsonville, NC | 3.0 | 2.5 | 1465 | $2,095 | $1.43 | 13d | 1 | 1.36mi |
| 694 Huntingdon St Elon, NC | 3.0 | 2.0 | 1392 | $1,750 | $1.26 | 21d | 1 | 1.47mi |
| 1022 Poets Walk Rd Unit 1 Whitsett, NC | 3.0 | 2.5 | 1706 | $1,850 | $1.08 | 21d | 1 | 1.50mi |
Listing history 14 events
-
2026-06-07statusdays on market $175,000 Pending 31 DOM
-
2026-06-03days on market $175,000 Due Diligence Period 29 DOM
-
2026-06-02days on market $175,000 Due Diligence Period 28 DOM
-
2026-06-01days on market $175,000 Due Diligence Period 27 DOM
-
2026-05-31days on market $175,000 Due Diligence Period 26 DOM
-
2026-05-31days on market $175,000 Due Diligence Period 25 DOM
-
2026-05-17historical Due Diligence Period
-
2026-05-12status Active
-
2026-03-12historical
-
2026-03-05$175,000 Active
-
2025-04-10price $175,000
-
2025-04-02price $190,000
-
1978-06-01soldstatus $26,500
-
1975-06-01soldstatus $22,000
ⓘ Source: listings_history table (triggers on properties + properties_extension) + one-shot
backfill from property_details.listing_events for pre-trigger history.
Tax reassessment forecast NC · Resets to sale price
- Current annual tax
- $816 · $68/mo
- Projected year-2 tax
- $1,435 · $120/mo
- Expected delta
- +$619/yr (+$52/mo · 75.9%)
ⓘ Screening estimate from a state-policy table — verify with the county assessor before closing.
Climate risk First Street
- Flood 6/10 Major FEMA zone X (unshaded) · 72% chance over 30 yrs
- Wildfire 2/10 Low
- Heat 5/10 Major 7 d/yr ≥104°F today · 18 d/yr by 30 yrs out
- Wind 5/10 Major 22% chance of damaging wind over 30 yrs
- Air quality 2/10 Low 2 unhealthy d/yr today · 2 by 30 yrs out
Nearby sold comps map
Loading sold comps map…
Walkable amenities ~0.75 mi
Loading nearby amenities…
Taxation est. · year 1
- Rental income
- $20,634
- − Mortgage interest
- −$9,803
- − Property taxes
- −$816
- − Insurance
- −$875
- − Repairs & maintenance
- −$1,651
- − Management
- −$1,651
- − Depreciation
- −$5,091
- Taxable income
- $748
- Est. tax owed @ 24.0%
- −$180
- After-tax cash flow
- $3,418/yr
For passive investors: Depreciation is non-cash, so a rental often shows a tax loss while cash-flowing — sheltering income. Rental losses are passive: they offset passive income freely, and up to $25,000/yr can offset ordinary (W-2) income if you actively participate and your MAGI is under $100k (phasing out to $0 by $150k); unused losses carry forward. On sale, claimed depreciation is recaptured at up to 25%, and gains may owe capital-gains tax (a 1031 exchange can defer both). Figures are a year-1 estimate at your 24.0% rate — not tax advice; consult a CPA.
Schools (NCES district)
- District
- Guilford County Schools
- NCES district ID
- 3701920
- Math proficiency
- 39% ▲ 1.00%
- Reading proficiency
- 45% ▲ 1.00%
- Median HH income
- $46,315
- Composite
- 35.78/100
- National rank
- #4842
- State rank
- #99 of 178 in NC
Livability — Gibsonville
- Score
- 73/100
- State rank
- #79
- US rank
- #5651
Category grades
Schools grade is shown separately in the Schools card above.
Census & demographics
- Census place
- Gibsonville, NC
- County
- Guilford County · 487,190 people
- City population
- 13,741
- Metro
- Greensboro-High Point, NC
- Population (ZIP)
- 13,741
- Household income
- $80,880
- Rent vs Own
- Severe rent burden
- 144.0
Population outlook (Guilford County) Hauer SSP2
- Today (2025)
- 584,596 people
- By 2030
- 616,851 · +5.5%
- By 2040
- 678,451 · +16.1%
- By 2050
- 734,788 · +25.7%
- By 2075
- 862,985 · +47.6%
- By 2100
- 948,704 · +62.3%
Race, ethnicity, and origin ACS 2023
- Neighborhood character
- Predominantly White (80%)
- Race & ethnicity
- White 80% Black 12% Two or more races 4% Hispanic / Latino 3%
- Common ancestry
- Serbian 6% Romanian 2% Iranian 2%
- Foreign-born
- 1% · Canada
- Languages at home
- 97% English-only · Spanish 2%
Political lean MEDSL · Guilford
- 2024 margin
- Strong D (+21.8) · D 60.2% · R 38.4% · Other 1.4%
- 2008→2024 swing
- +3.5pp toward D · 2008: 18.4pp · 2024: 21.8pp
- All cycles
- 2024: D+21.8 2020: D+23.1 2016: D+20.0 2012: D+16.5 2008: D+18.4
Not yet ingested
- Civics
- —
Market trends
- HPI YoY
- ▼ -71.71%
- Current HPI
- 224.3187
- Rent YoY
- —
- Metro
- Greensboro-High Point, NC
- State GDP YoY
- ▲ 3.28%
- F500 in state
- 26
Industry mix (Fortune 500 HQ in NC)
| Industry | F500 HQs | Revenue |
|---|---|---|
| Financial Services | 2 | $213B |
|
||
| Retail | 2 | $95B |
|
||
| Industrial Conglomerate | 1 | $38B |
|
||
| Metals / Steel | 1 | $35B |
|
||
| Utilities | 1 | $30B |
|
||
| Industrial Machinery | 1 | $19B |
|
||
Price history
+695.5% since first listed8 events — show timeline
- 2026-05-17 Contingent — Triad MLS
- 2026-05-12 Relisted — Triad MLS
- 2026-03-12 Delisted — Triad MLS
- 2026-03-05 Listed $175,000 Triad MLS
- 2025-04-10 Price Changed $175,000 Triad MLS
- 2025-04-02 Price Changed $190,000 Triad MLS
- 1978-06-01 Sold (Public Records) $26,500 Public Records
- 1975-06-01 Sold (Public Records) $22,000 Public Records
Property tax history
+8.0%/yrLatest (2025): $816 · +2.5% YoY. Source: county tax records.
Cash-flow waterfall
monthlySold comps — $/sqft
last 12 mo · ≤1 miLoading sold comps…