 Duplex
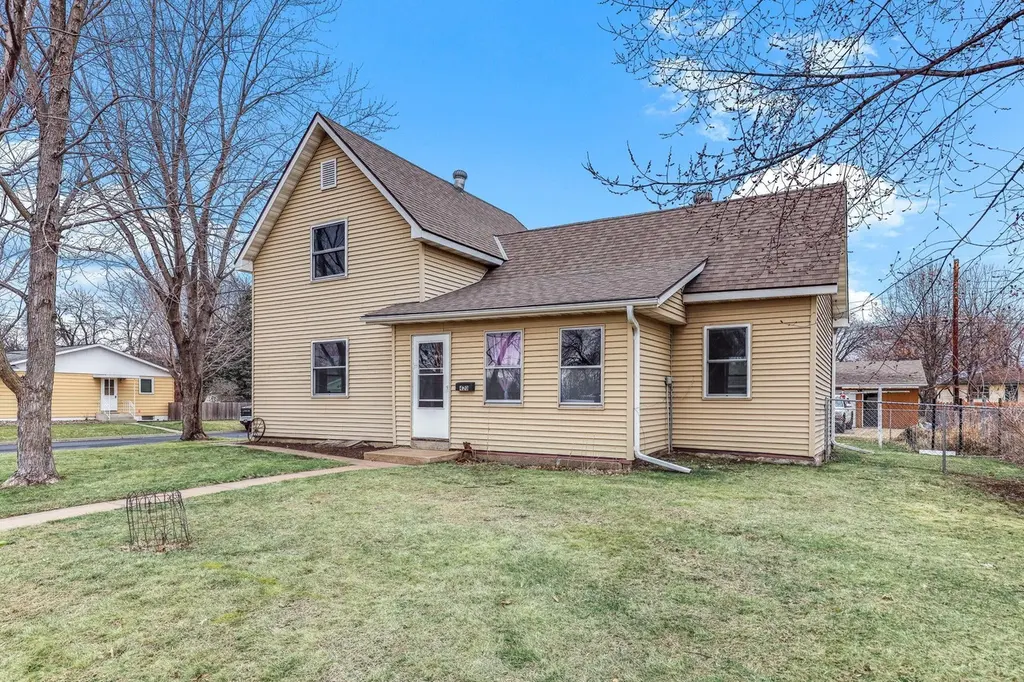
420 14th St W · Hastings, MN
Flood risk 1/10 · Minimal
- FEMA flood zone
- X (unshaded)
- Chance of flooding over 30 yrs
- 0.0%
- Est. flood insurance / yr
- $507 – $1,088
Fire risk 1/10 · Minimal
- Est. fire insurance / yr
- $888 – $1,650
Heat risk 2/10 · Minimal
- Hot days now (above 98°F)
- 7 days/yr
- Hot days in 30 yrs
- 14 days/yr
Wind risk 2/10 · Minimal
- Chance of severe wind over 30 yrs
- —
Air-quality risk 1/10 · Minimal
- Unhealthy air days now
- 0 days/yr
- Unhealthy air days in 30 yrs
- 0 days/yr
Risk factors via First Street. Map © Google.
Why this score? — see what drove the D+ grade
The composite is a weighted blend of 9 inputs, each scored 0–100. Each bar is that input's sub-score; the figure is the points it added to the 100-point composite (weight × sub-score).
- Cash flow +18.6/30.0
- ARV discount +7.5/15.0
- DSCR +5.8/10.0
- 1% rule +4.6/10.0
- Schools +4.2/10.0
- Livability +3.8/5.0
- Rent growth +2.5/5.0
- Condition / age +2.5/5.0
- Appreciation +0.0/10.0
$350,000
🖨 Deal sheet (PDF) 📄 Offer letter ✓ Due diligence
Multi-family units
County records classify this as Multi-Family (2-4 Unit). Listing-text estimate: 2 units. confirmed
Listing remarks MLS
Fully remodeled up/down duplex offering strong income potential and low-maintenance ownership. This property features a spacious 2-bedroom unit and a comfortable 1-bedroom unit, both updated with modern finishes, mechanicals, and electrical. Situated on a large corner lot, the property also includes a rare 6-stall garage with the potential to generate up to $900/month in additional rental income. A turnkey opportunity for both investors and owner-occupants alike.
Key facts
- Remodeled duplex
- Large corner lot
- Modern finishes
Tags
Neighborhood map
What this means for you Summary
Snapshot
- This is a 2 × 3-bed/2.0-bath units multifamily listed at $350k.
Deal economics
- At list price, monthly cash flow is $338 ($4k/yr) — positive. Per door: $169/mo.
- The deal already cash-flows at list — no discount required.
- To meet the 1% rule (rent ≥ 1% of price), the offer needs to be $338k (3.6% below list).
- Recommended offer: $329k (6.0% below list) — sets the bar for market timing.
- Cap rate 7.5% vs local median 2.9% in Hastings — top-decile yield for the area; either an underpriced asset or a hidden risk that comps aren't pricing in. Stress-test before assuming the spread holds.
Location & tenants
- Location reads 75/100 on livability (#176 in MN, #3,817 nationally) — a middle-class / working-renter tenant base. Strengths: crime A+, employment A+, housing A+; Watch: amenities F, commute F.
- Hastings Public School District (town): math 43% / reading 50% proficiency, ranked #136 of 301 in MN (top 45%) — families likely to look elsewhere, expect single-tenant / working-renter base with shorter leases; only 17% free/reduced lunch — higher-income household profile.
- Zoned schools: Pinecrest Elementary (math 62% / reading 42%, grade C-, #368 of 857 statewide, top 47%, 450 students, 27% FRL); Hastings Middle School (math 33% / reading 48%, grade F, #144 of 258 statewide, top 56%, 1,210 students, 33% FRL); Hastings High School (math 46% / reading 67%, grade C, #77 of 471 statewide, top 17%, 1,353 students, 24% FRL).
- Market conditions: 180 active listings in the ZIP; 3 comparable units currently listed for rent nearby; rentals leasing fast (median 0d on market — plan ~1-2 weeks tenant-placement turnaround); solid renter incomes; 2,134 units permitted in Dakota County in 2024 (898 in 5+ unit buildings).
- This rent runs 39% of the median local income ($104k/yr) — at the standard rent-burdened threshold; future hikes will face affordability resistance.
Forward outlook
- Local home prices are declining (-3.0%/yr); year-one equity from $2k of loan paydown is wiped out by about $10k of value loss. Plan a longer hold.
- Dakota County population projected at +11% by 2050 — modest demand growth; plan on rents tracking national, not racing it.
Negotiation context
- It's been on market 65 days — a 6% lower offer ($329k) is reasonable based on typical stale-listing flexibility.
- 6 sale attempts since 7y ago with the ask held roughly flat each time — persistent listings suggest the price (not the market) is what's stuck; bring a comps-based counter.
Risks & watch-outs
- Watch-outs: built in 1890 — expect roof / HVAC / electrical / plumbing capex.
Questions for the listing agent
- It's been on market 65 days. Have you received any prior offers? Is the seller open to a 6% concession, seller financing, or rate buy-down credit?
- Can we see the unit-by-unit rent roll, current vacancy, and any below-market leases? What's the average tenancy length?
- What capital expenditures (roof, boiler, parking lot, exteriors) have been made in the last 5 years, and what's planned in the next 2?
- Built in 1890 — when were the roof, HVAC, electrical panel, plumbing, and water heater last replaced?
- Why hasn't it sold? Are there any deal-killer items the seller is aware of (foundation, flood, title, zoning, code violations)?
- Is there a deadline driving the sale (1031 exchange, divorce, estate, relocation)? That informs how much negotiation room exists.
- Schools are A-rated — typically a magnet for longer-tenancy family renters. What's the average tenant stay here, and is there a school-zone premium baked into asking?
- The area grade is low — what's the realistic commute time and amenity access for the typical tenant pool here? Any planned neighborhood developments (good or bad) we should know about?
- What's the average days-on-market for RENTAL listings here right now (not sales)? A rising rental-DOM trend means longer vacancies and softer asking-rent achievability than the comps imply.
- What's the recent tenant-quality profile in this submarket — average credit score on applications, eviction rate, late-payment / NSF rate, and stable-employment percentage? A property-management company in the area should have these aggregated.
- How much new apartment / multifamily construction is in the pipeline within 1–3 miles? Heavy new supply (>2% of stock underway) typically softens rents 12–24 months out; light construction supports rent growth.
Investment metrics
- 1% rule
- 0.96% ✗
- Cap rate
- 7.45%
- Cash-on-cash
- 4.13%
- DSCR
- 1.18
- GRM
- 8.6
CMA / ARV
No comps found within radius.
Projected returns pro-forma
-3.0% appreciation · 3.0% rent growth · sell at horizon
- IRR
- -9.8%
- Equity multiple
- 0.64×
- Total profit
- $-35,215
- Equity at exit
- $52,186
- IRR
- -0.4%
- Equity multiple
- 0.97×
- Total profit
- $-2,992
- Equity at exit
- $30,262
Cash invested: $98,000 (down + closing). Projections, not guarantees.
Landlord ↔ Tenant lean methodology
- Overall (STATE)
- 46 Balanced
- State Minnesota
- 46 Balanced · D+2
- County
- — inherits STATE
- City
- — inherits STATE
ZIP-level market 55033
- Active inventory
- 180
- Price-to-rent
- 17.3×
Monthly cashflow live
- Estimated rent
- $3,375 medium interval (Pro) →
- Mortgage (P&I)
- −$1,835
- Tax from tax record
- −$347 /mo · $4,168/yr
- Insurance
- −$146
- HOA
- −$0
- Vacancy / Maint / Mgmt
- −$709
- Net cashflow
- $338
Break-even live
Sensitivity live
| Price | -10% $536 | -5% $437 | +0% $338 | +5% $239 | +10% $140 |
|---|---|---|---|---|---|
| Rent | -10% $71 | -5% $204 | +0% $338 | +5% $471 | +10% $604 |
| Rate | -1.0pp $514 | -0.5pp $427 | base $338 | +0.5pp $247 | +1.0pp $155 |
2-unit breakdown (identical units grouped — click to expand)
| Units | Beds | Baths | Est. rent |
|---|---|---|---|
| 2× units | 3 | 2 | $3,374 |
| #1 | 3 | 2 | $1,687 |
| #2 | 3 | 2 | $1,687 |
| Total (2 units) | $3,375 | ||
UW: 25.0% down · 7.5% · 30yr · 1.5% tax · 5.0% vac · 8.0% maint · 8.0% mgmt
Financing live
Cash to close
- Down payment
- $87,500
- Closing costs
- $10,500
- Reserves months
- —
- Total cash needed
- —
Loan-product check · same deal, 3 products live
Conventional
25% down · 7.5% · 30yr
- Down + closing
- —
- Monthly P&I
- —
- Monthly cashflow
- —
- DSCR
- —
- Eligible?
- —
Personal DTI + credit; lowest rate.
DSCR
20% down · 8.5% · 30yr
- Down + closing
- —
- Monthly P&I
- —
- Monthly cashflow
- —
- DSCR
- —
- Eligible?
- —
No personal income docs; deal must DSCR.
Hard money
10% down · 12.0% · 12mo
- Down + closing
- —
- Monthly P&I
- —
- Monthly cashflow
- —
- DSCR
- —
- Eligible?
- —
Short-term bridge; refi at stabilization.
Rent comps 3 comps
| Address | Beds | Baths | Sqft | Rent | $/sqft | DOM | Units | Dist |
|---|---|---|---|---|---|---|---|---|
| 1000 Lyn Way Hastings, MN | 2.0 | 1.0 | 975 | $1,220 | $1.25 | 0d | 1 | 0.71mi |
| 600 Westview Dr Hastings, MN | 2.0 | 1.0 | 825 | $1,058 | $1.28 | 0d | 1 | 1.13mi |
| 325 33rd St W Hastings, MN | 1.0–3.0 | 1.0–2.0 | 920 | $1,848 | $2.01 | 0d | 23 | 1.29mi |
Listing history 13 events
-
2026-06-01status $350,000 Pending 65 DOM
-
2026-05-31days on market $350,000 Contingent - Inspection 65 DOM
-
2026-03-27$350,000 Active 467-char remark
Show marketing remark (467 chars)
Fully remodeled up/down duplex offering strong income potential and low-maintenance ownership. This property features a spacious 2-bedroom unit and a comfortable 1-bedroom unit, both updated with modern finishes, mechanicals, and electrical. Situated on a large corner lot, the property also includes a rare 6-stall garage with the potential to generate up to $900/month in additional rental income. A turnkey opportunity for both investors and owner-occupants alike.
-
2019-11-29status Active
-
2019-10-01historical
-
2019-07-31status Pending
-
2019-07-17Contingent - Inspection
-
2019-07-08status Active
-
2019-07-08historical
-
2019-06-17$250,000
-
2019-06-14status Pending
-
2019-06-01historical Contingent - Inspection
-
2019-05-04$250,000 Active
ⓘ Source: listings_history table (triggers on properties + properties_extension) + one-shot
backfill from property_details.listing_events for pre-trigger history.
Tax reassessment forecast MN · Partial reset (capped growth)
- Current annual tax
- $4,168 · $347/mo
- Projected year-2 tax
- $4,168 · $347/mo
- Expected delta
- $0/yr ($0/mo · 0.0%)
ⓘ Screening estimate from a state-policy table — verify with the county assessor before closing.
Climate risk First Street
- Flood 1/10 Low FEMA zone X (unshaded) · 0% chance over 30 yrs
- Wildfire 1/10 Low
- Heat 2/10 Low 7 d/yr ≥98°F today · 14 d/yr by 30 yrs out
- Wind 2/10 Low
- Air quality 1/10 Low 0 unhealthy d/yr today · 0 by 30 yrs out
Nearby sold comps map
Loading sold comps map…
Walkable amenities ~0.75 mi
Loading nearby amenities…
Taxation est. · year 1
- Rental income
- $40,500
- − Mortgage interest
- −$19,605
- − Property taxes
- −$4,168
- − Insurance
- −$1,750
- − Repairs & maintenance
- −$3,240
- − Management
- −$3,240
- − Depreciation
- −$10,182
- Taxable loss
- −$1,685
- Est. tax savings @ 24.0%
- +$404
- After-tax cash flow
- $4,456/yr
For passive investors: Depreciation is non-cash, so a rental often shows a tax loss while cash-flowing — sheltering income. Rental losses are passive: they offset passive income freely, and up to $25,000/yr can offset ordinary (W-2) income if you actively participate and your MAGI is under $100k (phasing out to $0 by $150k); unused losses carry forward. On sale, claimed depreciation is recaptured at up to 25%, and gains may owe capital-gains tax (a 1031 exchange can defer both). Figures are a year-1 estimate at your 24.0% rate — not tax advice; consult a CPA.
Schools (NCES district)
- District
- Hastings Public School District
- NCES district ID
- 2713530
- Math proficiency
- 43% ▼ -25.00%
- Reading proficiency
- 50% ▼ -16.00%
- Median HH income
- $69,586
- Composite
- 41.73/100
- National rank
- #3404
- State rank
- #136 of 301 in MN
Livability — Hastings
- Score
- 75/100
- State rank
- #176
- US rank
- #3817
Category grades
Schools grade is shown separately in the Schools card above.
Census & demographics
- Census place
- Hastings, MN
- County
- Dakota County · 417,704 people
- City population
- 29,674
- Metro
- Minneapolis-St. Paul-Bloomington, MN-WI
- Population (ZIP)
- 29,674
- Household income
- $103,988
- Rent vs Own
- Severe rent burden
- 552.0
Population outlook (Dakota County) Hauer SSP2
- Today (2025)
- 450,671 people
- By 2030
- 465,068 · +3.2%
- By 2040
- 486,770 · +8.0%
- By 2050
- 498,743 · +10.7%
- By 2075
- 533,865 · +18.5%
- By 2100
- 550,133 · +22.1%
Race, ethnicity, and origin ACS 2023
- Neighborhood character
- Predominantly White (87%)
- Race & ethnicity
- White 87% Hispanic / Latino 5% Two or more races 4% Asian 2% Black 1%
- Common ancestry
- Portuguese 11% Romanian 4% Lithuanian 3%
- Foreign-born
- 2% · Canada
- Languages at home
- 97% English-only · Spanish 2% Other Asian/Pacific 0%
Political lean MEDSL · Dakota
- 2024 margin
- D (+12.9) · D 55.4% · R 42.5% · Other 2.1%
- 2008→2024 swing
- +7.4pp toward D · 2008: 5.5pp · 2024: 12.9pp
- All cycles
- 2024: D+12.9 2020: D+13.9 2016: D+4.7 2012: D+2.9 2008: D+5.5
Not yet ingested
- Civics
- —
Market trends
- HPI YoY
- ▼ -268.35%
- Current HPI
- 228.8854
- Rent YoY
- —
- Metro
- Minneapolis-St. Paul-Bloomington, MN-WI
- State GDP YoY
- ▲ 2.41%
- F500 in state
- 34
Industry mix (Fortune 500 HQ in MN)
| Industry | F500 HQs | Revenue |
|---|---|---|
| Healthcare | 2 | $407B |
|
||
| Retail | 2 | $150B |
|
||
| Consumer Goods | 2 | $32B |
|
||
| Industrial Machinery | 2 | $6B |
|
||
| Agriculture | 1 | $40B |
|
||
| Healthcare / Medical Devices | 1 | $32B |
|
||
Price history
+40.0% since first listed11 events — show timeline
- 2026-03-27 Listed $350,000 NORTHSTARMLS as Distributed by MLS Grid
- 2019-11-29 Relisted — NORTHSTARMLS as Distributed by MLS Grid
- 2019-10-01 Listing Removed — NORTHSTARMLS as Distributed by MLS Grid
- 2019-07-31 Pending — NORTHSTARMLS as Distributed by MLS Grid
- 2019-07-17 Listed — NORTHSTARMLS as Distributed by MLS Grid
- 2019-07-08 Relisted — NORTHSTARMLS as Distributed by MLS Grid
- 2019-07-08 Listing Removed — NORTHSTARMLS as Distributed by MLS Grid
- 2019-06-17 Listed $250,000 NORTHSTARMLS as Distributed by MLS Grid
- 2019-06-14 Pending — NORTHSTARMLS as Distributed by MLS Grid
- 2019-06-01 Contingent — NORTHSTARMLS as Distributed by MLS Grid
- 2019-05-04 Listed $250,000 NORTHSTARMLS as Distributed by MLS Grid
Property tax history
+3.2%/yrLatest (2025): $4,168 · +12.0% YoY. Source: county tax records.
Cash-flow waterfall
monthlySold comps — $/sqft
last 12 mo · ≤1 miLoading sold comps…