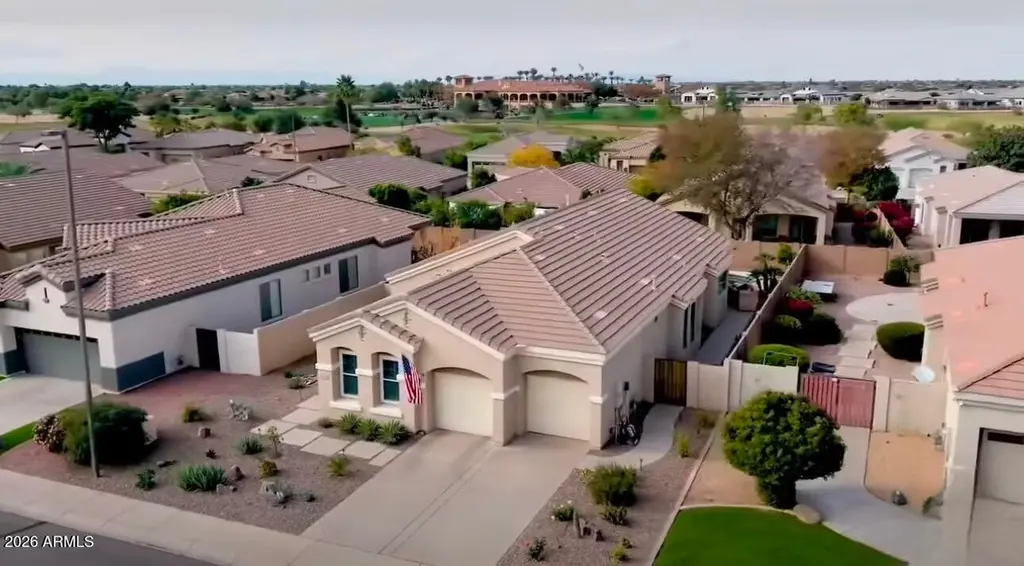
6816 S Pinehurst Dr · Gilbert, AZ
Flood risk 1/10 · Minimal
- FEMA flood zone
- X (shaded)
- Chance of flooding over 30 yrs
- 0.0%
- Est. flood insurance / yr
- $507 – $1,088
Fire risk 6/10 · Moderate
- Est. fire insurance / yr
- $610 – $1,132
Heat risk 9/10 · Severe
- Hot days now (above 111°F)
- 7 days/yr
- Hot days in 30 yrs
- 18 days/yr
Wind risk 1/10 · Minimal
- Chance of severe wind over 30 yrs
- —
Air-quality risk 2/10 · Minimal
- Unhealthy air days now
- 0 days/yr
- Unhealthy air days in 30 yrs
- 1 days/yr
Risk factors via First Street. Map © Google.
Why this score? — see what drove the D grade
The composite is a weighted blend of 9 inputs, each scored 0–100. Each bar is that input's sub-score; the figure is the points it added to the 100-point composite (weight × sub-score).
- Appreciation +9.2/10.0
- ARV discount +8.8/15.0
- Cash flow +6.8/30.0
- Schools +4.8/10.0
- Livability +4.4/5.0
- Rent growth +3.6/5.0
- Condition / age +2.5/5.0
- DSCR +1.0/10.0
- 1% rule +0.8/10.0
$569,000
🖨 Deal sheet (PDF) 📄 Offer letter ✓ Due diligence
Listing remarks MLS
Awarded February's ''Best Home on Tour'' by Fairway Mortgage. Fall in love with this gorgeous home in the desirable Golf & Resort Community of Seville! Features updated landscaping & inviting front porch. Bright living room new w/ full wall-mounted fireplace. Upgrades throughout include new flooring, interior paint, dual pane windows & plantation shutters. Kitchen boasts SS appliances, ample cabinets, desk area, granite counters, kitchen island, breakfast bar & bay window dining. Primary suite w/ patio access, ensuite & walk-in closet. Open den/office could easily be turned into a third bedroom or dining room. Backyard w/ 2 covered patios, built-in BBQ & well-maintained pool.
Key facts
- Fresh paint
- Plantation shutters
- Ss appliances
Tags
Neighborhood map
What this means for you Summary
Snapshot
- This is a 2-bed/4.0-bath single-family listed at $569k.
Deal economics
- At list price, monthly cash flow is $-889 ($-11k/yr) — negative.
- To cash-flow at today's rent, offer at most $412k (27.6% below list).
- To meet the 1% rule (rent ≥ 1% of price), the offer needs to be $328k (42.4% below list).
- Recommended offer: $328k (42.4% below list) — sets the bar for 1% rule.
- Cap rate 4.4% vs local median 3.2% in Gilbert — top-decile yield for the area; either an underpriced asset or a hidden risk that comps aren't pricing in. Stress-test before assuming the spread holds.
Location & tenants
- Location reads 87/100 on livability (#1 in AZ, #240 nationally) — a professional / high-income tenant draw. Strengths: amenities A+, employment A+, housing A+; Watch: health & safety C-, cost of living F.
- Chandler Unified District #80 (4242) (suburban): math 49% / reading 57% proficiency, ranked #31 of 249 in AZ (top 12%) — acceptable for families but not a draw, mixed tenant base, ~2y average lease.
- Zoned schools: Riggs Elementary (math 56% / reading 63%, grade B-, #148 of 1,109 statewide, top 15%, 833 students, 12% FRL); Arizona College Prep Middle School (math 88% / reading 87%, grade A+, #1 of 218 statewide, top 0%, 744 students, 4% FRL); Dr. Camille Casteel High School (math 45% / reading 53%, grade D, #43 of 381 statewide, top 11%, 3,140 students, 12% FRL) — zoned schools average 9% FRL vs 25% district-wide (16 pts lower); this property's tenant base skews higher-income than the district average.
- Zoned-school proficiency averages 65% at this address vs 53% district-wide (+12 pts) — the actual schools serving this property are materially stronger than the Chandler Unified District #80 (4242) average implies; a family-tenant draw the district grade alone would hide.
- Market conditions: Rents rising fast (+4.3%/yr); 339 active listings in the ZIP; 14 comparable units currently listed for rent nearby; rentals at typical pace (median 27d on market — plan ~3-4 weeks tenant-placement turnaround); high-income renter base; 36,011 units permitted in Maricopa County in 2024 (12,801 in 5+ unit buildings).
Forward outlook
- In year one you build about $52k of equity ($4k loan paydown + $48k appreciation (8.4% local appreciation)).
- Maricopa County population projected at +38% by 2050 — long-run rental-demand tailwind backs the buy-and-hold thesis.
- By year 2, paydown + projected appreciation supports a ~$83k cash-out refi (75% LTV) — recoverable capital for the next deal without selling this one.
Negotiation context
- It's been on market 159 days — a 12% lower offer ($501k) is reasonable based on typical stale-listing flexibility.
- 8 sale attempts since 23y ago; this cycle's ask has dropped $46k (7%) from the opening price — seller is motivated, your offer sets the floor, not the list.
- Current owner paid $395k; 44% above their basis — modest negotiation headroom, anchor on the comps not their cost.
Risks & watch-outs
- Climate carrying-cost: major wildfire risk; extreme-heat days projected 7→18/yr by 2055 (HVAC capex compounding) — expect insurance premiums to compound above CPI over the hold.
Questions for the listing agent
- What do current leases actually rent for vs. the listed asking? Can we see a recent rent roll and the last 12 months of T-12 income?
- It's been on market 159 days. Have you received any prior offers? Is the seller open to a 42% concession, seller financing, or rate buy-down credit?
- What does the HOA fee cover, when was the last increase, and are there any pending special assessments or reserve-fund shortfalls?
- Why hasn't it sold? Are there any deal-killer items the seller is aware of (foundation, flood, title, zoning, code violations)?
- Is there a deadline driving the sale (1031 exchange, divorce, estate, relocation)? That informs how much negotiation room exists.
- Schools are A-rated — typically a magnet for longer-tenancy family renters. What's the average tenant stay here, and is there a school-zone premium baked into asking?
- The area grade is low — what's the realistic commute time and amenity access for the typical tenant pool here? Any planned neighborhood developments (good or bad) we should know about?
- What's the average days-on-market for RENTAL listings here right now (not sales)? A rising rental-DOM trend means longer vacancies and softer asking-rent achievability than the comps imply.
- What's the recent tenant-quality profile in this submarket — average credit score on applications, eviction rate, late-payment / NSF rate, and stable-employment percentage? A property-management company in the area should have these aggregated.
- How much new for-sale + rental construction is in the pipeline within 1–3 miles? Heavy new supply typically softens prices + rents 12–24 months out; constrained supply supports both.
Investment metrics
- 1% rule
- 0.58% ✗
- Cap rate
- 4.42%
- Cash-on-cash
- -6.70%
- DSCR
- 0.70
- GRM
- 14.5
CMA / ARV
- ARV (median comp)
- $586,215
- List price
- $569,000
- Delta
- -2.94%
- Verdict
- FAIR
- Comps
- 20 within 1.0 mi
Show comp detail 12 sales within ~0.75 mi
| Address | Dist | Beds/Ba | Sqft | Sold | Price | $/sf | Match |
|---|---|---|---|---|---|---|---|
| 6823 S Pinehurst Dr | 0.03mi | 2/2.5 | 1,764 (0%) | 1mo | $485,000 | $275 | 92 |
| 6774 S Pinehurst Dr | 0.08mi | 2/2.5 | 1,764 (0%) | 14mo | $525,000 | $298 | 78 |
| 6762 S St Andrews Way | 0.07mi | 3/2.0 (+1) | 1,764 (0%) | 7mo | $535,000 | $303 | 78 |
| 6637 S Cartier Dr | 0.27mi | 3/2.0 (+1) | 1,665 (-6%) | 1mo | $515,000 | $309 | 64 |
| 4185 E Killarney St | 0.14mi | 3/3.0 (+1) | 2,020 (+14%) | 6mo | $542,500 | $269 | 55 |
| 6688 S Cartier Dr | 0.22mi | 3/2.0 (+1) | 1,665 (-6%) | 14mo | $540,000 | $324 | 55 |
| 7015 S Stadium Ct | 0.54mi | 3/2.0 (+1) | 1,750 (-1%) | 13mo | $602,000 | $344 | 50 |
| 6579 S Classic Way | 0.35mi | 3/2.0 (+1) | 1,623 (-8%) | 14mo | $589,000 | $363 | 45 |
| 6337 S Blake St | 0.66mi | 3/2.5 (+1) | 1,899 (+8%) | 2mo | $435,000 | $229 | 43 |
| 6497 S Twilight Ct | 0.69mi | 3/2.0 (+1) | 1,752 (-1%) | 13mo | $462,000 | $264 | 43 |
| 6508 S Twilight Ct | 0.71mi | 3/1.5 (+1) | 1,693 (-4%) | 7mo | $420,000 | $248 | 40 |
| 18132 E Vencino St | 0.66mi | 3/2.0 (+1) | 2,000 (+13%) | 11mo | $950,000 | $475 | 24 |
Match score weights: distance 35% · size 25% · config 20% · recency 20%. Top-matched comps best support the ARV.
Projected returns pro-forma
8.36% appreciation · 4.31% rent growth · sell at horizon
- IRR
- 16.1%
- Equity multiple
- 2.23×
- Total profit
- $195,181
- Equity at exit
- $446,409
- IRR
- 15.8%
- Equity multiple
- 4.88×
- Total profit
- $618,284
- Equity at exit
- $899,938
Cash invested: $159,320 (down + closing). Projections, not guarantees.
Landlord ↔ Tenant lean methodology
- Overall (STATE)
- 87 Strongly Landlord-Friendly
- State Arizona
- 87 Strongly Landlord-Friendly · R+3
- County
- — inherits STATE
- City
- — inherits STATE
ZIP-level market 85298
- Home prices YoY
- 2.5%
- Rents YoY
- 4.3%
- Active inventory
- 339
- Price-to-rent
- 14.5×
Monthly cashflow live
- Estimated rent
- $3,278 high interval (Pro) →
- Mortgage (P&I)
- −$2,984
- Tax from tax record
- −$152 /mo · $1,826/yr
- Insurance
- −$237
- HOA
- −$106
- Lot rent
- −$0
- Vacancy / Maint / Mgmt
- −$688
- Net cashflow
- $-889
Break-even live
Sensitivity live
| Price | -10% $-567 | -5% $-728 | +0% $-889 | +5% $-1,050 | +10% $-1,211 |
|---|---|---|---|---|---|
| Rent | -10% $-1,148 | -5% $-1,019 | +0% $-889 | +5% $-760 | +10% $-630 |
| Rate | -1.0pp $-603 | -0.5pp $-745 | base $-889 | +0.5pp $-1,037 | +1.0pp $-1,187 |
UW: 25.0% down · 7.5% · 30yr · 1.5% tax · 5.0% vac · 8.0% maint · 8.0% mgmt
Financing live
Cash to close
- Down payment
- $142,250
- Closing costs
- $17,070
- Reserves months
- —
- Total cash needed
- —
Loan-product check · same deal, 3 products live
Conventional
25% down · 7.5% · 30yr
- Down + closing
- —
- Monthly P&I
- —
- Monthly cashflow
- —
- DSCR
- —
- Eligible?
- —
Personal DTI + credit; lowest rate.
DSCR
20% down · 8.5% · 30yr
- Down + closing
- —
- Monthly P&I
- —
- Monthly cashflow
- —
- DSCR
- —
- Eligible?
- —
No personal income docs; deal must DSCR.
Hard money
10% down · 12.0% · 12mo
- Down + closing
- —
- Monthly P&I
- —
- Monthly cashflow
- —
- DSCR
- —
- Eligible?
- —
Short-term bridge; refi at stabilization.
Rent comps 14 comps
| Address | Beds | Baths | Sqft | Rent | $/sqft | DOM | Units | Dist |
|---|---|---|---|---|---|---|---|---|
| 6686 S St Andrews Way Gilbert, AZ | 2.0 | 2.5 | 1764 | $5,100 | $2.89 | 46d | 1 | 0.18mi |
| 6659 S Cartier Dr Gilbert, AZ | 3.0 | 2.0 | 1665 | $2,300 | $1.38 | 20d | 1 | 0.27mi |
| 6687 S Classic Way Gilbert, AZ | 3.0 | 2.0 | 2173 | $4,300 | $1.98 | 3d | 1 | 0.28mi |
| 3725 E Meadowview Dr Gilbert, AZ | 3.0 | 2.0 | 1404 | $2,750 | $1.96 | 26d | 1 | 0.65mi |
| 6334 S Blake St Gilbert, AZ | 3.0 | 2.0 | 1421 | $2,100 | $1.48 | 46d | 1 | 0.70mi |
| 3808 E Flower Ct Gilbert, AZ | 3.0 | 2.5 | 1628 | $2,095 | $1.29 | 7d | 1 | 0.72mi |
| 3868 E Palmer St Gilbert, AZ | 3.0 | 2.5 | 1899 | $2,000 | $1.05 | 46d | 1 | 0.74mi |
| 3560 E Merlot St Gilbert, AZ | 3.0 | 2.0 | 1777 | $4,750 | $2.67 | 46d | 1 | 0.81mi |
| 3443 E Riopelle Ave Gilbert, AZ | 3.0 | 2.0 | 1284 | $2,350 | $1.83 | 46d | 1 | 0.89mi |
| 3462 E Powell Way Gilbert, AZ | 3.0 | 2.0 | 1665 | $2,295 | $1.38 | 26d | 1 | 1.17mi |
| 3147 E Vallejo Dr Gilbert, AZ | 3.0 | 2.0 | 2171 | $2,350 | $1.08 | 19d | 1 | 1.26mi |
| 3329 E Powell Ct Gilbert, AZ | 3.0 | 2.0 | 1486 | $2,345 | $1.58 | 17d | 1 | 1.28mi |
| 3067 E Palmdale Ln Gilbert, AZ | 3.0 | 2.0 | 1675 | $2,300 | $1.37 | 17d | 1 | 1.39mi |
| 6770 S Tucana Ln Gilbert, AZ | 3.0 | 2.0 | 2070 | $4,500 | $2.17 | 26d | 1 | 1.45mi |
HOA detail
- Monthly dues
- $106 · $1,272/yr
- Likely covers
- landscapingpool
Listing history 32 events
-
2026-06-07status $569,000 Pending 159 DOM
-
2026-06-04days on market $569,000 Active 159 DOM
-
2026-06-03days on market $569,000 Active 158 DOM
-
2026-06-02days on market $569,000 Active 157 DOM
-
2026-06-01days on market $569,000 Active 156 DOM
-
2026-05-31days on market $569,000 Active 155 DOM
-
2026-04-22price $575,000 708-char remark
Show marketing remark (708 chars)
Awarded February's ''Best Home on Tour'' by Fairway Mortgage. Fall in love with this gorgeous home in the desirable Golf & Resort Community of Seville! Features updated landscaping & inviting front porch. Bright living room new w/ full wall-mounted fireplace. Upgrades throughout include new flooring, interior paint, dual pane windows & plantation shutters. Kitchen boasts SS appliances, ample cabinets, desk area, granite counters, kitchen island, breakfast bar & bay window dining. Primary suite w/ patio access, ensuite & walk-in closet. Open den/office could easily be turned into a third bedroom or dining room. Backyard w/ 2 covered patios, built-in BBQ & well-maintained pool.
-
2026-02-28price $580,000 708-char remark
Show marketing remark (708 chars)
Awarded February's ''Best Home on Tour'' by Fairway Mortgage. Fall in love with this gorgeous home in the desirable Golf & Resort Community of Seville! Features updated landscaping & inviting front porch. Bright living room new w/ full wall-mounted fireplace. Upgrades throughout include new flooring, interior paint, dual pane windows & plantation shutters. Kitchen boasts SS appliances, ample cabinets, desk area, granite counters, kitchen island, breakfast bar & bay window dining. Primary suite w/ patio access, ensuite & walk-in closet. Open den/office could easily be turned into a third bedroom or dining room. Backyard w/ 2 covered patios, built-in BBQ & well-maintained pool.
-
2025-12-27$615,000 Active 708-char remark
Show marketing remark (708 chars)
Awarded February's ''Best Home on Tour'' by Fairway Mortgage. Fall in love with this gorgeous home in the desirable Golf & Resort Community of Seville! Features updated landscaping & inviting front porch. Bright living room new w/ full wall-mounted fireplace. Upgrades throughout include new flooring, interior paint, dual pane windows & plantation shutters. Kitchen boasts SS appliances, ample cabinets, desk area, granite counters, kitchen island, breakfast bar & bay window dining. Primary suite w/ patio access, ensuite & walk-in closet. Open den/office could easily be turned into a third bedroom or dining room. Backyard w/ 2 covered patios, built-in BBQ & well-maintained pool.
-
2022-01-09status Pending
-
2022-01-06$529,000 Active
-
2021-01-05soldstatus $395,000 Closed
-
2021-01-05soldstatus $395,000
-
2020-11-11historical Under Contract Accepting Backups
-
2020-11-10$394,500 Active
-
2010-01-21soldstatus $160,000
-
2010-01-20soldstatus $160,000
-
2009-05-31historical
-
2009-03-12$195,000
-
2008-02-01soldstatus $295,000
-
2008-02-01soldstatus $295,000
-
2008-01-31historical
-
2008-01-03$300,000
-
2007-12-26historical
-
2007-07-27$319,000
-
2007-02-15soldstatus $320,000
-
2007-02-08soldstatus $320,000
-
2006-12-12historical
-
2006-04-18$340,000
-
2003-08-05soldstatus $210,730
-
2003-07-25historical
-
2003-05-27$212,481
ⓘ Source: listings_history table (triggers on properties + properties_extension) + one-shot
backfill from property_details.listing_events for pre-trigger history.
Tax reassessment forecast AZ · Resets to sale price
- Current annual tax
- $1,826 · $152/mo
- Projected year-2 tax
- $3,755 · $313/mo
- Expected delta
- +$1,930/yr (+$161/mo · 105.7%)
ⓘ Screening estimate from a state-policy table — verify with the county assessor before closing.
Climate risk First Street
- Flood 1/10 Low FEMA zone X (shaded) · 0% chance over 30 yrs
- Wildfire 6/10 Major
- Heat 9/10 Extreme 7 d/yr ≥111°F today · 18 d/yr by 30 yrs out
- Wind 1/10 Low
- Air quality 2/10 Low 0 unhealthy d/yr today · 1 by 30 yrs out
Nearby sold comps map
Loading sold comps map…
Walkable amenities ~0.75 mi
Loading nearby amenities…
Taxation est. · year 1
- Rental income
- $39,339
- − Mortgage interest
- −$31,873
- − Property taxes
- −$1,826
- − Insurance
- −$2,845
- − Repairs & maintenance
- −$3,147
- − Management
- −$3,147
- − HOA
- −$1,272
- − Depreciation
- −$16,553
- Taxable loss
- −$21,323
- Est. tax savings @ 24.0%
- +$5,118
- After-tax cash flow
- $-5,554/yr
For passive investors: Depreciation is non-cash, so a rental often shows a tax loss while cash-flowing — sheltering income. Rental losses are passive: they offset passive income freely, and up to $25,000/yr can offset ordinary (W-2) income if you actively participate and your MAGI is under $100k (phasing out to $0 by $150k); unused losses carry forward. On sale, claimed depreciation is recaptured at up to 25%, and gains may owe capital-gains tax (a 1031 exchange can defer both). Figures are a year-1 estimate at your 24.0% rate — not tax advice; consult a CPA.
Schools (NCES district)
- District
- Chandler Unified District #80 (4242)
- NCES district ID
- 0401870
- Math proficiency
- 49% ▼ -8.00%
- Reading proficiency
- 57% ▼ -2.00%
- Median HH income
- $74,048
- Composite
- 47.54/100
- National rank
- #2268
- State rank
- #31 of 249 in AZ
Livability — Gilbert
- Score
- 87/100
- State rank
- #1
- US rank
- #240
Category grades
Schools grade is shown separately in the Schools card above.
Census & demographics
- Census place
- Gilbert, AZ
- County
- Maricopa County · 4,537,380 people
- City population
- 281,769
- Metro
- Phoenix-Mesa-Chandler, AZ
- Population (ZIP)
- 44,114
- Household income
- $156,425
- Rent vs Own
- Severe rent burden
- 173.0
Population outlook (Maricopa County) Hauer SSP2
- Today (2025)
- 4,979,203 people
- By 2030
- 5,378,229 · +8.0%
- By 2040
- 6,156,598 · +23.6%
- By 2050
- 6,872,376 · +38.0%
- By 2075
- 8,401,270 · +68.7%
- By 2100
- 9,247,439 · +85.7%
Race, ethnicity, and origin ACS 2023
- Neighborhood character
- Predominantly White (72%)
- Race & ethnicity
- White 72% Hispanic / Latino 14% Two or more races 11% Asian 7% Black 2%
- Hispanic origin (detail)
- Mexican 10%
- Common ancestry
- Italian 4% Romanian 3% Lithuanian 3%
- Foreign-born
- 9% · Canada, China, Vietnam
- Languages at home
- 85% English-only · Spanish 7% Other Indo-European 2% Chinese 1%
Political lean MEDSL · Maricopa
- 2024 margin
- Toss-up / Even · D 47.7% · R 51.2% · Other 1.1%
- 2008→2024 swing
- +7.1pp toward D · 2008: -10.6pp · 2024: -3.5pp
- All cycles
- 2024: R+3.5 2020: D+2.2 2016: R+3.5 2012: R+12.0 2008: R+10.6
Not yet ingested
- Civics
- —
Market trends
- HPI YoY
- ▲ 8.36%
- Current HPI
- 343.6932
- Rent YoY
- ▲ 4.31%
- Metro
- Phoenix-Mesa-Chandler, AZ
- State GDP YoY
- ▲ 4.54%
- F500 in state
- 20
Industry mix (Fortune 500 HQ in AZ)
| Industry | F500 HQs | Revenue |
|---|---|---|
| Technology | 2 | $13B |
|
||
| Mining / Metals | 1 | $23B |
|
||
| Environmental Services | 1 | $16B |
|
||
| Metals / Steel | 1 | $14B |
|
||
| Technology Distribution | 1 | $9B |
|
||
| Homebuilding | 1 | $8B |
|
||
Price history
+170.6% since first listed26 events — show timeline
- 2026-04-22 Price Changed $575,000 ARMLS
- 2026-02-28 Price Changed $580,000 ARMLS
- 2025-12-27 Listed $615,000 ARMLS
- 2022-01-09 Pending — ARMLS
- 2022-01-06 Listed $529,000 ARMLS
- 2021-01-05 Sold (Public Records) $395,000 Public Records
- 2021-01-05 Sold (MLS) $395,000 ARMLS
- 2020-11-11 Contingent — ARMLS
- 2020-11-10 Listed $394,500 ARMLS
- 2010-01-21 Sold (MLS) $160,000 ARMLS
- 2010-01-20 Sold (Public Records) $160,000 Public Records
- 2009-05-31 Listing Removed — ARMLS
- 2009-03-12 Listed $195,000 ARMLS
- 2008-02-01 Sold (Public Records) $295,000 Public Records
- 2008-02-01 Sold (MLS) $295,000 ARMLS
- 2008-01-31 Listing Removed — ARMLS
- 2008-01-03 Listed $300,000 ARMLS
- 2007-12-26 Listing Removed — ARMLS
- 2007-07-27 Listed $319,000 ARMLS
- 2007-02-15 Sold (MLS) $320,000 ARMLS
- 2007-02-08 Sold (Public Records) $320,000 Public Records
- 2006-12-12 Listing Removed — ARMLS
- 2006-04-18 Listed $340,000 ARMLS
- 2003-08-05 Sold (MLS) $210,730 ARMLS
- 2003-07-25 Listing Removed — ARMLS
- 2003-05-27 Listed $212,481 ARMLS
Property tax history
+1.0%/yrLatest (2025): $1,826 · +1.3% YoY. Source: county tax records.
Cash-flow waterfall
monthlySold comps — $/sqft
last 12 mo · ≤1 miLoading sold comps…