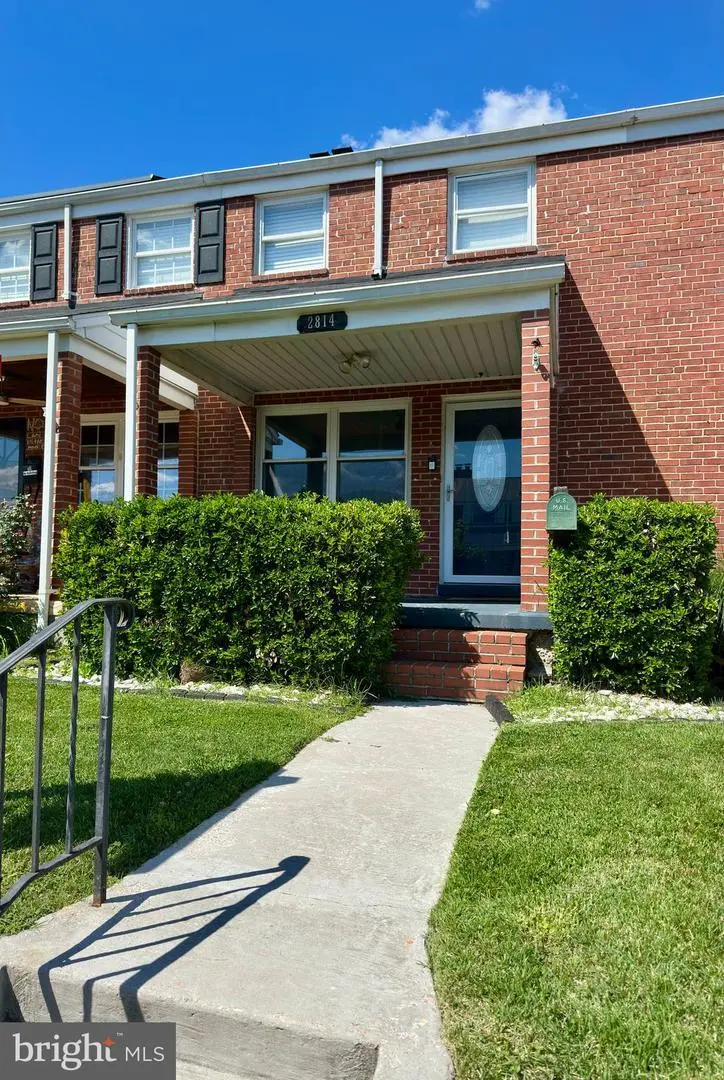
2814 Moorgate Rd · Dundalk, MD
Flood risk 1/10 · Minimal
- FEMA flood zone
- X (unshaded)
- Chance of flooding over 30 yrs
- 0.0%
- Est. flood insurance / yr
- $473 – $860
Fire risk 1/10 · Minimal
- Est. fire insurance / yr
- $755 – $1,403
Heat risk 8/10 · Major
- Hot days now (above 103°F)
- 7 days/yr
- Hot days in 30 yrs
- 15 days/yr
Wind risk 6/10 · Moderate
- Chance of severe wind over 30 yrs
- 63.0%
Air-quality risk 5/10 · Moderate
- Unhealthy air days now
- 6 days/yr
- Unhealthy air days in 30 yrs
- 8 days/yr
Risk factors via First Street. Map © Google.
Why this score? — see what drove the D grade
The composite is a weighted blend of 9 inputs, each scored 0–100. Each bar is that input's sub-score; the figure is the points it added to the 100-point composite (weight × sub-score).
- Cash flow +14.0/30.0
- ARV discount +8.1/15.0
- DSCR +4.3/10.0
- Livability +4.2/5.0
- 1% rule +3.5/10.0
- Rent growth +2.5/5.0
- Condition / age +2.5/5.0
- Schools +2.3/10.0
- Appreciation +0.0/10.0
$219,000
🖨 Deal sheet 📄 Offer letter ✓ Due diligence
Listing remarks
Welcome to this lovingly maintained townhome in the desirable Stanbrook community! Offering 2 bedrooms, 1 full bath, and 1 half bath, this home combines comfort, functionality, and beautiful surroundings. Enjoy views of the quarry from the inviting front porch before stepping inside to an open and airy main level featuring fresh paint and new carpet throughout. The updated kitchen is the heart of the home, boasting beautiful cabinetry, upgraded appliances, a center island with counter-height seating, and an open-concept layout perfect for everyday living and entertaining. Upstairs, you'll find two generously sized bedrooms and a well-appointed full bathroom. The finished lower level provide
Key facts
- Built 1954
- Listed 3 days
Property features AI
Finance
- Other: Above-grade finished area reported by assessor; Below-grade finished and unfinished areas reported by assessor
Exterior
- Parking: On-street parking
- Utilities: Public water; Public sewer
- Home design: Interior townhouse/rowhouse; Fee simple ownership; Located outside city limits; Ground rent paid annually
- Construction: Brick construction; Other foundation
- Exterior features: Above-grade and below-grade other structures
Interior
- Bedrooms: Two bedrooms on the first upper level
- Bathrooms: Two full bathrooms (one on upper level, one on lower level)
- Heating & cooling: Forced air heating (natural gas); Central air conditioning (electric); Natural gas hot water
- Interior features: Basement present (other type); Living area reported from assessor
Neighborhood map
What this means for you Summary
Snapshot
- This is a 2-bed/1.5-bath townhouse listed at $219k.
Deal economics
- At list price, monthly cash flow is $30 ($355/yr) — positive.
- The deal already cash-flows at list — no discount required.
- To meet the 1% rule (rent ≥ 1% of price), the offer needs to be $187k (14.7% below list).
- Recommended offer: $187k (14.7% below list) — sets the bar for 1% rule.
Location & tenants
- Location reads 85/100 on livability (#16 in MD, #510 nationally) — a professional / high-income tenant draw. Strengths: amenities A+, commute A+, housing A+; Watch: crime F.
- Baltimore County Public Schools (suburban): math 15% / reading 34% proficiency, ranked #11 of 24 in MD (top 46%) — low school quality limits family demand, transient renter base, plan for 1-2y turnover.
- Market conditions: Rents soft (-0.1%/yr); 236 active listings in the ZIP; 40 comparable units currently listed for rent nearby; rentals at typical pace (median 18d on market — plan ~3-4 weeks tenant-placement turnaround); 45% of comp listings sitting > 30 days — soft ceiling on asking rent; 1,511 units permitted in Baltimore County in 2024 (643 in 5+ unit buildings).
- This rent runs 35% of the median local income ($64k/yr) — at the standard rent-burdened threshold; future hikes will face affordability resistance.
Forward outlook
- Local home prices are declining (-3.0%/yr); year-one equity from $2k of loan paydown is wiped out by about $7k of value loss. Plan a longer hold.
- Baltimore County population projected at +12% by 2050 — modest demand growth; plan on rents tracking national, not racing it.
Negotiation context
- Only 3 days on market — expect competitive offers; lowballing is unlikely to land.
- 2 sale attempts since 29y ago; this cycle's ask is 174% above the opening price — seller raised mid-cycle; expect resistance to lowballs.
- Current owner paid $80k; list at $219k implies a 174% gain — meaningful room to come down on a strong offer.
Risks & watch-outs
- Watch-outs: built in 1954 — expect roof / HVAC / electrical / plumbing capex.
- Climate carrying-cost: major wind risk, 63% chance of damaging wind over 30y; extreme-heat days projected 7→15/yr by 2055 (HVAC capex compounding) — expect insurance premiums to compound above CPI over the hold.
Questions for the listing agent
- Built in 1954 — when were the roof, HVAC, electrical panel, plumbing, and water heater last replaced?
- Is there a deadline driving the sale (1031 exchange, divorce, estate, relocation)? That informs how much negotiation room exists.
- Schools are A-rated — typically a magnet for longer-tenancy family renters. What's the average tenant stay here, and is there a school-zone premium baked into asking?
- Crime grade is F in this area — have there been break-ins, vandalism, or insurance claims at this property in the last 3 years? What carrier currently insures it and at what premium?
- The area grade is low — what's the realistic commute time and amenity access for the typical tenant pool here? Any planned neighborhood developments (good or bad) we should know about?
- What's the average days-on-market for RENTAL listings here right now (not sales)? A rising rental-DOM trend means longer vacancies and softer asking-rent achievability than the comps imply.
- What's the recent tenant-quality profile in this submarket — average credit score on applications, eviction rate, late-payment / NSF rate, and stable-employment percentage? A property-management company in the area should have these aggregated.
- How much new for-sale + rental construction is in the pipeline within 1–3 miles? Heavy new supply typically softens prices + rents 12–24 months out; constrained supply supports both.
Investment metrics
- 1% rule
- 0.85% ✗
- Cap rate
- 6.45%
- Cash-on-cash
- 0.58%
- DSCR
- 1.03
- GRM
- 9.8
CMA / ARV
- ARV (on-the-fly)
- $221,788
- Comps found
- 12
Show comp detail 12 sales within ~0.75 mi
| Address | Dist | Beds/Ba | Sqft | Sold | Price | $/sf | Match |
|---|---|---|---|---|---|---|---|
| 2782 Moorgate Rd | 0.05mi | 3/1.5 (+1) | 1,260 (+1%) | 2mo | $259,000 | $206 | 89 |
| 1950 Denbury Dr | 0.14mi | 3/2.0 (+1) | 1,216 (-2%) | 1mo | $259,900 | $214 | 82 |
| 2735 Moorgate Rd | 0.11mi | 3/1.5 (+1) | 1,294 (+4%) | 7mo | $230,000 | $178 | 78 |
| 7829 Scholar Rd | 0.21mi | 3/2.0 (+1) | 1,152 (-8%) | 2mo | $252,500 | $219 | 69 |
| 7832 Rockbourne Rd | 0.27mi | 3/1.5 (+1) | 1,344 (+8%) | 3mo | $167,832 | $125 | 67 |
| 1927 Eastfield | 0.52mi | 3/1.5 (+1) | 1,239 (-1%) | 7mo | $220,000 | $178 | 64 |
| 7830 Harold Rd | 0.40mi | 3/1.5 (+1) | 1,272 (+2%) | 11mo | $230,000 | $181 | 64 |
| 2302 Searles Rd | 0.13mi | 3/1.5 (+1) | 1,382 (+11%) | 11mo | $227,000 | $164 | 62 |
| 2930 Sollers Point Rd | 0.64mi | 2/2.0 | 1,254 (+1%) | 8mo | $160,000 | $128 | 60 |
| 1927 Codd Ave | 0.52mi | 3/1.0 (+1) | 1,144 (-8%) | 8mo | $190,000 | $166 | 49 |
| 1946 Eastfield Rd | 0.50mi | 3/1.5 (+1) | 1,106 (-11%) | 11mo | $202,500 | $183 | 44 |
| 7545 Ives Ln | 0.75mi | 3/1.0 (+1) | 1,144 (-8%) | 7mo | $159,000 | $139 | 39 |
Match score weights: distance 35% · size 25% · config 20% · recency 20%. Top-matched comps best support the ARV.
Projected returns pro-forma
-3.0% appreciation · 0.0% rent growth · sell at horizon
- IRR
- -18.7%
- Equity multiple
- 0.36×
- Total profit
- $-39,089
- Equity at exit
- $32,654
- IRR
- -18.3%
- Equity multiple
- 0.14×
- Total profit
- $-52,814
- Equity at exit
- $18,935
Cash invested: $61,320 (down + closing). Projections, not guarantees.
Landlord ↔ Tenant lean methodology
- Overall (STATE)
- 27 Tenant-Leaning
- State Maryland
- 27 Tenant-Leaning · D+14
- County
- — inherits STATE
- City
- — inherits STATE
ZIP-level market 21222
- Rents YoY
- -0.1%
- Active inventory
- 236
- Price-to-rent
- 9.8×
Monthly cashflow live
- Estimated rent
- $1,867 high interval (Pro) →
- Mortgage (P&I)
- −$1,148
- Tax from tax record
- −$206 /mo · $2,469/yr
- Insurance
- −$91
- HOA
- −$0
- Vacancy / Maint / Mgmt
- −$392
- Net cashflow
- $30
Break-even live
UW: 25.0% down · 7.5% · 30yr · 1.5% tax · 5.0% vac · 8.0% maint · 8.0% mgmt
Financing live
Cash to close
- Down payment
- $54,750
- Closing costs
- $6,570
- Reserves months
- —
- Total cash needed
- —
Loan-product check · same deal, 3 products live
Conventional
25% down · 7.5% · 30yr
- Down + closing
- —
- Monthly P&I
- —
- Monthly cashflow
- —
- DSCR
- —
- Eligible?
- —
Personal DTI + credit; lowest rate.
DSCR
20% down · 8.5% · 30yr
- Down + closing
- —
- Monthly P&I
- —
- Monthly cashflow
- —
- DSCR
- —
- Eligible?
- —
No personal income docs; deal must DSCR.
Hard money
10% down · 12.0% · 12mo
- Down + closing
- —
- Monthly P&I
- —
- Monthly cashflow
- —
- DSCR
- —
- Eligible?
- —
Short-term bridge; refi at stabilization.
Rent comps 40 comps
| Address | Beds | Baths | Sqft | Rent | $/sqft | DOM | Units | Dist |
|---|---|---|---|---|---|---|---|---|
| 1915 Merritt Blvd Dundalk, MD | 3.0 | 2.0 | 1208 | $2,500 | $2.07 | 43d | 1 | 0.22mi |
| 7901 Stratman Rd Dundalk, MD | 3.0 | 1.0 | 890 | $1,647 | $1.85 | 2d | 1 | 0.31mi |
| 7930 Kavanagh Rd Dundalk, MD | 3.0 | 1.0 | 1024 | $2,195 | $2.14 | 43d | 1 | 0.47mi |
| 2020 Dineen Dr Dundalk, MD | 3.0 | 1.5 | 1258 | $1,850 | $1.47 | 4d | 1 | 0.48mi |
| 7962 Kavanagh Rd Dundalk, MD | 3.0 | 2.0 | 1024 | $1,947 | $1.90 | 14d | 1 | 0.52mi |
| 7917 Wise Ave Dundalk, MD | 2.0 | 1.5 | 1500 | $2,500 | $1.67 | 23d | 1 | 0.55mi |
| 1930 Frames Rd Dundalk, MD | 3.0 | 2.0 | 1152 | $2,099 | $1.82 | 4d | 1 | 0.64mi |
| 2936 Yorkway #2 Dundalk, MD | 1.0 | 1.0 | 1254 | $950 | $0.76 | 12d | 1 | 0.69mi |
| 2907 Cornwall Rd Unit Road2nd Dundalk, MD | 1.0 | 1.0 | 750 | $950 | $1.27 | 17d | 1 | 0.72mi |
| 2939 Cornwall Rd Unit C Dundalk, MD | 1.0 | 1.0 | 700 | $900 | $1.29 | 43d | 1 | 0.72mi |
| 2976 Cornwall Rd Unit 1 Dundalk, MD | 2.0 | 1.0 | 900 | $1,590 | $1.77 | 14d | 1 | 0.76mi |
| 2959 Liberty Pkwy Dundalk, MD | 3.0 | 2.0 | 1479 | $2,150 | $1.45 | 43d | 1 | 0.79mi |
| 414 Westfield Rd Dundalk, MD | 3.0 | 1.0 | 1024 | $2,300 | $2.25 | 43d | 1 | 0.80mi |
| 2032 Kelmore Rd Dundalk, MD | 3.0 | 1.0 | 1024 | $1,700 | $1.66 | 43d | 1 | 0.81mi |
| 1925 Jasmine Rd Dundalk, MD | 3.0 | 1.5 | 1024 | $1,825 | $1.78 | 10d | 1 | 0.82mi |
| 2025 Kelmore Rd Unit 1 Dundalk, MD | 3.0 | 1.0 | 1024 | $2,000 | $1.95 | 43d | 1 | 0.84mi |
| 2624 Liberty Pkwy Dundalk, MD | 3.0 | 1.5 | 1110 | $1,856 | $1.67 | 43d | 1 | 0.84mi |
| 7508 Ives Ln Dundalk, MD | 2.0 | 1.0 | 896 | $1,750 | $1.95 | 43d | 1 | 0.85mi |
| 2004 Larkhall Rd Dundalk, MD | 3.0 | 1.0 | 1024 | $1,500 | $1.46 | 43d | 1 | 0.87mi |
| 7003 Dunmanway Dundalk, MD | 1.0–2.0 | 1.0 | 772 | $1,345 | $1.74 | 1d | 13 | 0.91mi |
| 7718 Meath Rd Dundalk, MD | 3.0 | 2.0 | 864 | $2,200 | $2.55 | 43d | 1 | 0.92mi |
| 12 Leeway Dundalk, MD | 3.0 | 1.0 | 1358 | $1,750 | $1.29 | 43d | 1 | 0.94mi |
| 3503 Sollers Point Rd Dundalk, MD | 3.0 | 1.0 | 776 | $1,850 | $2.38 | 12d | 1 | 0.98mi |
| 8146 Del Haven Rd Dundalk, MD | 3.0 | 2.0 | 1424 | $2,700 | $1.90 | 16d | 1 | 0.99mi |
| 8499 Lynch Rd Dundalk, MD | 1.0–3.0 | 1.0–2.0 | 950 | $1,720 | $1.81 | 1d | 32 | 1.05mi |
| 3 Center Pl Unit 2 Dundalk, MD | 1.0 | 1.0 | 700 | $1,250 | $1.79 | 43d | 1 | 1.07mi |
| 1610 Melbourne Rd Dundalk, MD | 1.0–2.0 | 1.0 | 664 | $1,240 | $1.87 | 12d | 1 | 1.11mi |
| 3443 Dunhaven Rd Dundalk, MD | 2.0 | 2.0 | 1016 | $1,900 | $1.87 | 4d | 1 | 1.11mi |
| 3481 McShane Way Dundalk, MD | 2.0 | 1.5 | 896 | $2,150 | $2.40 | 43d | 1 | 1.13mi |
| 8220 Cornwall Rd Dundalk, MD | 3.0 | 2.0 | 1125 | $1,775 | $1.58 | 43d | 1 | 1.17mi |
| 311 Wise Ave Dundalk, MD | 1.0 | 1.0 | 818 | $1,045 | $1.28 | 43d | 1 | 1.19mi |
| 1955 Walnut Ave Dundalk, MD | 3.0 | 1.0 | 950 | $2,300 | $2.42 | 43d | 1 | 1.20mi |
| 11 Seabright Ave Dundalk, MD | 3.0 | 1.0 | 948 | $1,874 | $1.98 | 14d | 1 | 1.22mi |
| 3000 Wallford Dr Dundalk, MD | 1.0–2.0 | 1.0 | 717 | $1,330 | $1.85 | 2d | 35 | 1.22mi |
| 108 Chestnut St Dundalk, MD | 2.0 | 1.0 | 812 | $1,300 | $1.60 | 16d | 1 | 1.32mi |
| 849 Loalan Ave Dundalk, MD | 3.0 | 1.5 | 1024 | $1,850 | $1.81 | 14d | 1 | 1.35mi |
| 3221 Wallford Dr Dundalk, MD | 3.0 | 1.0 | 1008 | $1,750 | $1.74 | 3d | 1 | 1.39mi |
| 3221 Wallford Dr Unit 3221 Dundalk, MD | 3.0 | 1.0 | 1008 | $1,750 | $1.74 | 4d | 1 | 1.39mi |
| 2125 Cameron Dr Dundalk, MD | 1.0–2.0 | 1.0 | 697 | $1,350 | $1.94 | 43d | 9 | 1.40mi |
| 266 Saint Helena Ave Dundalk, MD | 3.0 | 1.0 | 1305 | $1,900 | $1.46 | 12d | 1 | 1.40mi |
Listing history 11 events
-
2026-06-18days on market $219,000 Active 3 DOM
-
2026-06-17days on market $219,000 Active 2 DOM
-
2026-06-16statusdays on market $219,000 Active 1 DOM
-
2026-06-15days on market $219,000 Coming Soon 13 DOM
-
2026-06-13days on market $219,000 Coming Soon 11 DOM
-
2026-06-09days on market $219,000 Coming Soon 7 DOM
-
2026-06-08days on market $219,000 Coming Soon 6 DOM
-
2026-06-07days on market $219,000 Coming Soon 5 DOM
-
2026-06-04days on market $219,000 Coming Soon 2 DOM
-
2026-06-03remarks 699-char remark
-
2026-06-03$219,000 Coming Soon 1 DOM
ⓘ Source: listings_history table (triggers on properties + properties_extension) + one-shot
backfill from property_details.listing_events for pre-trigger history.
Tax reassessment forecast MD · Partial reset (capped growth)
- Current annual tax
- $2,469 · $206/mo
- Projected year-2 tax
- $2,469 · $206/mo
- Expected delta
- $0/yr ($0/mo · 0.0%)
ⓘ Screening estimate from a state-policy table — verify with the county assessor before closing.
Climate risk First Street
- Flood 1/10 Low FEMA zone X (unshaded) · 0% chance over 30 yrs
- Wildfire 1/10 Low
- Heat 8/10 Severe 7 d/yr ≥103°F today · 15 d/yr by 30 yrs out
- Wind 6/10 Major 63% chance of damaging wind over 30 yrs
- Air quality 5/10 Major 6 unhealthy d/yr today · 8 by 30 yrs out
Nearby sold comps map
Loading sold comps map…
Walkable amenities ~0.75 mi
Loading nearby amenities…
Taxation est. · year 1
- Rental income
- $22,406
- − Mortgage interest
- −$12,267
- − Property taxes
- −$2,469
- − Insurance
- −$1,095
- − Repairs & maintenance
- −$1,792
- − Management
- −$1,792
- − Depreciation
- −$6,371
- Taxable loss
- −$3,382
- Est. tax savings @ 24.0%
- +$812
- After-tax cash flow
- $1,166/yr
For passive investors: Depreciation is non-cash, so a rental often shows a tax loss while cash-flowing — sheltering income. Rental losses are passive: they offset passive income freely, and up to $25,000/yr can offset ordinary (W-2) income if you actively participate and your MAGI is under $100k (phasing out to $0 by $150k); unused losses carry forward. On sale, claimed depreciation is recaptured at up to 25%, and gains may owe capital-gains tax (a 1031 exchange can defer both). Figures are a year-1 estimate at your 24.0% rate — not tax advice; consult a CPA.
Schools (NCES district)
- District
- Baltimore County Public Schools
- NCES district ID
- 2400120
- Math proficiency
- 15% ▼ -16.00%
- Reading proficiency
- 34% ▼ -5.00%
- Median HH income
- $66,746
- Composite
- 23.17/100
- National rank
- #7948
- State rank
- #11 of 24 in MD
Livability — Dundalk
- Score
- 85/100
- State rank
- #16
- US rank
- #510
Category grades
Schools grade is shown separately in the Schools card above.
Census & demographics
- Census place
- Dundalk, MD
- County
- Baltimore County · 769,527 people
- City population
- 59,407
- Metro
- Baltimore-Columbia-Towson, MD
- Population (ZIP)
- 59,407
- Household income
- $64,141
- Rent vs Own
- Severe rent burden
- 2566.0
Population outlook (Baltimore County) Hauer SSP2
- Today (2025)
- 885,518 people
- By 2030
- 909,272 · +2.7%
- By 2040
- 951,547 · +7.5%
- By 2050
- 990,955 · +11.9%
- By 2075
- 1,086,411 · +22.7%
- By 2100
- 1,135,078 · +28.2%
Race, ethnicity, and origin ACS 2023
- Neighborhood character
- Diverse neighborhood (Simpson 0.60)
- Race & ethnicity
- White 59% Black 18% Hispanic / Latino 15% Two or more races 7% Asian 2% Native American 1%
- Hispanic origin (detail)
- Mexican 3% Puerto Rican 2%
- Common ancestry
- Romanian 7% Lithuanian 1% Italian 1%
- Foreign-born
- 9% · Canada
- Languages at home
- 85% English-only · Spanish 11% Other Indo-European 2% Arabic 1%
Political lean MEDSL · Baltimore
- 2024 margin
- Strong D (+24.5) · D 61.0% · R 36.5% · Other 2.5%
- 2008→2024 swing
- +9.9pp toward D · 2008: 14.6pp · 2024: 24.5pp
- All cycles
- 2024: D+24.5 2020: D+27.0 2016: D+17.4 2012: D+16.4 2008: D+14.6
Not yet ingested
- Civics
- —
Market trends
- HPI YoY
- ▼ -251.44%
- Current HPI
- 228.4218
- Rent YoY
- ▼ -0.09%
- Metro
- Baltimore-Columbia-Towson, MD
- State GDP YoY
- ▲ 2.97%
- F500 in state
- 12
Industry mix (Fortune 500 HQ in MD)
| Industry | F500 HQs | Revenue |
|---|---|---|
| Aerospace / Defense | 1 | $71B |
|
||
| Utilities | 1 | $25B |
|
||
| Hotels | 1 | $24B |
|
||
| Consumer Goods | 1 | $7B |
|
||
| Real Estate | 1 | $6B |
|
||
| Chemicals | 1 | $2B |
|
||
Price history
+1763.8% since first listed10 events — show timeline
- 2026-06-02 Coming Soon $219,000 BRIGHT MLS
- 2002-02-27 Sold (Public Records) $80,000 Public Records
- 2001-09-14 Sold (MLS) $80,000 MRIS
- 2001-07-13 Delisted — MRIS
- 2001-06-22 Listed $79,900 MRIS
- 1998-02-25 Sold (Public Records) $77,000 Public Records
- 1998-02-16 Sold (MLS) $77,000 MRIS
- 1998-01-07 Delisted — MRIS
- 1997-09-02 Listed $77,000 MRIS
- 1971-07-07 Sold (Public Records) $11,750 Public Records
Property tax history
+2.8%/yrLatest (2025): $2,469 · +3.8% YoY. Source: county tax records.
Cash-flow waterfall
monthlySold comps — $/sqft
last 12 mo · ≤1 miLoading sold comps…