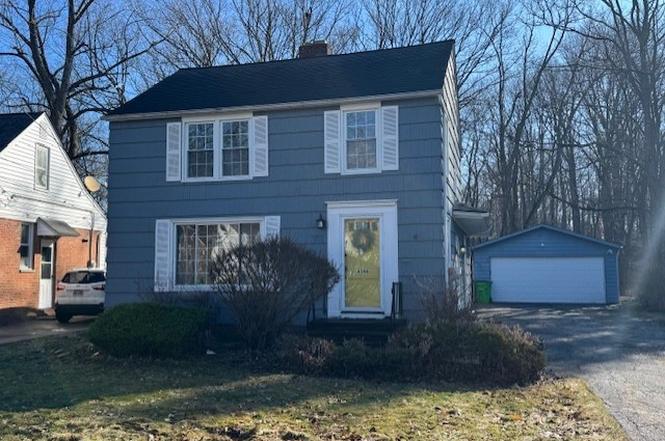
4586 E Berwald Rd · South Euclid, OH
Flood risk 4/10 · Minor
- FEMA flood zone
- X (unshaded)
- Chance of flooding over 30 yrs
- 0.22%
- Est. flood insurance / yr
- $473 – $860
Fire risk 1/10 · Minimal
- Est. fire insurance / yr
- $713 – $1,323
Heat risk 2/10 · Minimal
- Hot days now (above 95°F)
- 7 days/yr
- Hot days in 30 yrs
- 16 days/yr
Wind risk 1/10 · Minimal
- Chance of severe wind over 30 yrs
- —
Air-quality risk 3/10 · Minor
- Unhealthy air days now
- 2 days/yr
- Unhealthy air days in 30 yrs
- 5 days/yr
Risk factors via First Street. Map © Google.
Why this score? — see what drove the B- grade
The composite is a weighted blend of 9 inputs, each scored 0–100. Each bar is that input's sub-score; the figure is the points it added to the 100-point composite (weight × sub-score).
- Cash flow +23.6/30.0
- ARV discount +15.0/15.0
- 1% rule +8.3/10.0
- DSCR +7.6/10.0
- Livability +4.4/5.0
- Rent growth +4.2/5.0
- Schools +3.1/10.0
- Condition / age +2.5/5.0
- Appreciation +0.0/10.0
$150,000
🖨 Deal sheet (PDF) 📄 Offer letter ✓ Due diligence
Listing remarks
Opportunity awaits in the unique colonial home in South Euclid. This home features an extra large lot that backs up to the Euclid Creek. This home features a large living room with a fireplace and a formal dining room and second dining area on the first floor. There is a large family room with a vaulted ceiling overlooking the backyard. This home features a 3 bedrooms, 1.5 bathrooms and a partially finished basement. The garage is a newer built structure as an added bonus. This home does need some repairs and buyer will be required assume the South Euclid violations and any escrow requirements by the city. The seller makes no representations or warranties about the condition of this home an
Key facts
- Large family room
- Formal dining room
- Extra large lot
Tags
Neighborhood map
What this means for you Summary
Snapshot
- This is a 3-bed/1.0-bath single-family listed at $150k.
Deal economics
- At list price, monthly cash flow is $282 ($3k/yr) — positive.
- The deal already cash-flows at list — no discount required.
- Meets the 1% rule at list price ($2k rent vs $150k).
- Recommended offer: $146k (3.0% below list) — sets the bar for market timing.
- Cap rate 8.5% vs local median 5.9% in South Euclid — top-decile yield for the area; either an underpriced asset or a hidden risk that comps aren't pricing in. Stress-test before assuming the spread holds.
Location & tenants
- Location reads 88/100 on livability (#22 in OH, #207 nationally) — a professional / high-income tenant draw. Strengths: commute A+, cost of living A+, housing A+.
- South Euclid-Lyndhurst City (suburban): math 23% / reading 45% proficiency, ranked #556 of 656 in OH (top 85%) — families likely to look elsewhere, expect single-tenant / working-renter base with shorter leases.
- Market conditions: Rents rising fast (+6.8%/yr); 150 active listings in the ZIP; 18 comparable units currently listed for rent nearby; rentals at typical pace (median 25d on market — plan ~3-4 weeks tenant-placement turnaround); solid renter incomes; 1,441 units permitted in Cuyahoga County in 2024 (700 in 5+ unit buildings).
- This rent runs 31% of the median local income ($77k/yr) — at the standard rent-burdened threshold; future hikes will face affordability resistance.
Forward outlook
- Local home prices are declining (-3.0%/yr); year-one equity from $1k of loan paydown is wiped out by about $4k of value loss. Plan a longer hold.
- Cuyahoga County population projected to shrink 8% by 2050 — rents likely to lag national; underwrite the cash flow, not the appreciation.
- At projected returns (-3.0% appreciation + 6.8% rent growth), your $42k cash investment doubles in ~8 years — after that, you're playing with house money.
Negotiation context
- It's been on market 59 days — a 3% lower offer ($146k) is reasonable based on typical stale-listing flexibility.
Risks & watch-outs
- Watch-outs: property tax is 3.5% of price; built in 1945 — expect roof / HVAC / electrical / plumbing capex.
Questions for the listing agent
- It's been on market 59 days. Have you received any prior offers? Is the seller open to a 3% concession, seller financing, or rate buy-down credit?
- Built in 1945 — when were the roof, HVAC, electrical panel, plumbing, and water heater last replaced?
- Property tax is high relative to price — has the assessment been appealed recently, and will the sale trigger a re-assessment?
- Is there a deadline driving the sale (1031 exchange, divorce, estate, relocation)? That informs how much negotiation room exists.
- Schools are B-rated — typically a magnet for longer-tenancy family renters. What's the average tenant stay here, and is there a school-zone premium baked into asking?
- What's the average days-on-market for RENTAL listings here right now (not sales)? A rising rental-DOM trend means longer vacancies and softer asking-rent achievability than the comps imply.
- What's the recent tenant-quality profile in this submarket — average credit score on applications, eviction rate, late-payment / NSF rate, and stable-employment percentage? A property-management company in the area should have these aggregated.
- How much new for-sale + rental construction is in the pipeline within 1–3 miles? Heavy new supply typically softens prices + rents 12–24 months out; constrained supply supports both.
Investment metrics
- 1% rule
- 1.33% ✓
- Cap rate
- 8.55%
- Cash-on-cash
- 8.05%
- DSCR
- 1.36
- GRM
- 6.3
CMA / ARV
- ARV (on-the-fly)
- $254,592
- Comps found
- 12
Show comp detail 12 sales within ~0.75 mi
| Address | Dist | Beds/Ba | Sqft | Sold | Price | $/sf | Match |
|---|---|---|---|---|---|---|---|
| 4784 Burger Rd | 0.35mi | 3/1.5 | 1,686 (-5%) | 2mo | $242,500 | $144 | 72 |
| 4776 Burger Rd | 0.33mi | 4/1.5 (+1) | 1,657 (-6%) | 1mo | $155,000 | $94 | 66 |
| 1393 Dorsh Rd | 0.46mi | 3/2.0 | 1,672 (-5%) | 0mo | $225,000 | $135 | 65 |
| 1381 S Green Rd | 0.43mi | 4/1.5 (+1) | 1,671 (-6%) | 1mo | $156,500 | $94 | 63 |
| 4381 Lucille Ave | 0.41mi | 3/1.5 | 1,608 (-9%) | 2mo | $227,000 | $141 | 62 |
| 4933 Fairlawn Rd | 0.66mi | 4/1.5 (+1) | 1,776 (+0%) | 0mo | $301,250 | $170 | 61 |
| 4946 Fairlawn Rd | 0.68mi | 4/1.5 (+1) | 1,815 (+3%) | 0mo | $232,500 | $128 | 57 |
| 4531 Ardendale Rd | 0.74mi | 3/1.5 | 1,697 (-4%) | 2mo | $265,000 | $156 | 55 |
| 4872 Oakland Dr | 0.56mi | 3/1.0 | 1,550 (-12%) | 2mo | $212,200 | $137 | 52 |
| 4389 Ardmore Rd | 0.42mi | 4/2.5 (+1) | 1,983 (+12%) | 3mo | $295,000 | $149 | 47 |
| 4971 S Sedgewick Rd | 0.73mi | 4/2.0 (+1) | 1,673 (-5%) | 3mo | $315,000 | $188 | 46 |
| 1503 Sheridan Rd | 0.60mi | 3/1.5 | 1,510 (-15%) | 1mo | $237,500 | $157 | 45 |
Match score weights: distance 35% · size 25% · config 20% · recency 20%. Top-matched comps best support the ARV.
Projected returns pro-forma
-3.0% appreciation · 6.85% rent growth · sell at horizon
- IRR
- 1.1%
- Equity multiple
- 1.04×
- Total profit
- $1,830
- Equity at exit
- $22,365
- IRR
- 14.8%
- Equity multiple
- 2.45×
- Total profit
- $61,003
- Equity at exit
- $12,969
Cash invested: $42,000 (down + closing). Projections, not guarantees.
Landlord ↔ Tenant lean methodology
- Overall (STATE)
- 73 Landlord-Friendly
- State Ohio
- 73 Landlord-Friendly · R+6
- County
- — inherits STATE
- City
- — inherits STATE
ZIP-level market 44121
- Rents YoY
- 6.8%
- Active inventory
- 150
- Price-to-rent
- 6.3×
Monthly cashflow live
- Estimated rent
- $1,988 high interval (Pro) →
- Mortgage (P&I)
- −$787
- Tax from tax record
- −$440 /mo · $5,279/yr
- Insurance
- −$62
- HOA
- −$0
- Vacancy / Maint / Mgmt
- −$418
- Net cashflow
- $282
Break-even live
Sensitivity live
| Price | -10% $367 | -5% $324 | +0% $282 | +5% $239 | +10% $197 |
|---|---|---|---|---|---|
| Rent | -10% $125 | -5% $203 | +0% $282 | +5% $360 | +10% $439 |
| Rate | -1.0pp $357 | -0.5pp $320 | base $282 | +0.5pp $243 | +1.0pp $203 |
UW: 25.0% down · 7.5% · 30yr · 1.5% tax · 5.0% vac · 8.0% maint · 8.0% mgmt
Financing live
Cash to close
- Down payment
- $37,500
- Closing costs
- $4,500
- Reserves months
- —
- Total cash needed
- —
Loan-product check · same deal, 3 products live
Conventional
25% down · 7.5% · 30yr
- Down + closing
- —
- Monthly P&I
- —
- Monthly cashflow
- —
- DSCR
- —
- Eligible?
- —
Personal DTI + credit; lowest rate.
DSCR
20% down · 8.5% · 30yr
- Down + closing
- —
- Monthly P&I
- —
- Monthly cashflow
- —
- DSCR
- —
- Eligible?
- —
No personal income docs; deal must DSCR.
Hard money
10% down · 12.0% · 12mo
- Down + closing
- —
- Monthly P&I
- —
- Monthly cashflow
- —
- DSCR
- —
- Eligible?
- —
Short-term bridge; refi at stabilization.
Rent comps 18 comps
| Address | Beds | Baths | Sqft | Rent | $/sqft | DOM | Units | Dist |
|---|---|---|---|---|---|---|---|---|
| 4409 Adrian Rd Cleveland, OH | 4.0 | 2.5 | 1542 | $1,855 | $1.20 | 2d | 1 | 0.38mi |
| 963 Chelston Rd Cleveland, OH | 4.0 | 2.0 | 1974 | $1,950 | $0.99 | 44d | 1 | 0.69mi |
| 4994 N Sedgewick Rd Cleveland, OH | 3.0 | 1.5 | 1400 | $3,000 | $2.14 | 44d | 1 | 0.79mi |
| 1405 Villa Dr Cleveland, OH | 4.0 | 1.5 | 1480 | $1,790 | $1.21 | 17d | 1 | 0.89mi |
| 1420 Villa Dr Cleveland, OH | 3.0 | 2.0 | 1600 | $1,550 | $0.97 | 44d | 1 | 0.92mi |
| 1599 Felton Rd Cleveland, OH | 3.0 | 1.5 | 1248 | $1,650 | $1.32 | 44d | 1 | 1.17mi |
| 1082 Hillstone Rd Unit 1 Cleveland Heights, OH | 3.0 | 1.5 | 2376 | $1,695 | $0.71 | 24d | 1 | 1.21mi |
| 1082 Hillstone Rd Cleveland, OH | 3.0 | 2.0 | 2376 | $1,695 | $0.71 | 24d | 1 | 1.21mi |
| 4456 Donna Dr Richmond Heights, OH | 3.0 | 2.5 | 1940 | $2,295 | $1.18 | 2d | 1 | 1.24mi |
| 3917 Bluestone Rd Cleveland, OH | 4.0 | 1.5 | 1700 | $1,650 | $0.97 | 22d | 1 | 1.28mi |
| 4093 Bexley Blvd Cleveland, OH | 3.0 | 1.5 | 1890 | $1,650 | $0.87 | 8d | 1 | 1.32mi |
| 1270 Roland Rd Cleveland, OH | 4.0 | 2.0 | 1720 | $2,450 | $1.42 | 44d | 1 | 1.36mi |
| 4165 Harwood Rd Cleveland, OH | 4.0 | 2.0 | 1608 | $1,950 | $1.21 | 44d | 1 | 1.37mi |
| 1497 S Noble Rd Cleveland, OH | 4.0 | 1.0 | 1250 | $2,650 | $2.12 | 2d | 1 | 1.37mi |
| 303 S Green Rd Cleveland, OH | 4.0 | 2.0 | 1381 | $1,700 | $1.23 | 2d | 1 | 1.38mi |
| 4241 Bayard Rd Cleveland, OH | 3.0 | 2.0 | 1350 | $1,995 | $1.48 | 24d | 1 | 1.39mi |
| 3808 Kirkwood Rd Cleveland, OH | 4.0 | 1.5 | 1740 | $2,150 | $1.24 | 15d | 1 | 1.48mi |
| 3810 Parkdale Rd Cleveland, OH | 3.0 | 1.5 | 1281 | $2,067 | $1.61 | 3d | 1 | 1.49mi |
Listing history 11 events
-
2026-06-21days on market $150,000 Active 59 DOM
-
2026-06-18days on market $150,000 Active 56 DOM
-
2026-06-17days on market $150,000 Active 55 DOM
-
2026-06-16days on market $150,000 Active 54 DOM
-
2026-06-15days on market $150,000 Active 53 DOM
-
2026-06-13days on market $150,000 Active 51 DOM
-
2026-06-13statusdays on market $150,000 Active 50 DOM
-
2026-04-16status Pending
-
2026-04-13historical Contingent
-
2026-02-25$150,000 Active
-
2005-06-10soldstatus $160,000
ⓘ Source: listings_history table (triggers on properties + properties_extension) + one-shot
backfill from property_details.listing_events for pre-trigger history.
Tax reassessment forecast OH · Partial reset (capped growth)
- Current annual tax
- $5,279 · $440/mo
- Projected year-2 tax
- $5,279 · $440/mo
- Expected delta
- $0/yr ($0/mo · 0.0%)
ⓘ Screening estimate from a state-policy table — verify with the county assessor before closing.
Climate risk First Street
- Flood 4/10 Moderate FEMA zone X (unshaded) · 22% chance over 30 yrs
- Wildfire 1/10 Low
- Heat 2/10 Low 7 d/yr ≥95°F today · 16 d/yr by 30 yrs out
- Wind 1/10 Low
- Air quality 3/10 Moderate 2 unhealthy d/yr today · 5 by 30 yrs out
Nearby sold comps map
Loading sold comps map…
Walkable amenities ~0.75 mi
Loading nearby amenities…
Taxation est. · year 1
- Rental income
- $23,861
- − Mortgage interest
- −$8,402
- − Property taxes
- −$5,279
- − Insurance
- −$750
- − Repairs & maintenance
- −$1,909
- − Management
- −$1,909
- − Depreciation
- −$4,364
- Taxable income
- $1,249
- Est. tax owed @ 24.0%
- −$300
- After-tax cash flow
- $3,083/yr
For passive investors: Depreciation is non-cash, so a rental often shows a tax loss while cash-flowing — sheltering income. Rental losses are passive: they offset passive income freely, and up to $25,000/yr can offset ordinary (W-2) income if you actively participate and your MAGI is under $100k (phasing out to $0 by $150k); unused losses carry forward. On sale, claimed depreciation is recaptured at up to 25%, and gains may owe capital-gains tax (a 1031 exchange can defer both). Figures are a year-1 estimate at your 24.0% rate — not tax advice; consult a CPA.
Schools (NCES district)
- District
- South Euclid-Lyndhurst City
- NCES district ID
- 3904479
- Math proficiency
- 23% ▼ -22.00%
- Reading proficiency
- 45% ▼ -11.00%
- Median HH income
- $61,244
- Composite
- 30.51/100
- National rank
- #6212
- State rank
- #556 of 656 in OH
Livability — South Euclid
- Score
- 88/100
- State rank
- #22
- US rank
- #207
Category grades
Schools grade is shown separately in the Schools card above.
Census & demographics
- Census place
- South Euclid, OH
- County
- Cuyahoga County · 1,090,369 people
- City population
- 32,668
- Metro
- Cleveland-Elyria, OH
- Population (ZIP)
- 32,312
- Household income
- $76,767
- Rent vs Own
- Severe rent burden
- 672.0
Population outlook (Cuyahoga County) Hauer SSP2
- Today (2025)
- 1,244,621 people
- By 2030
- 1,230,093 · -1.2%
- By 2040
- 1,189,108 · -4.5%
- By 2050
- 1,145,706 · -7.9%
- By 2075
- 1,076,557 · -13.5%
- By 2100
- 978,987 · -21.3%
Race, ethnicity, and origin ACS 2023
- Neighborhood character
- Diverse neighborhood (Simpson 0.56)
- Race & ethnicity
- Black 55% White 36% Two or more races 4% Hispanic / Latino 3% Asian 2%
- Common ancestry
- Romanian 3% Italian 2% Scotch-Irish 2%
- Foreign-born
- 5% · Canada, China, India
- Languages at home
- 92% English-only · Spanish 2% Chinese 1% Other Indo-European 1%
Political lean MEDSL · Cuyahoga
- 2024 margin
- Solid D (+31.5) · D 65.4% · R 33.9%
- 2008→2024 swing
- -7.4pp toward R · 2008: 38.9pp · 2024: 31.5pp
- All cycles
- 2024: D+31.5 2020: D+34.1 2016: D+35.0 2012: D+38.7 2008: D+38.9
Not yet ingested
- Civics
- —
Market trends
- HPI YoY
- ▼ -180.15%
- Current HPI
- 173.7405
- Rent YoY
- ▲ 6.85%
- Metro
- Cleveland-Elyria, OH
- State GDP YoY
- ▲ 1.98%
- F500 in state
- 48
Industry mix (Fortune 500 HQ in OH)
| Industry | F500 HQs | Revenue |
|---|---|---|
| Insurance | 3 | $145B |
|
||
| Industrial Machinery | 3 | $49B |
|
||
| Financial Services | 3 | $24B |
|
||
| Consumer Goods | 2 | $93B |
|
||
| Aerospace / Defense | 2 | $47B |
|
||
| Utilities | 2 | $33B |
|
||
Price history
-6.2% since first listed4 events — show timeline
- 2026-04-16 Pending — MLSNOW
- 2026-04-13 Contingent — MLSNOW
- 2026-02-25 Listed $150,000 MLSNOW
- 2005-06-10 Sold (Public Records) $160,000 Public Records
Property tax history
+2.3%/yrLatest (2025): $5,279 · +13.1% YoY. Source: county tax records.
Cash-flow waterfall
monthlySold comps — $/sqft
last 12 mo · ≤1 miLoading sold comps…