6315 Mountain Lily Ln · Houston, TX
Flood risk No data
- FEMA flood zone
- —
- Chance of flooding over 30 yrs
- —
- Est. flood insurance / yr
- —
Fire risk No data
- Est. fire insurance / yr
- —
Heat risk No data
- Hot days now (above threshold)
- —
- Hot days in 30 yrs
- —
Wind risk No data
- Chance of severe wind over 30 yrs
- —
Air-quality risk No data
- Unhealthy air days now
- —
- Unhealthy air days in 30 yrs
- —
Risk factors via First Street. Map © Google.
Why this score? — see what drove the D grade
The composite is a weighted blend of 9 inputs, each scored 0–100. Each bar is that input's sub-score; the figure is the points it added to the 100-point composite (weight × sub-score).
- Cash flow +12.9/30.0
- ARV discount +7.5/15.0
- Schools +5.7/10.0
- Condition / age +4.0/5.0
- DSCR +3.8/10.0
- Livability +3.7/5.0
- 1% rule +3.6/10.0
- Rent growth +2.3/5.0
- Appreciation +0.0/10.0
$318,990
🖨 Deal sheet (PDF) 📄 Offer letter ✓ Due diligence
Listing remarks
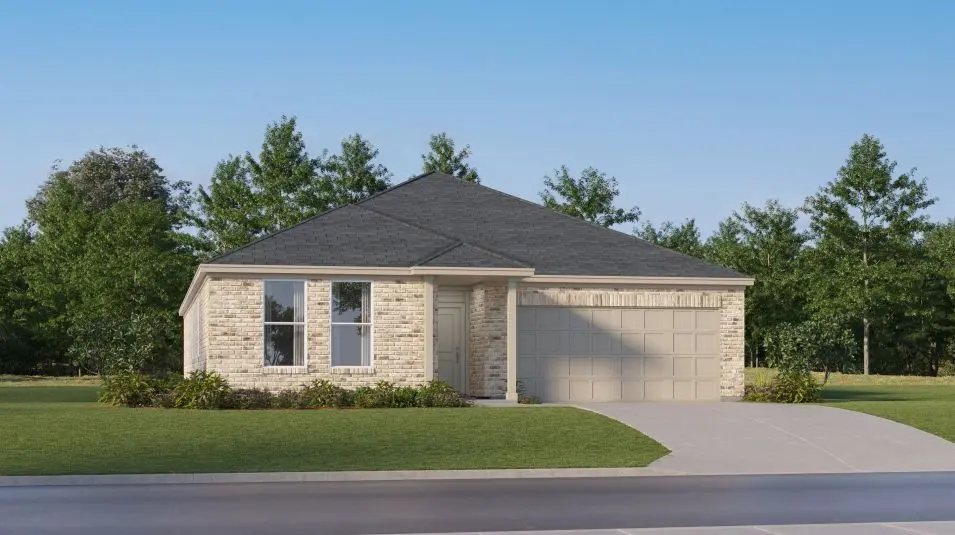
This single-story home shares an open layout between the kitchen, nook and family room for easy entertaining, along with access to the covered patio for year-round outdoor lounging. A luxe owner's suite is in a rear of the home and comes complete with an en-suite bathroom and walk-in closet. There are three secondary bedrooms near the front of the home, ideal for household members and overnight guests, as well as a versatile flex space that can transform to meet the homeowner's needs.
Key facts
- Walk-in closet
- Flex space
- Open layout
Tags
Property features AI
Finance
- Other: Virtual tour available
- Financial info: List price $318,990
Exterior
- Parking: 2-car garage; 2 total parking spaces
- Home design: Spec new construction — Springsteen plan; Single-family home (plan-based)
- Construction: New construction (spec home)
- Exterior features: Address: 6315 Mountain Lily Ln, Katy TX 77493; Living area approximately 2,083
Interior
- Kitchen: Plan includes standard kitchen (details not provided)
- Bedrooms: 4 bedrooms
- Bathrooms: 2 bathrooms
- Interior features: Open living area (per plan)
- Laundry & utility: Laundry area (details not provided)
Neighborhood map
What this means for you Summary
Snapshot
- This is a 4-bed/2.0-bath single-family listed at $319k. Condition is rated good.
Deal economics
- At list price, monthly cash flow is $-26 ($-310/yr) — negative.
- To cash-flow at today's rent, offer at most $315k (1.2% below list).
- To meet the 1% rule (rent ≥ 1% of price), the offer needs to be $276k (13.5% below list).
- Recommended offer: $276k (13.5% below list) — sets the bar for 1% rule.
- Cap rate 6.2% vs local median 3.2% in Houston — top-decile yield for the area; either an underpriced asset or a hidden risk that comps aren't pricing in. Stress-test before assuming the spread holds.
Location & tenants
- Location reads 74/100 on livability (#184 in TX, #4,771 nationally) — a middle-class / working-renter tenant base. Strengths: amenities A+, cost of living A+, housing A+; Watch: crime F.
- Katy ISD (suburban): math 61% / reading 63% proficiency, ranked #29 of 826 in TX (top 4%) — acceptable for families but not a draw, mixed tenant base, ~2y average lease.
- Zoned schools: Robert King El (math 41% / reading 44%, grade F, #1,313 of 4,322 statewide, top 31%, 981 students, 68% FRL); Katy J H (math 52% / reading 51%, grade C, #318 of 1,662 statewide, top 20%, 1,094 students, 53% FRL); Katy H S (math 62% / reading 74%, grade B, #150 of 1,632 statewide, top 10%, 3,330 students, 38% FRL) — zoned schools average 53% FRL vs 27% district-wide (25 pts higher); higher-poverty schools than district average — tighter screening recommended.
- Market conditions: Rents soft (-0.8%/yr); 2729 active listings in the ZIP; 23 comparable units currently listed for rent nearby; rentals at typical pace (median 26d on market — plan ~3-4 weeks tenant-placement turnaround); 48% of comp listings sitting > 30 days — soft ceiling on asking rent; high-income renter base; 29,883 units permitted in Harris County in 2024 (8,621 in 5+ unit buildings).
Forward outlook
- Local home prices are declining (-3.0%/yr); year-one equity from $2k of loan paydown is wiped out by about $10k of value loss. Plan a longer hold.
- Harris County population projected at +47% by 2050 — long-run rental-demand tailwind backs the buy-and-hold thesis.
Negotiation context
- Only 1 days on market — expect competitive offers; lowballing is unlikely to land.
Questions for the listing agent
- What do current leases actually rent for vs. the listed asking? Can we see a recent rent roll and the last 12 months of T-12 income?
- Is there a deadline driving the sale (1031 exchange, divorce, estate, relocation)? That informs how much negotiation room exists.
- Schools are D-rated, which usually means shorter tenancies and higher turnover. Who's the typical renter profile here, and what's been the actual vacancy rate?
- Crime grade is F in this area — have there been break-ins, vandalism, or insurance claims at this property in the last 3 years? What carrier currently insures it and at what premium?
- The area grade is low — what's the realistic commute time and amenity access for the typical tenant pool here? Any planned neighborhood developments (good or bad) we should know about?
- What's the average days-on-market for RENTAL listings here right now (not sales)? A rising rental-DOM trend means longer vacancies and softer asking-rent achievability than the comps imply.
- What's the recent tenant-quality profile in this submarket — average credit score on applications, eviction rate, late-payment / NSF rate, and stable-employment percentage? A property-management company in the area should have these aggregated.
- How much new for-sale + rental construction is in the pipeline within 1–3 miles? Heavy new supply typically softens prices + rents 12–24 months out; constrained supply supports both.
Investment metrics
- 1% rule
- 0.86% ✗
- Cap rate
- 6.20%
- Cash-on-cash
- -0.35%
- DSCR
- 0.98
- GRM
- 9.6
CMA / ARV
- ARV (on-the-fly)
- $318,699
- Comps found
- 12
Show comp detail 12 sales within ~0.75 mi
| Address | Dist | Beds/Ba | Sqft | Sold | Price | $/sf | Match |
|---|---|---|---|---|---|---|---|
| 26527 Ivory Petal Dr | 0.12mi | 4/2.0 | 2,083 (0%) | 1mo | $309,140 | $148 | 93 |
| 26607 Ivory Petal Dr | 0.15mi | 4/2.0 | 2,083 (0%) | 1mo | $380,990 | $183 | 92 |
| 26803 Scarlet Willow Dr | 0.32mi | 4/2.5 | 1,968 (-6%) | 0mo | $275,240 | $140 | 74 |
| 6614 Sienna Sunrise Ln | 0.44mi | 4/2.0 | 2,013 (-3%) | 1mo | $309,790 | $154 | 73 |
| 6634 Sienna Sunrise Ln | 0.48mi | 4/2.0 | 2,013 (-3%) | 0mo | $305,990 | $152 | 72 |
| 6630 Sienna Sunrise Ln | 0.47mi | 4/3.0 | 2,162 (+4%) | 1mo | $293,490 | $136 | 67 |
| 6426 Green Pedal Ln | 0.45mi | 3/2.0 (-1) | 1,908 (-8%) | 1mo | $294,440 | $154 | 59 |
| 5806 Havana Mist Dr | 0.74mi | 4/2.5 | 2,134 (+2%) | 0mo | $305,000 | $143 | 59 |
| 26410 Wild Stonecrop Ln | 0.54mi | 4/3.0 | 2,231 (+7%) | 1mo | $340,990 | $153 | 58 |
| 6710 Sienna Sunrise Ln | 0.50mi | 4/3.0 | 2,263 (+9%) | 0mo | $328,590 | $145 | 58 |
| 6427 Green Pedal Ln | 0.46mi | 3/2.0 (-1) | 1,880 (-10%) | 1mo | $308,990 | $164 | 56 |
| 6435 Green Pedal Ln | 0.47mi | 3/2.0 (-1) | 1,880 (-10%) | 1mo | $324,140 | $172 | 56 |
Match score weights: distance 35% · size 25% · config 20% · recency 20%. Top-matched comps best support the ARV.
Projected returns pro-forma
-3.0% appreciation · 0.0% rent growth · sell at horizon
- IRR
- -20.3%
- Equity multiple
- 0.31×
- Total profit
- $-61,378
- Equity at exit
- $47,562
- IRR
- -21.9%
- Equity multiple
- 0.03×
- Total profit
- $-86,632
- Equity at exit
- $27,580
Cash invested: $89,317 (down + closing). Projections, not guarantees.
Landlord ↔ Tenant lean methodology
- Overall (STATE)
- 87 Strongly Landlord-Friendly
- State Texas
- 87 Strongly Landlord-Friendly · R+5
- County
- — inherits STATE
- City
- — inherits STATE
ZIP-level market 77493
- Rents YoY
- -0.8%
- Active inventory
- 2729
- Price-to-rent
- 9.6×
Monthly cashflow live
- Estimated rent
- $2,758 high interval (Pro) →
- Mortgage (P&I)
- −$1,673
- Tax est. 1.5%
- −$399 /mo · $4,785/yr
- Insurance
- −$133
- HOA
- −$0
- Vacancy / Maint / Mgmt
- −$579
- Net cashflow
- $-26
Break-even live
Sensitivity live
| Price | -10% $195 | -5% $84 | +0% $-26 | +5% $-136 | +10% $-246 |
|---|---|---|---|---|---|
| Rent | -10% $-244 | -5% $-135 | +0% $-26 | +5% $83 | +10% $192 |
| Rate | -1.0pp $135 | -0.5pp $55 | base $-26 | +0.5pp $-109 | +1.0pp $-193 |
UW: 25.0% down · 7.5% · 30yr · 1.5% tax · 5.0% vac · 8.0% maint · 8.0% mgmt
Financing live
Cash to close
- Down payment
- $79,748
- Closing costs
- $9,570
- Reserves months
- —
- Total cash needed
- —
Loan-product check · same deal, 3 products live
Conventional
25% down · 7.5% · 30yr
- Down + closing
- —
- Monthly P&I
- —
- Monthly cashflow
- —
- DSCR
- —
- Eligible?
- —
Personal DTI + credit; lowest rate.
DSCR
20% down · 8.5% · 30yr
- Down + closing
- —
- Monthly P&I
- —
- Monthly cashflow
- —
- DSCR
- —
- Eligible?
- —
No personal income docs; deal must DSCR.
Hard money
10% down · 12.0% · 12mo
- Down + closing
- —
- Monthly P&I
- —
- Monthly cashflow
- —
- DSCR
- —
- Eligible?
- —
Short-term bridge; refi at stabilization.
Rent comps 23 comps
| Address | Beds | Baths | Sqft | Rent | $/sqft | DOM | Units | Dist |
|---|---|---|---|---|---|---|---|---|
| 6758 Sunset Velvet Dr Katy, TX | 3.0 | 2.0 | 1580 | $2,350 | $1.49 | 45d | 1 | 0.59mi |
| 26642 Prairie Smoke Ln Katy, TX | 3.0 | 2.0 | 1949 | $2,300 | $1.18 | 45d | 1 | 0.62mi |
| 26811 Prairie Smoke Ln Katy, TX | 4.0 | 2.0 | 1656 | $2,250 | $1.36 | 45d | 1 | 0.67mi |
| 6414 Orchid Beach Dr Katy, TX | 5.0 | 4.0 | 2490 | $3,000 | $1.20 | 14d | 1 | 0.71mi |
| 5835 Big Bluestem Ln Katy, TX | 5.0 | 3.0 | 2890 | $2,406 | $0.83 | 45d | 1 | 0.76mi |
| 6303 Marigold Blaze Dr Katy, TX | 3.0 | 2.0 | 1474 | $2,250 | $1.53 | 45d | 1 | 0.90mi |
| 27507 Hudson Sands Ln Katy, TX | 4.0 | 3.0 | 2294 | $3,000 | $1.31 | 18d | 1 | 1.00mi |
| 6427 Seafoam Lake Dr Katy, TX | 4.0 | 4.0 | 2479 | $3,000 | $1.21 | 0d | 1 | 1.02mi |
| 27327 Blue Pool Dr Katy, TX | 4.0 | 3.0 | 2100 | $2,600 | $1.24 | 45d | 1 | 1.06mi |
| 5819 Bright Keel Dr Katy, TX | 4.0 | 3.0 | 2598 | $2,400 | $0.92 | 45d | 1 | 1.06mi |
| 26802 Cenzontle Dr Katy, TX | 3.0 | 2.0 | 1470 | $1,850 | $1.26 | 45d | 1 | 1.07mi |
| 5631 Pearl Vista Dr Katy, TX | 4.0 | 3.0 | 2039 | $3,000 | $1.47 | 22d | 1 | 1.10mi |
| 27064 Beach Ball Dr Katy, TX | 3.0–4.0 | 2.5–3.5 | 1705 | $2,957 | $1.73 | 0d | 25 | 1.17mi |
| 7402 Clover Chase Dr Katy, TX | 4.0 | 3.0 | 1840 | $2,400 | $1.30 | 45d | 1 | 1.18mi |
| 7410 Hillside Arbor Dr Katy, TX | 4.0 | 2.0 | 2289 | $2,400 | $1.05 | 45d | 1 | 1.23mi |
| 3020 Nori Shores Dr Katy, TX | 5.0 | 2.5 | 2408 | $3,995 | $1.66 | 26d | 1 | 1.32mi |
| 3084 Fantasy Terrace Dr Katy, TX | 4.0 | 2.0 | 2085 | $2,325 | $1.12 | 14d | 1 | 1.36mi |
| 3081 Fantasy Terrace Dr Katy, TX | 4.0 | 2.0 | 1670 | $2,275 | $1.36 | 26d | 1 | 1.38mi |
| 3072 Fantasy Terrace Dr Katy, TX | 4.0 | 2.0 | 2279 | $2,550 | $1.12 | 23d | 1 | 1.39mi |
| 3076 Dylan Skyland Dr Katy, TX | 4.0 | 2.5 | 2240 | $3,395 | $1.52 | 26d | 1 | 1.39mi |
| 3053 Fantasy Terrace Dr Katy, TX | 4.0 | 2.0 | 2085 | $2,440 | $1.17 | 17d | 1 | 1.43mi |
| 3064 Dawn Sound Dr Katy, TX | 3.0 | 2.0 | 1464 | $1,950 | $1.33 | 45d | 1 | 1.45mi |
| 3104 Nori Shores Dr Katy, TX | 5.0 | 2.5 | 1947 | $3,695 | $1.90 | 5d | 1 | 1.47mi |
Listing history 2 events
-
2026-05-31remarks 489-char remark
-
2026-05-31$318,990 Active 1 DOM
ⓘ Source: listings_history table (triggers on properties + properties_extension) + one-shot
backfill from property_details.listing_events for pre-trigger history.
Nearby sold comps map
Loading sold comps map…
Walkable amenities ~0.75 mi
Loading nearby amenities…
Taxation est. · year 1
- Rental income
- $33,093
- − Mortgage interest
- −$17,868
- − Property taxes
- −$4,785
- − Insurance
- −$1,595
- − Repairs & maintenance
- −$2,647
- − Management
- −$2,647
- − Depreciation
- −$9,280
- Taxable loss
- −$5,730
- Est. tax savings @ 24.0%
- +$1,375
- After-tax cash flow
- $1,065/yr
For passive investors: Depreciation is non-cash, so a rental often shows a tax loss while cash-flowing — sheltering income. Rental losses are passive: they offset passive income freely, and up to $25,000/yr can offset ordinary (W-2) income if you actively participate and your MAGI is under $100k (phasing out to $0 by $150k); unused losses carry forward. On sale, claimed depreciation is recaptured at up to 25%, and gains may owe capital-gains tax (a 1031 exchange can defer both). Figures are a year-1 estimate at your 24.0% rate — not tax advice; consult a CPA.
Condition & rehab AI · 12 photos
This single-story home features a modern open layout and well-maintained exterior, making it a great candidate for a cosmetic upgrade to enhance its resale and rental value.
Value-add opportunities
- Both Paint exterior trim — Enhances curb appeal and value
- Both Replace window screens — Improves energy efficiency and aesthetics
Renovation cost estimate screening
Value-add ROI direction
- Both Paint exterior trim — Enhances curb appeal and value ↑
- Both Replace window screens — Improves energy efficiency and aesthetics ↑
ⓘ Cost ranges are severity-bucket heuristics (US national rule-of-thumb). Get contractor quotes + a written scope before underwriting a rehab budget.
Schools (NCES district)
- District
- Katy ISD
- NCES district ID
- 4825170
- Math proficiency
- 61% ▼ -7.00%
- Reading proficiency
- 63% ▼ -3.00%
- Median HH income
- $90,312
- Composite
- 56.59/100
- National rank
- #1146
- State rank
- #29 of 826 in TX
Livability — Houston
- Score
- 74/100
- State rank
- #184
- US rank
- #4771
Category grades
Schools grade is shown separately in the Schools card above.
Census & demographics
- County
- Harris County · 4,702,590 people
- City population
- 413,575
- Metro
- Houston-The Woodlands-Sugar Land, TX
- Population (ZIP)
- 71,484
- Household income
- $118,464
- Rent vs Own
- Severe rent burden
- 913.0
Population outlook (Harris County) Hauer SSP2
- Today (2025)
- 5,571,493 people
- By 2030
- 6,089,821 · +9.3%
- By 2040
- 7,142,806 · +28.2%
- By 2050
- 8,185,864 · +46.9%
- By 2075
- 10,574,329 · +89.8%
- By 2100
- 12,109,958 · +117.4%
Race, ethnicity, and origin ACS 2023
- Neighborhood character
- Highly diverse neighborhood (Simpson 0.73)
- Race & ethnicity
- White 36% Hispanic / Latino 33% Two or more races 16% Black 15% Asian 12%
- Hispanic origin (detail)
- Mexican 20%
- Common ancestry
- Lithuanian 2% Slovak 1% Italian 1%
- Foreign-born
- 21% · Canada, Vietnam, Jamaica
- Languages at home
- 64% English-only · Spanish 22% Vietnamese 5% French/Haitian/Cajun 4%
Political lean MEDSL · Harris
- 2024 margin
- Lean D (+5.5) · D 52.0% · R 46.4% · Other 1.6%
- 2008→2024 swing
- +3.9pp toward D · 2008: 1.6pp · 2024: 5.5pp
- All cycles
- 2024: D+5.5 2020: D+13.3 2016: D+12.4 2012: D+0.1 2008: D+1.6
Not yet ingested
- Civics
- —
Market trends
- HPI YoY
- ▼ -140.65%
- Current HPI
- 233.1683
- Rent YoY
- ▼ -0.80%
- Metro
- Houston-The Woodlands-Sugar Land, TX
- State GDP YoY
- ▲ 3.95%
- F500 in state
- 110
Industry mix (Fortune 500 HQ in TX)
| Industry | F500 HQs | Revenue |
|---|---|---|
| Energy | 16 | $1,198B |
|
||
| Technology | 5 | $198B |
|
||
| Engineering / Construction | 4 | $72B |
|
||
| Energy Services | 3 | $60B |
|
||
| Utilities | 3 | $41B |
|
||
| Healthcare | 2 | $330B |
|
||
Cash-flow waterfall
monthlySold comps — $/sqft
last 12 mo · ≤1 miLoading sold comps…