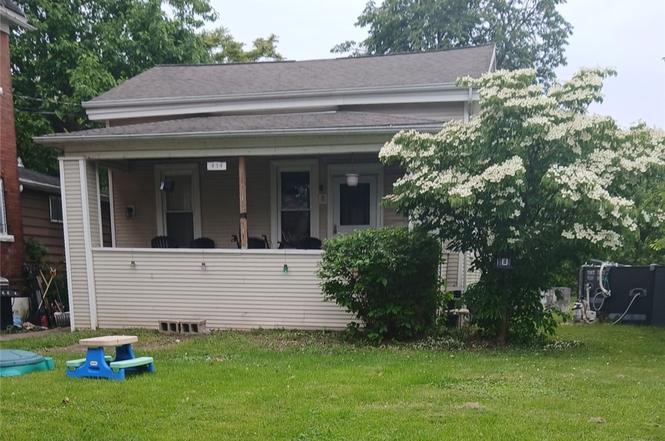
454 18th St · Niagara Falls, NY
Flood risk 1/10 · Minimal
- FEMA flood zone
- X (unshaded)
- Chance of flooding over 30 yrs
- 0.0%
- Est. flood insurance / yr
- $473 – $860
Fire risk 3/10 · Minor
- Est. fire insurance / yr
- $691 – $1,283
Heat risk 2/10 · Minimal
- Hot days now (above 94°F)
- 7 days/yr
- Hot days in 30 yrs
- 15 days/yr
Wind risk 1/10 · Minimal
- Chance of severe wind over 30 yrs
- —
Air-quality risk 3/10 · Minor
- Unhealthy air days now
- 2 days/yr
- Unhealthy air days in 30 yrs
- 3 days/yr
Risk factors via First Street. Map © Google.
Why this score? — see what drove the C grade
The composite is a weighted blend of 9 inputs, each scored 0–100. Each bar is that input's sub-score; the figure is the points it added to the 100-point composite (weight × sub-score).
- Cash flow +20.8/30.0
- ARV discount +9.4/15.0
- DSCR +6.6/10.0
- 1% rule +6.5/10.0
- Livability +3.0/5.0
- Rent growth +2.5/5.0
- Schools +2.5/10.0
- Condition / age +2.5/5.0
- Appreciation +2.3/10.0
$115,000
🖨 Deal sheet 📄 Offer letter ✓ Due diligence
Listing remarks MLS
This home is move in ready and priced to sell!! Huge double lot is totally fenced! Features include a formal dining rm, and nice size eat in kit. Two bedrooms and TWO full (one recently remodeled) baths on the first floor. PLUS first flr laundry!! Security System. Full walk out bsmt w/ glass block windows. Roof approx. 10yrs. Large rear patio, and freshly paved parking area in the rear with plenty of room for lrg size garage if desired. rocking chair front porch!This property is a steal at this price but owners need to settle estate.
Key facts
- Vinyl sided bungalow
- Spacious lot
- Full basement
Tags
Property features AI
Exterior
- Parking: No garage; driveway parking
- Utilities: Public water connected; Sewer connected
- Home design: Single-story; Resale property
- Construction: Vinyl siding; Stone foundation; Existing construction
- Exterior features: Blacktop driveway; Fully fenced yard; Open porch
Interior
- Kitchen: Eat-in kitchen
- Bedrooms: 2 main-level bedrooms
- Flooring: Hardwood; Laminate; Varies
- Bathrooms: 2 full bathrooms (both on the main level)
- Heating & cooling: Gas heating with baseboard; Window air conditioning units
- Interior features: Separate/formal dining room; Eat-in kitchen; Bedroom on main level; Has basement with exterior entry and walk-up/walk-out access
- Laundry & utility: Gas water heater
Neighborhood map
What this means for you Summary
Snapshot
- This is a 3-bed/2.0-bath single-family listed at $115k.
Deal economics
- At list price, monthly cash flow is $157 ($2k/yr) — positive.
- The deal already cash-flows at list — no discount required.
- Meets the 1% rule at list price ($1k rent vs $115k).
Location & tenants
- Location reads 60/100 on livability (#956 in NY) — a middle-class / working-renter tenant base. Strengths: cost of living A+, housing A+; Watch: schools F, crime F, amenities F.
- Niagara Falls City School District (urban): math 26% / reading 34% proficiency, ranked #578 of 590 in NY (top 98%) — families likely to look elsewhere, expect single-tenant / working-renter base with shorter leases; 66% free/reduced lunch — lower-income household profile, screen leases tightly.
- Market conditions: 74 active listings in the ZIP; 19 comparable units currently listed for rent nearby; rentals at typical pace (median 17d on market — plan ~3-4 weeks tenant-placement turnaround); 167 units permitted in Niagara County in 2024 (0 in 5+ unit buildings).
- This rent runs 35% of the median local income ($46k/yr) — at the standard rent-burdened threshold; future hikes will face affordability resistance.
Forward outlook
- Local home prices are declining (-3.0%/yr); year-one equity from $795 of loan paydown is wiped out by about $3k of value loss. Plan a longer hold.
- Niagara County population projected at -19% by 2050 — secular population decline; favor cash flow + early exit over multi-decade hold.
Negotiation context
- Only 1 days on market — expect competitive offers; lowballing is unlikely to land.
- 4 sale attempts since 13y ago with the ask held roughly flat each time — persistent listings suggest the price (not the market) is what's stuck; bring a comps-based counter.
- Current owner paid $31k; list at $115k implies a 271% gain — meaningful room to come down on a strong offer.
Risks & watch-outs
- Watch-outs: built in 1920 — expect roof / HVAC / electrical / plumbing capex.
Questions for the listing agent
- Built in 1920 — when were the roof, HVAC, electrical panel, plumbing, and water heater last replaced?
- Is there a deadline driving the sale (1031 exchange, divorce, estate, relocation)? That informs how much negotiation room exists.
- Schools are F-rated, which usually means shorter tenancies and higher turnover. Who's the typical renter profile here, and what's been the actual vacancy rate?
- Crime grade is F in this area — have there been break-ins, vandalism, or insurance claims at this property in the last 3 years? What carrier currently insures it and at what premium?
- What's the average days-on-market for RENTAL listings here right now (not sales)? A rising rental-DOM trend means longer vacancies and softer asking-rent achievability than the comps imply.
- What's the recent tenant-quality profile in this submarket — average credit score on applications, eviction rate, late-payment / NSF rate, and stable-employment percentage? A property-management company in the area should have these aggregated.
- How much new for-sale + rental construction is in the pipeline within 1–3 miles? Heavy new supply typically softens prices + rents 12–24 months out; constrained supply supports both.
Investment metrics
- 1% rule
- 1.15% ✓
- Cap rate
- 7.93%
- Cash-on-cash
- 5.85%
- DSCR
- 1.26
- GRM
- 7.3
CMA / ARV
- ARV (on-the-fly)
- $120,147
- Comps found
- 12
Show comp detail 12 sales within ~0.75 mi
| Address | Dist | Beds/Ba | Sqft | Sold | Price | $/sf | Match |
|---|---|---|---|---|---|---|---|
| 451 20th St | 0.15mi | 3/1.0 | 1,440 (+4%) | 2mo | $85,000 | $59 | 80 |
| 628 20th St | 0.32mi | 3/2.0 | 1,328 (-4%) | 1mo | $115,000 | $87 | 78 |
| 527 23rd St | 0.36mi | 4/2.0 (+1) | 1,488 (+8%) | 1mo | $154,000 | $103 | 65 |
| 435 13th St | 0.28mi | 4/2.0 (+1) | 1,512 (+10%) | 2mo | $40,000 | $26 | 65 |
| 1146 Haeberle Ave | 0.54mi | 3/1.0 | 1,408 (+2%) | 4mo | $115,000 | $82 | 64 |
| 1013 13th St | 0.68mi | 3/1.0 | 1,352 (-2%) | 3mo | $97,000 | $72 | 58 |
| 1148 Haeberle Ave | 0.53mi | 3/1.0 | 1,302 (-6%) | 4mo | $85,000 | $65 | 58 |
| 724 17th St | 0.41mi | 3/1.5 | 1,179 (-15%) | 4mo | $70,000 | $59 | 52 |
| 442 26th St | 0.50mi | 2/1.0 (-1) | 1,248 (-10%) | 2mo | $130,000 | $104 | 50 |
| 605 29th St | 0.74mi | 4/1.0 (+1) | 1,320 (-4%) | 3mo | $130,000 | $98 | 46 |
| 552 29th St | 0.70mi | 3/2.0 | 1,573 (+14%) | 4mo | $140,000 | $89 | 41 |
| 2487 Grand Ave | 0.66mi | 4/1.5 (+1) | 1,188 (-14%) | 1mo | $169,900 | $143 | 38 |
Match score weights: distance 35% · size 25% · config 20% · recency 20%. Top-matched comps best support the ARV.
Projected returns pro-forma
-3.0% appreciation · 3.0% rent growth · sell at horizon
- IRR
- -7.2%
- Equity multiple
- 0.73×
- Total profit
- $-8,561
- Equity at exit
- $17,147
- IRR
- 2.5%
- Equity multiple
- 1.18×
- Total profit
- $5,724
- Equity at exit
- $9,943
Cash invested: $32,200 (down + closing). Projections, not guarantees.
Landlord ↔ Tenant lean methodology
- Overall (STATE)
- 15 Strongly Tenant-Friendly
- State New York
- 15 Strongly Tenant-Friendly · D+10
- County
- — inherits STATE
- City
- — inherits STATE
ZIP-level market 14303
- Home prices YoY
- -1.7%
- Active inventory
- 74
- Price-to-rent
- 7.3×
Monthly cashflow live
- Estimated rent
- $1,317 high interval (Pro) →
- Mortgage (P&I)
- −$603
- Tax from tax record
- −$233 /mo · $2,792/yr
- Insurance
- −$48
- HOA
- −$0
- Vacancy / Maint / Mgmt
- −$277
- Net cashflow
- $157
Break-even live
UW: 25.0% down · 7.5% · 30yr · 1.5% tax · 5.0% vac · 8.0% maint · 8.0% mgmt
Financing live
Cash to close
- Down payment
- $28,750
- Closing costs
- $3,450
- Reserves months
- —
- Total cash needed
- —
Loan-product check · same deal, 3 products live
Conventional
25% down · 7.5% · 30yr
- Down + closing
- —
- Monthly P&I
- —
- Monthly cashflow
- —
- DSCR
- —
- Eligible?
- —
Personal DTI + credit; lowest rate.
DSCR
20% down · 8.5% · 30yr
- Down + closing
- —
- Monthly P&I
- —
- Monthly cashflow
- —
- DSCR
- —
- Eligible?
- —
No personal income docs; deal must DSCR.
Hard money
10% down · 12.0% · 12mo
- Down + closing
- —
- Monthly P&I
- —
- Monthly cashflow
- —
- DSCR
- —
- Eligible?
- —
Short-term bridge; refi at stabilization.
Rent comps 19 comps
| Address | Beds | Baths | Sqft | Rent | $/sqft | DOM | Units | Dist |
|---|---|---|---|---|---|---|---|---|
| 1427 Fort Ave Unit 2 Niagara Falls, NY | 3.0 | 1.0 | 1058 | $950 | $0.90 | 43d | 1 | 0.18mi |
| 1780 Falls St Niagara Falls, NY | 2.0 | 1.0 | 1100 | $1,200 | $1.09 | 43d | 1 | 0.19mi |
| 420 25th St Niagara Falls, NY | 3.0 | 1.0 | 1101 | $1,500 | $1.36 | 43d | 1 | 0.42mi |
| 769 19th St Niagara Falls, NY | 2.0 | 1.5 | 960 | $1,400 | $1.46 | 21d | 1 | 0.49mi |
| 754 15th St Niagara Falls, NY | 3.0 | 1.0 | 990 | $1,100 | $1.11 | 23d | 1 | 0.50mi |
| 2420 Mackenna Ave Unit 1 Niagara Falls, NY | 4.0 | 1.0 | 1300 | $1,390 | $1.07 | 1d | 1 | 0.51mi |
| 784 15th St Niagara Falls, NY | 3.0 | 1.5 | 1380 | $1,350 | $0.98 | 3d | 1 | 0.57mi |
| 1001 17th St Niagara Falls, NY | 3.0 | 1.0 | 1152 | $1,800 | $1.56 | 23d | 1 | 0.59mi |
| 2020 Forest Ave Niagara Falls, NY | 4.0 | 2.0 | 1600 | $1,500 | $0.94 | 17d | 1 | 0.59mi |
| 2727 Monroe Ave Niagara Falls, NY | 3.0 | 1.0 | 960 | $1,500 | $1.56 | 10d | 1 | 0.60mi |
| 724 Augustus Pl Niagara Falls, NY | 4.0 | 1.0 | 1200 | $1,500 | $1.25 | 43d | 1 | 0.73mi |
| 1808 Whitney Ave Unit 3 Niagara Falls, NY | 2.0 | 1.0 | 1200 | $900 | $0.75 | 43d | 1 | 0.75mi |
| 3036 Welch Ave Niagara Falls, NY | 3.0 | 1.0 | 1000 | $1,500 | $1.50 | 1d | 1 | 0.82mi |
| 2473 Pierce Ave Unit 2 Niagara Falls, NY | 2.0 | 1.0 | 1000 | $1,200 | $1.20 | 3d | 1 | 0.92mi |
| 642 Ashland Ave Niagara Falls, NY | 3.0 | 1.0 | 1238 | $1,100 | $0.89 | 3d | 1 | 1.07mi |
| 3340 Simmons Ave Niagara Falls, NY | 3.0 | 1.0 | 1008 | $1,550 | $1.54 | 14d | 1 | 1.09mi |
| 2463 South Ave Niagara Falls, NY | 2.0 | 1.0 | 1008 | $1,100 | $1.09 | 17d | 1 | 1.19mi |
| 1817 Ontario Ave Unit 2 Niagara Falls, NY | 2.0 | 1.0 | 985 | $1,899 | $1.93 | 1d | 1 | 1.27mi |
| 1817 Ontario Ave Unit 1 Niagara Falls, NY | 2.0 | 1.0 | 999 | $1,899 | $1.90 | 1d | 1 | 1.27mi |
Listing history 2 events
-
2026-06-19remarks 315-char remark
-
2026-06-19$115,000 Active 1 DOM
ⓘ Source: listings_history table (triggers on properties + properties_extension) + one-shot
backfill from property_details.listing_events for pre-trigger history.
Tax reassessment forecast NY · Partial reset (capped growth)
- Current annual tax
- $2,792 · $233/mo
- Projected year-2 tax
- $2,792 · $233/mo
- Expected delta
- $0/yr ($0/mo · 0.0%)
ⓘ Screening estimate from a state-policy table — verify with the county assessor before closing.
Climate risk First Street
- Flood 1/10 Low FEMA zone X (unshaded) · 0% chance over 30 yrs
- Wildfire 3/10 Moderate
- Heat 2/10 Low 7 d/yr ≥94°F today · 15 d/yr by 30 yrs out
- Wind 1/10 Low
- Air quality 3/10 Moderate 2 unhealthy d/yr today · 3 by 30 yrs out
Nearby sold comps map
Loading sold comps map…
Walkable amenities ~0.75 mi
Loading nearby amenities…
Taxation est. · year 1
- Rental income
- $15,807
- − Mortgage interest
- −$6,442
- − Property taxes
- −$2,792
- − Insurance
- −$575
- − Repairs & maintenance
- −$1,265
- − Management
- −$1,265
- − Depreciation
- −$3,345
- Taxable income
- $124
- Est. tax owed @ 24.0%
- −$30
- After-tax cash flow
- $1,854/yr
For passive investors: Depreciation is non-cash, so a rental often shows a tax loss while cash-flowing — sheltering income. Rental losses are passive: they offset passive income freely, and up to $25,000/yr can offset ordinary (W-2) income if you actively participate and your MAGI is under $100k (phasing out to $0 by $150k); unused losses carry forward. On sale, claimed depreciation is recaptured at up to 25%, and gains may owe capital-gains tax (a 1031 exchange can defer both). Figures are a year-1 estimate at your 24.0% rate — not tax advice; consult a CPA.
Schools (NCES district)
- District
- Niagara Falls City School District
- NCES district ID
- 3620820
- Math proficiency
- 26% ▼ -10.00%
- Reading proficiency
- 34% ▲ 3.00%
- Median HH income
- $32,488
- Composite
- 24.5/100
- National rank
- #7655
- State rank
- #578 of 590 in NY
Livability — Niagara Falls
- Score
- 60/100
- State rank
- #956
- US rank
- #18749
Category grades
Schools grade is shown separately in the Schools card above.
Census & demographics
- Census place
- Niagara Falls, NY
- County
- Niagara County · 157,377 people
- City population
- 62,983
- Metro
- Buffalo-Cheektowaga, NY
- Population (ZIP)
- 6,156
- Household income
- $45,646
- Rent vs Own
- Severe rent burden
- 230.0
Population outlook (Niagara County) Hauer SSP2
- Today (2025)
- 204,149 people
- By 2030
- 197,900 · -3.1%
- By 2040
- 182,239 · -10.7%
- By 2050
- 165,198 · -19.1%
- By 2075
- 129,416 · -36.6%
- By 2100
- 96,222 · -52.9%
Race, ethnicity, and origin ACS 2023
- Neighborhood character
- Diverse neighborhood (Simpson 0.68)
- Race & ethnicity
- White 53% Two or more races 18% Hispanic / Latino 15% Black 12% Asian 4% Native American 1%
- Hispanic origin (detail)
- Mexican 6% Puerto Rican 6%
- Common ancestry
- Romanian 12% Lithuanian 2% Iranian 1%
- Foreign-born
- 3%
- Languages at home
- 93% English-only · Other Indo-European 3% Spanish 3% Russian/Polish/Slavic 1%
Political lean MEDSL · Niagara
- 2024 margin
- R (+14.9) · D 42.5% · R 57.5%
- 2008→2024 swing
- -15.9pp toward R · 2008: 1.0pp · 2024: -14.9pp
- All cycles
- 2024: R+14.9 2020: R+9.7 2016: R+19.0 2012: D+0.6 2008: D+1.0
Not yet ingested
- Civics
- —
Market trends
- HPI YoY
- ▼ -5.37%
- Current HPI
- 311.8094
- Rent YoY
- —
- Metro
- Buffalo-Cheektowaga, NY
- State GDP YoY
- ▲ 2.60%
- F500 in state
- 92
Industry mix (Fortune 500 HQ in NY)
| Industry | F500 HQs | Revenue |
|---|---|---|
| Financial Services | 10 | $950B |
|
||
| Consumer Goods | 9 | $162B |
|
||
| Insurance | 4 | $225B |
|
||
| Telecommunications | 2 | $144B |
|
||
| Pharmaceuticals | 2 | $112B |
|
||
| Media / Entertainment | 2 | $69B |
|
||
Price history
+188.2% since first listed9 events — show timeline
- 2026-06-18 Listed $115,000 WNYREIS
- 2015-06-19 Sold (Public Records) $49,300 Public Records
- 2015-06-19 Sold (Public Records) $31,000 Public Records
- 2015-01-30 Sold (MLS) $25,000 WNYREIS
- 2015-01-27 Sold (Public Records) $25,000 Public Records
- 2014-10-21 Listed $32,900 WNYREIS
- 2014-03-28 Listing Removed — WNYREIS
- 2014-03-26 Listed $37,900 WNYREIS
- 2013-09-09 Listed $39,900 WNYREIS
Property tax history
+6.9%/yrLatest (2025): $2,792 · +33.2% YoY. Source: county tax records.
Cash-flow waterfall
monthlySold comps — $/sqft
last 12 mo · ≤1 miLoading sold comps…