 Duplex
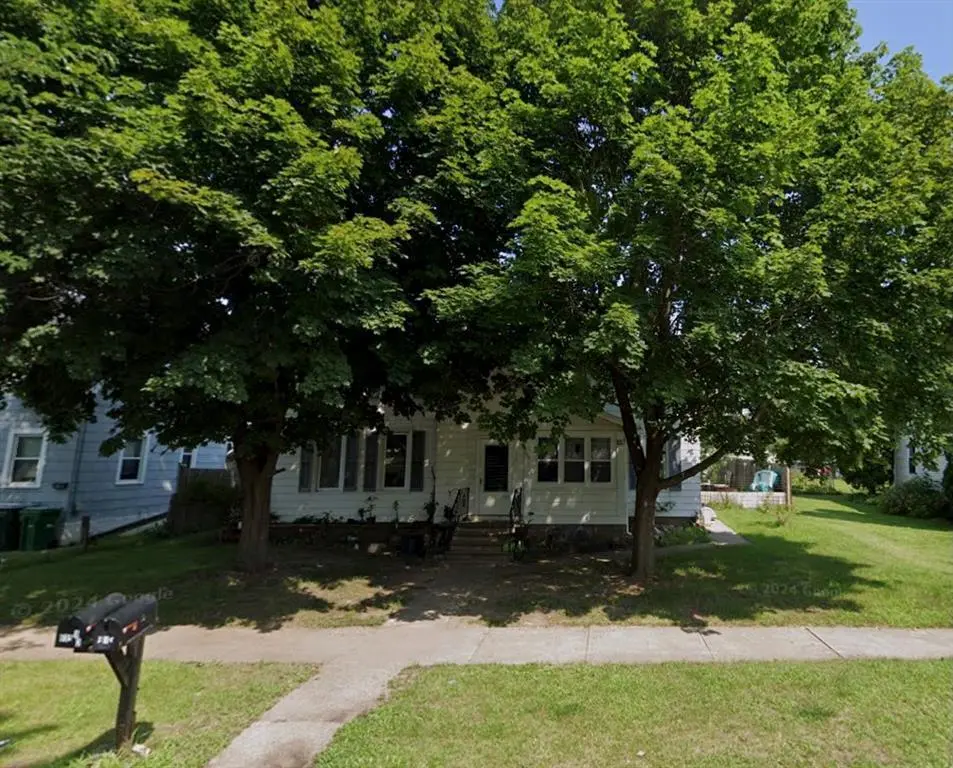
635 Centre St Unit 1 & 2 · Eau Claire, WI
Flood risk 1/10 · Minimal
- FEMA flood zone
- X (unshaded)
- Chance of flooding over 30 yrs
- 0.0%
- Est. flood insurance / yr
- $473 – $860
Fire risk 1/10 · Minimal
- Est. fire insurance / yr
- $636 – $1,182
Heat risk 2/10 · Minimal
- Hot days now (above 97°F)
- 7 days/yr
- Hot days in 30 yrs
- 14 days/yr
Wind risk 1/10 · Minimal
- Chance of severe wind over 30 yrs
- —
Air-quality risk 2/10 · Minimal
- Unhealthy air days now
- 1 days/yr
- Unhealthy air days in 30 yrs
- 1 days/yr
Risk factors via First Street. Map © Google.
Why this score? — see what drove the B+ grade
The composite is a weighted blend of 9 inputs, each scored 0–100. Each bar is that input's sub-score; the figure is the points it added to the 100-point composite (weight × sub-score).
- Cash flow +30.0/30.0
- ARV discount +13.0/15.0
- 1% rule +10.0/10.0
- DSCR +10.0/10.0
- Livability +4.5/5.0
- Schools +3.5/10.0
- Rent growth +3.0/5.0
- Condition / age +2.2/5.0
- Appreciation +0.0/10.0
$199,900
🖨 Deal sheet (PDF) 📄 Offer letter ✓ Due diligence
Multi-family units
County records classify this as Multi-Family (2-4 Unit). Listing-text estimate: 2 units. confirmed
Listing remarks MLS
Great investment opportunity with this well-maintained duplex on Centre St! Both units have long-term tenants on month-to-month leases, providing steady income with flexibility for future use. The main level offers 3 bedrooms, 1 full bath, an enclosed porch, and access to a partial basement with laundry (washer & dryer included). The upper unit features 2 bedrooms and 1 bath. Tenants pay for all utilities, while landlord covers sewer, keeping expenses simple. Outside, enjoy a large garden area and lean-to. Conveniently located near Birch St and Starr Ave with quick access to bus routes. Great opportunity for investors looking to expand their portfolio or for an owner-occupant seeking to live in one unit while generating rental income from the other.
Key facts
- Partial basement
- Enclosed porch
- Large garden area
Tags
Neighborhood map
What this means for you Summary
Snapshot
- This is a 2 × 2-bed/1.0-bath units multifamily listed at $200k. Condition is rated fair.
Deal economics
- At list price, monthly cash flow is $1k ($15k/yr) — positive. Per door: $610/mo.
- The deal already cash-flows at list — no discount required.
- Meets the 1% rule at list price ($3k rent vs $200k).
- Recommended offer: $176k (12.0% below list) — sets the bar for market timing.
- Cap rate 13.6% vs local median 2.4% in Eau Claire — top-decile yield for the area; either an underpriced asset or a hidden risk that comps aren't pricing in. Stress-test before assuming the spread holds.
Location & tenants
- Location reads 89/100 on livability (#10 in WI, #121 nationally) — a professional / high-income tenant draw. Strengths: amenities A+, cost of living A+, housing A+.
- Eau Claire Area School District (urban): math 38% / reading 43% proficiency, ranked #150 of 342 in WI (top 44%) — families likely to look elsewhere, expect single-tenant / working-renter base with shorter leases.
- Market conditions: Rents rising (+2.0%/yr); 212 active listings in the ZIP; 583 units permitted in Eau Claire County in 2024 (325 in 5+ unit buildings).
- At $3,294/mo this rent would consume 55% of the median local household income ($72k/yr) (locally 1614% of renters already pay >50% of income on rent) — very limited rent-growth headroom before tenants either downsize or default.
Forward outlook
- Local home prices are declining (-3.0%/yr); year-one equity from $1k of loan paydown is wiped out by about $6k of value loss. Plan a longer hold.
- Eau Claire County population projected at +14% by 2050 — modest demand growth; plan on rents tracking national, not racing it.
- At projected returns (-3.0% appreciation + 2.0% rent growth), your $56k cash investment doubles in ~5 years — after that, you're playing with house money.
Negotiation context
- It's been on market 287 days — a 12% lower offer ($176k) is reasonable based on typical stale-listing flexibility.
Risks & watch-outs
- Watch-outs: built in 1886 — expect roof / HVAC / electrical / plumbing capex.
Questions for the listing agent
- It's been on market 287 days. Have you received any prior offers? Is the seller open to a 12% concession, seller financing, or rate buy-down credit?
- Can we see the unit-by-unit rent roll, current vacancy, and any below-market leases? What's the average tenancy length?
- What capital expenditures (roof, boiler, parking lot, exteriors) have been made in the last 5 years, and what's planned in the next 2?
- Have any recent inspections been done? Can we get a copy of the seller's disclosures and any deferred-maintenance estimates?
- Built in 1886 — when were the roof, HVAC, electrical panel, plumbing, and water heater last replaced?
- Why hasn't it sold? Are there any deal-killer items the seller is aware of (foundation, flood, title, zoning, code violations)?
- Is there a deadline driving the sale (1031 exchange, divorce, estate, relocation)? That informs how much negotiation room exists.
- Schools are B-rated — typically a magnet for longer-tenancy family renters. What's the average tenant stay here, and is there a school-zone premium baked into asking?
- What's the average days-on-market for RENTAL listings here right now (not sales)? A rising rental-DOM trend means longer vacancies and softer asking-rent achievability than the comps imply.
- What's the recent tenant-quality profile in this submarket — average credit score on applications, eviction rate, late-payment / NSF rate, and stable-employment percentage? A property-management company in the area should have these aggregated.
- How much new apartment / multifamily construction is in the pipeline within 1–3 miles? Heavy new supply (>2% of stock underway) typically softens rents 12–24 months out; light construction supports rent growth.
Investment metrics
- 1% rule
- 1.65% ✓
- Cap rate
- 13.62%
- Cash-on-cash
- 26.17%
- DSCR
- 2.16
- GRM
- 5.1
CMA / ARV
- ARV (median comp)
- $227,652
- List price
- $199,900
- Delta
- -12.19%
- Verdict
- UNDERPRICED
- Comps
- 20 within 1.0 mi
Show comp detail 8 sales within ~0.75 mi
| Address | Dist | Beds/Ba | Sqft | Sold | Price | $/sf | Match |
|---|---|---|---|---|---|---|---|
| 503 Dewey St Unit 1 & 2 | 0.43mi | 4/2.0 | 2,037 (-2%) | 5mo | $188,500 | $93 | 72 |
| 1150 E Madison St #3 | 0.25mi | 4/3.0 | 2,083 (+0%) | 14mo | $261,000 | $125 | 72 |
| 708 Jones St Unit 1 & 1/2 | 0.74mi | 4/2.0 | 2,024 (-2%) | 4mo | $145,000 | $72 | 58 |
| 1418 E Madison St Unit 1 & 2 | 0.30mi | 3/2.0 (-1) | 2,214 (+7%) | 20mo | $192,500 | $87 | 53 |
| 901 Barland St Unit 1&2 | 0.71mi | 4/2.0 | 2,118 (+2%) | 13mo | $265,000 | $125 | 52 |
| 1037 Barland St Unit 1 & 2 | 0.74mi | 3/2.0 (-1) | 2,095 (+1%) | 9mo | $222,500 | $106 | 51 |
| 517 Dodge St Unit 1 & 2 | 0.74mi | 5/2.0 (+1) | 1,932 (-7%) | 5mo | $157,500 | $82 | 44 |
| 1105 Barland St Unit 1-2 | 0.75mi | 5/2.0 (+1) | 1,768 (-15%) | 9mo | $145,000 | $82 | 28 |
Match score weights: distance 35% · size 25% · config 20% · recency 20%. Top-matched comps best support the ARV.
Projected returns pro-forma
-3.0% appreciation · 2.01% rent growth · sell at horizon
- IRR
- 18.8%
- Equity multiple
- 1.75×
- Total profit
- $42,161
- Equity at exit
- $29,806
- IRR
- 26.5%
- Equity multiple
- 3.21×
- Total profit
- $123,965
- Equity at exit
- $17,284
Cash invested: $55,972 (down + closing). Projections, not guarantees.
Landlord ↔ Tenant lean methodology
- Overall (STATE)
- 73 Landlord-Friendly
- State Wisconsin
- 73 Landlord-Friendly · R+2
- County
- — inherits STATE
- City
- — inherits STATE
ZIP-level market 54703
- Rents YoY
- 2.0%
- Active inventory
- 212
- Price-to-rent
- 10.1×
Monthly cashflow live
- Estimated rent
- $3,294 high interval (Pro) →
- Mortgage (P&I)
- −$1,048
- Tax est. 1.5%
- −$250 /mo · $2,998/yr
- Insurance
- −$83
- HOA
- −$0
- Vacancy / Maint / Mgmt
- −$692
- Net cashflow
- $1,221
Break-even live
Sensitivity live
| Price | -10% $1,359 | -5% $1,290 | +0% $1,221 | +5% $1,152 | +10% $1,083 |
|---|---|---|---|---|---|
| Rent | -10% $961 | -5% $1,091 | +0% $1,221 | +5% $1,351 | +10% $1,481 |
| Rate | -1.0pp $1,321 | -0.5pp $1,272 | base $1,221 | +0.5pp $1,169 | +1.0pp $1,116 |
2-unit breakdown (identical units grouped — click to expand)
| Units | Beds | Baths | Est. rent |
|---|---|---|---|
| 2× units | 2 | 1 | $3,294 |
| #1 | 2 | 1 | $1,647 |
| #2 | 2 | 1 | $1,647 |
| Total (2 units) | $3,294 | ||
UW: 25.0% down · 7.5% · 30yr · 1.5% tax · 5.0% vac · 8.0% maint · 8.0% mgmt
Financing live
Cash to close
- Down payment
- $49,975
- Closing costs
- $5,997
- Reserves months
- —
- Total cash needed
- —
Loan-product check · same deal, 3 products live
Conventional
25% down · 7.5% · 30yr
- Down + closing
- —
- Monthly P&I
- —
- Monthly cashflow
- —
- DSCR
- —
- Eligible?
- —
Personal DTI + credit; lowest rate.
DSCR
20% down · 8.5% · 30yr
- Down + closing
- —
- Monthly P&I
- —
- Monthly cashflow
- —
- DSCR
- —
- Eligible?
- —
No personal income docs; deal must DSCR.
Hard money
10% down · 12.0% · 12mo
- Down + closing
- —
- Monthly P&I
- —
- Monthly cashflow
- —
- DSCR
- —
- Eligible?
- —
Short-term bridge; refi at stabilization.
Listing history 16 events
-
2026-06-19days on market $199,900 Active 287 DOM
-
2026-06-18days on market $199,900 Active 286 DOM
-
2026-06-17days on market $199,900 Active 285 DOM
-
2026-06-16days on market $199,900 Active 284 DOM
-
2026-06-15days on market $199,900 Active 283 DOM
-
2026-06-13days on market $199,900 Active 280 DOM
-
2026-06-10days on market $199,900 Active 278 DOM
-
2026-06-09days on market $199,900 Active 277 DOM
-
2026-06-08days on market $199,900 Active 276 DOM
-
2026-06-07days on market $199,900 Active 275 DOM
-
2026-06-05days on market $199,900 Active 272 DOM
-
2026-06-02days on market $199,900 Active 270 DOM
-
2026-06-01days on market $199,900 Active 269 DOM
-
2026-05-31days on market $199,900 Active 268 DOM
-
2026-05-30days on market $199,900 Active 267 DOM
-
2025-09-05$199,900 Active 765-char remark
Show marketing remark (765 chars)
Great investment opportunity with this well-maintained duplex on Centre St! Both units have long-term tenants on month-to-month leases, providing steady income with flexibility for future use. The main level offers 3 bedrooms, 1 full bath, an enclosed porch, and access to a partial basement with laundry (washer & dryer included). The upper unit features 2 bedrooms and 1 bath. Tenants pay for all utilities, while landlord covers sewer, keeping expenses simple. Outside, enjoy a large garden area and lean-to. Conveniently located near Birch St and Starr Ave with quick access to bus routes. Great opportunity for investors looking to expand their portfolio or for an owner-occupant seeking to live in one unit while generating rental income from the other.
ⓘ Source: listings_history table (triggers on properties + properties_extension) + one-shot
backfill from property_details.listing_events for pre-trigger history.
Climate risk First Street
- Flood 1/10 Low FEMA zone X (unshaded) · 0% chance over 30 yrs
- Wildfire 1/10 Low
- Heat 2/10 Low 7 d/yr ≥97°F today · 14 d/yr by 30 yrs out
- Wind 1/10 Low
- Air quality 2/10 Low 1 unhealthy d/yr today · 1 by 30 yrs out
Nearby sold comps map
Loading sold comps map…
Walkable amenities ~0.75 mi
Loading nearby amenities…
Taxation est. · year 1
- Rental income
- $39,528
- − Mortgage interest
- −$11,198
- − Property taxes
- −$2,998
- − Insurance
- −$1,000
- − Repairs & maintenance
- −$3,162
- − Management
- −$3,162
- − Depreciation
- −$5,815
- Taxable income
- $12,193
- Est. tax owed @ 24.0%
- −$2,926
- After-tax cash flow
- $11,723/yr
For passive investors: Depreciation is non-cash, so a rental often shows a tax loss while cash-flowing — sheltering income. Rental losses are passive: they offset passive income freely, and up to $25,000/yr can offset ordinary (W-2) income if you actively participate and your MAGI is under $100k (phasing out to $0 by $150k); unused losses carry forward. On sale, claimed depreciation is recaptured at up to 25%, and gains may owe capital-gains tax (a 1031 exchange can defer both). Figures are a year-1 estimate at your 24.0% rate — not tax advice; consult a CPA.
Condition & rehab AI · 30 photos
The property is in fair condition with moderate repairs needed, primarily focusing on cleaning and minor repairs. Value can be increased with painting, flooring replacement, and landscaping improvements.
Repairs flagged
- Minor Kitchen countertops — Cluttered and need cleaning.
- Minor Bathroom shelves — Cluttered and need cleaning.
- Major Flooring — Worn and dirty, needs replacement or cleaning.
- Major Paint — Chipped and dirty, needs repainting.
- Minor Landscaping — Some areas could be pruned and cleaned up for better curb appeal.
Value-add opportunities
- Both Paint interior walls — Repainting interior walls can improve the overall appearance and increase both resale and rental value.
- Both Replace or clean flooring — New flooring or thorough cleaning can significantly improve the living space and increase both resale and rental value.
- Both Landscaping improvements — Aesthetic improvements to the landscaping can enhance curb appeal and increase both resale and rental value.
Renovation cost estimate screening
| Repair item | Severity | Est. cost |
|---|---|---|
| Kitchen countertops · Cluttered and need cleaning. | Minor | $500–3,000 |
| Bathroom shelves · Cluttered and need cleaning. | Minor | $500–3,000 |
| Flooring · Worn and dirty, needs replacement or cleaning. | Major | $15,000–50,000 |
| Paint · Chipped and dirty, needs repainting. | Major | $15,000–50,000 |
| Landscaping · Some areas could be pruned and cleaned up for better curb appeal. | Minor | $500–3,000 |
| Total estimated repair cost · 5 items | $31,500–109,000 |
Value-add ROI direction
- Both Paint interior walls — Repainting interior walls can improve the overall appearance and increase both resale and rental value. ↑
- Both Replace or clean flooring — New flooring or thorough cleaning can significantly improve the living space and increase both resale and rental value. ↑
- Both Landscaping improvements — Aesthetic improvements to the landscaping can enhance curb appeal and increase both resale and rental value. ↑
ⓘ Cost ranges are severity-bucket heuristics (US national rule-of-thumb). Get contractor quotes + a written scope before underwriting a rehab budget.
Schools (NCES district)
- District
- Eau Claire Area School District
- NCES district ID
- 5504050
- Math proficiency
- 38% ▼ -9.00%
- Reading proficiency
- 43% ▬ 0.00%
- Median HH income
- $48,206
- Composite
- 34.72/100
- National rank
- #5135
- State rank
- #150 of 342 in WI
Livability — Eau Claire
- Score
- 89/100
- State rank
- #10
- US rank
- #121
Category grades
Schools grade is shown separately in the Schools card above.
Census & demographics
- Census place
- Eau Claire, WI
- County
- Eau Claire County · 96,114 people
- City population
- 87,167
- Metro
- Eau Claire, WI
- Population (ZIP)
- 44,153
- Household income
- $71,518
- Rent vs Own
- Severe rent burden
- 1614.0
Population outlook (Eau Claire County) Hauer SSP2
- Today (2025)
- 109,006 people
- By 2030
- 112,587 · +3.3%
- By 2040
- 118,674 · +8.9%
- By 2050
- 124,085 · +13.8%
- By 2075
- 135,804 · +24.6%
- By 2100
- 139,875 · +28.3%
Race, ethnicity, and origin ACS 2023
- Neighborhood character
- Predominantly White (85%)
- Race & ethnicity
- White 85% Asian 6% Two or more races 4% Hispanic / Latino 4% Black 2%
- Common ancestry
- Portuguese 16% Romanian 5% Lithuanian 3%
- Foreign-born
- 3% · Canada, China
- Languages at home
- 92% English-only · Other Asian/Pacific 4% Spanish 3%
Political lean MEDSL · Eau Claire
- 2024 margin
- D (+10.6) · D 54.6% · R 44.0% · Other 1.4%
- 2008→2024 swing
- -11.6pp toward R · 2008: 22.1pp · 2024: 10.6pp
- All cycles
- 2024: D+10.6 2020: D+10.8 2016: D+7.3 2012: D+13.6 2008: D+22.1
Not yet ingested
- Civics
- —
Market trends
- HPI YoY
- ▼ -276.20%
- Current HPI
- 218.2747
- Rent YoY
- ▲ 2.01%
- Metro
- Eau Claire, WI
- State GDP YoY
- ▲ 2.10%
- F500 in state
- 20
Industry mix (Fortune 500 HQ in WI)
| Industry | F500 HQs | Revenue |
|---|---|---|
| Industrial Machinery | 4 | $23B |
|
||
| Industrial Technology | 2 | $36B |
|
||
| Insurance | 1 | $36B |
|
||
| Professional Services | 1 | $19B |
|
||
| Utilities | 1 | $9B |
|
||
| Consumer Goods | 1 | $3B |
|
||
Price history
1 event — show timeline
- 2025-09-05 Listed $199,900 RANWW
Cash-flow waterfall
monthlySold comps — $/sqft
last 12 mo · ≤1 miLoading sold comps…