 🔨 Auction
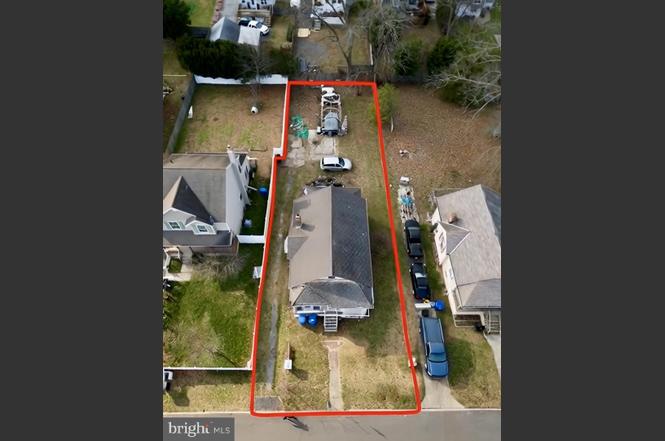
11 Errickson Ave · Moorestown-Lenola, NJ
Flood risk 1/10 · Minimal
- FEMA flood zone
- X (unshaded)
- Chance of flooding over 30 yrs
- 0.0%
- Est. flood insurance / yr
- $507 – $1,088
Fire risk 1/10 · Minimal
- Est. fire insurance / yr
- $526 – $976
Heat risk 6/10 · Moderate
- Hot days now (above 104°F)
- 7 days/yr
- Hot days in 30 yrs
- 14 days/yr
Wind risk 6/10 · Moderate
- Chance of severe wind over 30 yrs
- 52.0%
Air-quality risk 4/10 · Minor
- Unhealthy air days now
- 5 days/yr
- Unhealthy air days in 30 yrs
- 7 days/yr
Risk factors via First Street. Map © Google.
Why this score? — see what drove the F grade
The composite is a weighted blend of 9 inputs, each scored 0–100. Each bar is that input's sub-score; the figure is the points it added to the 100-point composite (weight × sub-score).
- ARV discount +7.5/15.0
- Cash flow +7.4/30.0
- Schools +5.5/10.0
- Rent growth +2.5/5.0
- Livability +2.5/5.0
- Condition / age +2.5/5.0
- 1% rule +1.6/10.0
- DSCR +1.5/10.0
- Appreciation +0.0/10.0
$75,000
🖨 Deal sheet 📄 Offer letter ✓ Due diligence
Listing remarks
Real Estate Auction – Moorestown, NJ Auction opportunity in Moorestown, New Jersey featuring a 50’ x 145’ lot with an existing dwelling. Property is being sold for land value. Bidding will begin at $75,000, plus buyer’s premium and required reimbursements. ✔ Pre-registration is required to bid ✔ Seller reserves the right to accept an acceptable offer and end the auction early ✔ Drive-by viewing only — do not enter the property Auction to commence on December 12th and conclude on December 22nd. Seller reserves the right to accept an acceptable bid and terminate the auction prior to the scheduled end date. Submit your bid today.
Key facts
- 7,248 sq ft lot
- 3 parking spots
- Built 1930
Neighborhood map
What this means for you Summary
Snapshot
- This is a 2-bed/1.0-bath single-family listed at $75k.
Deal economics
- At list price, monthly cash flow is $-377 ($-5k/yr) — negative.
- The deal already cash-flows at list — no discount required.
- Meets the 1% rule at list price ($2k rent vs $75k).
- Recommended offer: $74k (1.5% below list) — sets the bar for market timing.
- Cap rate 4.7% vs local median 3.0% in Moorestown-Lenola — top-decile yield for the area; either an underpriced asset or a hidden risk that comps aren't pricing in. Stress-test before assuming the spread holds.
Location & tenants
- Location reads: area grade F — affects rentability + tenant quality, not the cash-flow math above.
- Moorestown Township Public School District (suburban): math 51% / reading 63% proficiency, ranked #58 of 472 in NJ (top 12%) — acceptable for families but not a draw, mixed tenant base, ~2y average lease; only 7% free/reduced lunch — higher-income household profile.
- Market conditions: 117 active listings in the ZIP; 17 comparable units currently listed for rent nearby; rentals at typical pace (median 17d on market — plan ~3-4 weeks tenant-placement turnaround); high-income renter base; 2,161 units permitted in Burlington County in 2024 (988 in 5+ unit buildings).
- This rent is only 15% of the median local income ($159k/yr) — well below the 30% rent-burden line; pricing power to push rent on renewal without tenant pushback.
Forward outlook
- Local home prices are declining (-3.0%/yr); year-one equity from $2k of loan paydown is wiped out by about $9k of value loss. Plan a longer hold.
- Burlington County population projected to shrink 5% by 2050 — rents likely to lag national; underwrite the cash flow, not the appreciation.
Negotiation context
- It's been on market 16 days — a 2% lower offer ($74k) is reasonable based on typical stale-listing flexibility.
Risks & watch-outs
- Watch-outs: property tax is 4.0% of price; built in 1930 — expect roof / HVAC / electrical / plumbing capex.
- Climate carrying-cost: major wind risk, 52% chance of damaging wind over 30y; extreme-heat days projected 7→14/yr by 2055 (HVAC capex compounding) — expect insurance premiums to compound above CPI over the hold.
Questions for the listing agent
- What do current leases actually rent for vs. the listed asking? Can we see a recent rent roll and the last 12 months of T-12 income?
- Built in 1930 — when were the roof, HVAC, electrical panel, plumbing, and water heater last replaced?
- Property tax is high relative to price — has the assessment been appealed recently, and will the sale trigger a re-assessment?
- Is there a deadline driving the sale (1031 exchange, divorce, estate, relocation)? That informs how much negotiation room exists.
- The area grade is low — what's the realistic commute time and amenity access for the typical tenant pool here? Any planned neighborhood developments (good or bad) we should know about?
- What's the average days-on-market for RENTAL listings here right now (not sales)? A rising rental-DOM trend means longer vacancies and softer asking-rent achievability than the comps imply.
- What's the recent tenant-quality profile in this submarket — average credit score on applications, eviction rate, late-payment / NSF rate, and stable-employment percentage? A property-management company in the area should have these aggregated.
- How much new for-sale + rental construction is in the pipeline within 1–3 miles? Heavy new supply typically softens prices + rents 12–24 months out; constrained supply supports both.
Investment metrics
- 1% rule
- 0.66% ✗
- Cap rate
- 4.75%
- Cash-on-cash
- -5.52%
- DSCR
- 0.75
- GRM
- 12.6
CMA / ARV
- ARV (on-the-fly)
- $293,284
- Comps found
- 5
Show comp detail 5 sales within ~0.75 mi
| Address | Dist | Beds/Ba | Sqft | Sold | Price | $/sf | Match |
|---|---|---|---|---|---|---|---|
| 106 Pine St | 0.33mi | 2/1.0 | 979 (+8%) | 2mo | $344,400 | $352 | 70 |
| 124 E Wilson Ave | 0.15mi | 2/1.0 | 1,024 (+13%) | 5mo | $355,000 | $347 | 67 |
| 206 Moore St | 0.17mi | 3/1.0 (+1) | 928 (+2%) | 23mo | $270,000 | $291 | 64 |
| 213 E Camden Ave | 0.37mi | 3/1.0 (+1) | 960 (+6%) | 23mo | $310,000 | $323 | 49 |
| 21 N Holly Ave | 0.74mi | 2/1.0 | 980 (+8%) | 12mo | $260,000 | $265 | 43 |
Match score weights: distance 35% · size 25% · config 20% · recency 20%. Top-matched comps best support the ARV.
Projected returns pro-forma
-3.0% appreciation · 3.0% rent growth · sell at horizon
- IRR
- -25.8%
- Equity multiple
- 0.13×
- Total profit
- $-71,607
- Equity at exit
- $43,730
- IRR
- -22.4%
- Equity multiple
- -0.14×
- Total profit
- $-93,485
- Equity at exit
- $25,358
Cash invested: $82,120 (down + closing). Projections, not guarantees.
Landlord ↔ Tenant lean methodology
- Overall (STATE)
- 21 Tenant-Leaning
- State New Jersey
- 21 Tenant-Leaning · D+6
- County
- — inherits STATE
- City
- — inherits STATE
ZIP-level market 08057
- Active inventory
- 117
- Price-to-rent
- 3.2×
Monthly cashflow live
- Estimated rent
- $1,937 high interval (Pro) →
- Mortgage (P&I)
- −$1,538
- Tax from tax record
- −$248 /mo · $2,972/yr
- Insurance
- −$122
- HOA
- −$0
- Vacancy / Maint / Mgmt
- −$407
- Net cashflow
- $-377
Break-even live
UW: 25.0% down · 7.5% · 30yr · 1.5% tax · 5.0% vac · 8.0% maint · 8.0% mgmt
Financing live
Cash to close
- Down payment
- $73,321
- Closing costs
- $8,799
- Reserves months
- —
- Total cash needed
- —
Loan-product check · same deal, 3 products live
Conventional
25% down · 7.5% · 30yr
- Down + closing
- —
- Monthly P&I
- —
- Monthly cashflow
- —
- DSCR
- —
- Eligible?
- —
Personal DTI + credit; lowest rate.
DSCR
20% down · 8.5% · 30yr
- Down + closing
- —
- Monthly P&I
- —
- Monthly cashflow
- —
- DSCR
- —
- Eligible?
- —
No personal income docs; deal must DSCR.
Hard money
10% down · 12.0% · 12mo
- Down + closing
- —
- Monthly P&I
- —
- Monthly cashflow
- —
- DSCR
- —
- Eligible?
- —
Short-term bridge; refi at stabilization.
Rent comps 17 comps
| Address | Beds | Baths | Sqft | Rent | $/sqft | DOM | Units | Dist |
|---|---|---|---|---|---|---|---|---|
| 138 New Albany Rd Moorestown, NJ | 2.0 | 1.5 | 1080 | $2,355 | $2.18 | 2d | 4 | 0.17mi |
| 100 Andrews Ave Moorestown, NJ | 2.0 | 1.0 | 1000 | $1,959 | $1.96 | 43d | 1 | 0.22mi |
| 101 E Camden Ave Moorestown, NJ | 2.0 | 1.0 | 850 | $1,995 | $2.35 | 14d | 1 | 0.31mi |
| 106 W Camden Ave Unit TOP Moorestown, NJ | 1.0 | 1.0 | 700 | $1,600 | $2.29 | 43d | 1 | 0.32mi |
| 12 S Lenola Rd Moorestown, NJ | 2.0 | 1.0 | 864 | $1,900 | $2.20 | 24d | 1 | 0.34mi |
| 711-717 E Main St Unit 711-3 Maple Shade, NJ | 1.0 | 1.0 | 675 | $1,425 | $2.11 | 24d | 1 | 0.69mi |
| 717 E Main St Maple Shade, NJ | 1.0 | 1.0 | 675 | $1,438 | $2.13 | 16d | 2 | 0.69mi |
| 717 E Main St Unit 1BR Maple Shade, NJ | 1.0 | 1.0 | 650 | $1,450 | $2.23 | 2d | 1 | 0.69mi |
| 711-717 E Main St Unit 715-5 Maple Shade, NJ | 1.0 | 1.0 | 675 | $1,450 | $2.15 | 24d | 1 | 0.69mi |
| 220 S Lenola Rd Maple Shade, NJ | 2.0 | 1.0–2.0 | 640 | $1,928 | $3.01 | 1d | 16 | 0.81mi |
| 500 E Camden Ave Moorestown, NJ | 2.0 | 1.0 | 765 | $1,882 | $2.46 | 5d | 6 | 0.88mi |
| 124 Stiles Ave Maple Shade, NJ | 2.0 | 1.0 | 1105 | $1,999 | $1.81 | 5d | 1 | 0.88mi |
| 100 Fox Meadow Dr Maple Shade, NJ | 1.0–3.0 | 1.0 | 780 | $1,838 | $2.36 | 5d | 13 | 0.95mi |
| 2000 Maplewood Dr Maple Shade, NJ | 1.0–2.0 | 1.0–1.5 | 1072 | $2,480 | $2.31 | 24d | 1 | 1.22mi |
| 1330 E Kings Hwy Maple Shade, NJ | 1.0 | 1.0 | 805 | $1,665 | $2.07 | 17d | 1 | 1.39mi |
| 1330 E Kings Hwy Apt 1805 Maple Shade, NJ | 1.0 | 1.0 | 805 | $1,690 | $2.10 | 16d | 1 | 1.41mi |
| 11 E Rudderow Ave Maple Shade, NJ | 1.0 | 1.0 | 720 | $1,572 | $2.18 | 24d | 1 | 1.46mi |
Listing history 3 events
-
2025-12-26status Pending
-
2025-12-11$75,000 Active
-
2025-12-10historical $75,000
ⓘ Source: listings_history table (triggers on properties + properties_extension) + one-shot
backfill from property_details.listing_events for pre-trigger history.
Tax reassessment forecast NJ · Partial reset (capped growth)
- Current annual tax
- $2,972 · $248/mo
- Projected year-2 tax
- $2,972 · $248/mo
- Expected delta
- $0/yr ($0/mo · 0.0%)
ⓘ Screening estimate from a state-policy table — verify with the county assessor before closing.
Climate risk First Street
- Flood 1/10 Low FEMA zone X (unshaded) · 0% chance over 30 yrs
- Wildfire 1/10 Low
- Heat 6/10 Major 7 d/yr ≥104°F today · 14 d/yr by 30 yrs out
- Wind 6/10 Major 52% chance of damaging wind over 30 yrs
- Air quality 4/10 Moderate 5 unhealthy d/yr today · 7 by 30 yrs out
Nearby sold comps map
Loading sold comps map…
Walkable amenities ~0.75 mi
Loading nearby amenities…
Taxation est. · year 1
- Rental income
- $23,248
- − Mortgage interest
- −$16,428
- − Property taxes
- −$2,972
- − Insurance
- −$1,466
- − Repairs & maintenance
- −$1,860
- − Management
- −$1,860
- − Depreciation
- −$8,532
- Taxable loss
- −$9,871
- Est. tax savings @ 24.0%
- +$2,369
- After-tax cash flow
- $-2,160/yr
For passive investors: Depreciation is non-cash, so a rental often shows a tax loss while cash-flowing — sheltering income. Rental losses are passive: they offset passive income freely, and up to $25,000/yr can offset ordinary (W-2) income if you actively participate and your MAGI is under $100k (phasing out to $0 by $150k); unused losses carry forward. On sale, claimed depreciation is recaptured at up to 25%, and gains may owe capital-gains tax (a 1031 exchange can defer both). Figures are a year-1 estimate at your 24.0% rate — not tax advice; consult a CPA.
Schools (NCES district)
- District
- Moorestown Township Public School District
- NCES district ID
- 3410710
- Math proficiency
- 51% ▼ -19.00%
- Reading proficiency
- 63% ▼ -13.00%
- Median HH income
- $115,968
- Composite
- 54.85/100
- National rank
- #1313
- State rank
- #58 of 472 in NJ
Livability — Moorestown-Lenola
No livability data for this city. (Only ~50 U.S. cities are tracked.)
Census & demographics
- Census place
- Moorestown-Lenola, NJ
- County
- Burlington County · 323,710 people
- City population
- 20,990
- Metro
- Philadelphia-Camden-Wilmington, PA-NJ-DE-MD
- Population (ZIP)
- 21,529
- Household income
- $158,770
- Rent vs Own
- Severe rent burden
- 470.0
Population outlook (Burlington County) Hauer SSP2
- Today (2025)
- 453,425 people
- By 2030
- 452,359 · -0.2%
- By 2040
- 445,033 · -1.9%
- By 2050
- 431,760 · -4.8%
- By 2075
- 406,277 · -10.4%
- By 2100
- 364,732 · -19.6%
Race, ethnicity, and origin ACS 2023
- Neighborhood character
- Predominantly White (77%)
- Race & ethnicity
- White 77% Asian 8% Two or more races 7% Hispanic / Latino 6% Black 5%
- Hispanic origin (detail)
- Mexican 1% Puerto Rican 2%
- Common ancestry
- Romanian 5% Scotch-Irish 2% Italian 2%
- Foreign-born
- 9% · Canada, China, South Korea
- Languages at home
- 86% English-only · Other Indo-European 4% Chinese 4% Spanish 3%
Political lean MEDSL · Burlington
- 2024 margin
- D (+16.6) · D 57.6% · R 41.0% · Other 1.3%
- 2008→2024 swing
- -2.0pp toward R · 2008: 18.6pp · 2024: 16.6pp
- All cycles
- 2024: D+16.6 2020: D+19.5 2016: D+14.8 2012: D+18.7 2008: D+18.6
Not yet ingested
- Civics
- —
Market trends
- HPI YoY
- ▼ -645.09%
- Current HPI
- 293.3163
- Rent YoY
- —
- Metro
- Philadelphia-Camden-Wilmington, PA-NJ-DE-MD
- State GDP YoY
- ▲ 2.05%
- F500 in state
- 34
Industry mix (Fortune 500 HQ in NJ)
| Industry | F500 HQs | Revenue |
|---|---|---|
| Consumer Goods | 3 | $31B |
|
||
| Pharmaceuticals | 2 | $153B |
|
||
| Technology | 2 | $21B |
|
||
| Insurance | 2 | $20B |
|
||
| Healthcare | 2 | $19B |
|
||
| Financial Services | 1 | $70B |
|
||
Price history
+0.0% since first listed3 events — show timeline
- 2025-12-26 Pending — BRIGHT MLS
- 2025-12-11 Listed $75,000 BRIGHT MLS
- 2025-12-10 Coming Soon $75,000 BRIGHT MLS
Property tax history
-0.5%/yrLatest (2025): $2,972 · +1.9% YoY. Source: county tax records.
Cash-flow waterfall
monthlySold comps — $/sqft
last 12 mo · ≤1 miLoading sold comps…