16152 Hull · Cumberland, OK
Flood risk 1/10 · Minimal
- FEMA flood zone
- X
- Chance of flooding over 30 yrs
- 0.0%
- Est. flood insurance / yr
- $507 – $1,088
Fire risk 4/10 · Minor
- Est. fire insurance / yr
- $2,463 – $4,575
Heat risk 6/10 · Moderate
- Hot days now (above 110°F)
- 7 days/yr
- Hot days in 30 yrs
- 18 days/yr
Wind risk 4/10 · Minor
- Chance of severe wind over 30 yrs
- 15.0%
Air-quality risk 3/10 · Minor
- Unhealthy air days now
- 2 days/yr
- Unhealthy air days in 30 yrs
- 3 days/yr
Risk factors via First Street. Map © Google.
Why this score? — see what drove the B- grade
The composite is a weighted blend of 9 inputs, each scored 0–100. Each bar is that input's sub-score; the figure is the points it added to the 100-point composite (weight × sub-score).
- Cash flow +30.0/30.0
- DSCR +10.0/10.0
- 1% rule +7.5/10.0
- ARV discount +7.5/15.0
- Appreciation +3.6/10.0
- Rent growth +2.5/5.0
- Livability +2.5/5.0
- Condition / age +2.5/5.0
- Schools +1.8/10.0
$74,900
🖨 Deal sheet 📄 Offer letter ✓ Due diligence
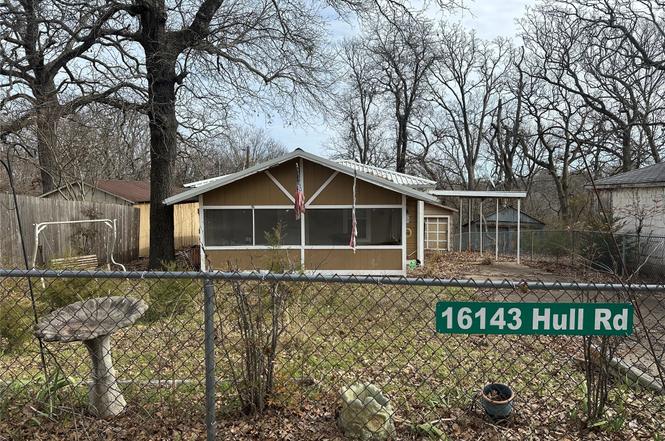
Listing remarks
Charming lake house close to the water!! Partially furnished, ready for family & friends to enjoy lake time. Lots of extras with this home. Lawnmower, Washer, Dryer, Refrigerator, Lawnmower & much more.
Key facts
- 5,500 sq ft lot
- Garage
- Built 1955
Property features AI
Exterior
- Parking: Detached garage; Carport
- Security: No safety shelter
- Utilities: Septic tank; Rural water
- Home design: Single-story; Faces west; Entry on main level
- Construction: Metal roof; Wood siding; Wood frame construction; Crawlspace and slab foundation; Built per public records
- Exterior features: Enclosed patio; Patio; Shed(s); Chain link and privacy fencing; Mature trees
Interior
- Kitchen: Oven; Range; Microwave; Refrigerator; Plumbed for ice maker
- Flooring: Carpet; Tile
- Bathrooms: 1 full bathroom
- Heating & cooling: Central air conditioning; Electric heating; Floor furnace
- Interior features: Ceiling fan(s); Solid surface counters; Vinyl windows; Electric oven and range connections; Electric water heater
- Laundry & utility: Washer hookup; Electric dryer hookup; Washer; Dryer
Neighborhood map
What this means for you Summary
Snapshot
- This is a 2-bed/1.0-bath single-family listed at $75k.
Deal economics
- At list price, monthly cash flow is $290 ($3k/yr) — positive.
- The deal already cash-flows at list — no discount required.
- Meets the 1% rule at list price ($933 rent vs $75k).
- Recommended offer: $70k (6.0% below list) — sets the bar for market timing.
Location & tenants
- Location reads: area grade B — affects rentability + tenant quality, not the cash-flow math above.
- Madill (town): math 20% / reading 22% proficiency, ranked #162 of 270 in OK (top 60%) — low school quality limits family demand, transient renter base, plan for 1-2y turnover; 61% free/reduced lunch — lower-income household profile, screen leases tightly.
- Market conditions: 105 active listings in the ZIP; 42 units permitted in Marshall County in 2024 (0 in 5+ unit buildings).
Forward outlook
- Local home prices are declining (-2.8%/yr); year-one equity from $518 of loan paydown is wiped out by about $2k of value loss. Plan a longer hold.
- Marshall County population projected at +22% by 2050 — long-run rental-demand tailwind backs the buy-and-hold thesis.
- At projected returns (-2.8% appreciation + 3.0% rent growth), your $21k cash investment doubles in ~7 years — after that, you're playing with house money.
Negotiation context
- It's been on market 69 days — a 6% lower offer ($70k) is reasonable based on typical stale-listing flexibility.
- 4 sale attempts; this cycle's ask has dropped $12k (14%) from the opening price — seller is motivated, your offer sets the floor, not the list.
- Current owner paid $15k; list at $75k implies a 399% gain — meaningful room to come down on a strong offer.
Risks & watch-outs
- Watch-outs: built in 1955 — expect roof / HVAC / electrical / plumbing capex.
- Climate carrying-cost: extreme-heat days projected 7→18/yr by 2055 (HVAC capex compounding) — expect insurance premiums to compound above CPI over the hold.
Questions for the listing agent
- It's been on market 69 days. Have you received any prior offers? Is the seller open to a 6% concession, seller financing, or rate buy-down credit?
- Built in 1955 — when were the roof, HVAC, electrical panel, plumbing, and water heater last replaced?
- Why hasn't it sold? Are there any deal-killer items the seller is aware of (foundation, flood, title, zoning, code violations)?
- Is there a deadline driving the sale (1031 exchange, divorce, estate, relocation)? That informs how much negotiation room exists.
- What's the average days-on-market for RENTAL listings here right now (not sales)? A rising rental-DOM trend means longer vacancies and softer asking-rent achievability than the comps imply.
- What's the recent tenant-quality profile in this submarket — average credit score on applications, eviction rate, late-payment / NSF rate, and stable-employment percentage? A property-management company in the area should have these aggregated.
- How much new for-sale + rental construction is in the pipeline within 1–3 miles? Heavy new supply typically softens prices + rents 12–24 months out; constrained supply supports both.
Investment metrics
- 1% rule
- 1.25% ✓
- Cap rate
- 10.94%
- Cash-on-cash
- 16.59%
- DSCR
- 1.74
- GRM
- 6.7
CMA / ARV
- ARV (on-the-fly)
- $12,600
- Comps found
- 1
Show comp detail 1 sale within ~0.75 mi
| Address | Dist | Beds/Ba | Sqft | Sold | Price | $/sf | Match |
|---|---|---|---|---|---|---|---|
| 2818 Freds Rd | 0.07mi | 2/1.0 | 849 (+1%) | 14mo | $13,000 | $15 | 83 |
Match score weights: distance 35% · size 25% · config 20% · recency 20%. Top-matched comps best support the ARV.
Projected returns pro-forma
-2.76% appreciation · 3.0% rent growth · sell at horizon
- IRR
- 8.4%
- Equity multiple
- 1.34×
- Total profit
- $7,046
- Equity at exit
- $11,963
- IRR
- 17.2%
- Equity multiple
- 2.45×
- Total profit
- $30,435
- Equity at exit
- $7,851
Cash invested: $20,972 (down + closing). Projections, not guarantees.
Landlord ↔ Tenant lean methodology
- Overall (STATE)
- 83 Strongly Landlord-Friendly
- State Oklahoma
- 83 Strongly Landlord-Friendly · R+20
- County
- — inherits STATE
- City
- — inherits STATE
ZIP-level market 73446
- Home prices YoY
- -1.4%
- Active inventory
- 105
- Price-to-rent
- 6.7×
Monthly cashflow live
- Estimated rent
- $933 medium interval (Pro) →
- Mortgage (P&I)
- −$393
- Tax from tax record
- −$23 /mo · $277/yr
- Insurance
- −$31
- HOA
- −$0
- Vacancy / Maint / Mgmt
- −$196
- Net cashflow
- $290
Break-even live
UW: 25.0% down · 7.5% · 30yr · 1.5% tax · 5.0% vac · 8.0% maint · 8.0% mgmt
Financing live
Cash to close
- Down payment
- $18,725
- Closing costs
- $2,247
- Reserves months
- —
- Total cash needed
- —
Loan-product check · same deal, 3 products live
Conventional
25% down · 7.5% · 30yr
- Down + closing
- —
- Monthly P&I
- —
- Monthly cashflow
- —
- DSCR
- —
- Eligible?
- —
Personal DTI + credit; lowest rate.
DSCR
20% down · 8.5% · 30yr
- Down + closing
- —
- Monthly P&I
- —
- Monthly cashflow
- —
- DSCR
- —
- Eligible?
- —
No personal income docs; deal must DSCR.
Hard money
10% down · 12.0% · 12mo
- Down + closing
- —
- Monthly P&I
- —
- Monthly cashflow
- —
- DSCR
- —
- Eligible?
- —
Short-term bridge; refi at stabilization.
Listing history 25 events
-
2026-06-18status $74,900 Pending 69 DOM
-
2026-06-18days on market $74,900 Active 69 DOM
-
2026-06-17days on market $74,900 Active 68 DOM
-
2026-06-16days on market $74,900 Active 67 DOM
-
2026-06-15days on market $74,900 Active 66 DOM
-
2026-06-14days on market $74,900 Active 64 DOM
-
2026-06-12days on market $74,900 Active 63 DOM
-
2026-06-09days on market $74,900 Active 60 DOM
-
2026-06-08days on market $74,900 Active 59 DOM
-
2026-06-07pricedays on market $74,900 Active 58 DOM
-
2026-06-05days on market $79,950 Active 55 DOM
-
2026-06-02days on market $79,950 Active 53 DOM
-
2026-06-01days on market $79,950 Active 52 DOM
-
2026-05-31days on market $79,950 Active 51 DOM
-
2026-05-30days on market $79,950 Active 50 DOM
-
2026-04-16price $79,950
-
2026-04-16status Active
-
2026-03-02status Pending
-
2026-02-24$87,000 Active
-
2026-02-23historical
-
2025-07-22$87,000 Active
-
2025-07-21historical
-
2025-07-15price $87,000
-
2025-01-21$99,900 Active
-
2007-10-23soldstatus $15,000
ⓘ Source: listings_history table (triggers on properties + properties_extension) + one-shot
backfill from property_details.listing_events for pre-trigger history.
Tax reassessment forecast OK · Resets to sale price
- Current annual tax
- $277 · $23/mo
- Projected year-2 tax
- $674 · $56/mo
- Expected delta
- +$397/yr (+$33/mo · 143.4%)
ⓘ Screening estimate from a state-policy table — verify with the county assessor before closing.
Climate risk First Street
- Flood 1/10 Low FEMA zone X · 0% chance over 30 yrs
- Wildfire 4/10 Moderate
- Heat 6/10 Major 7 d/yr ≥110°F today · 18 d/yr by 30 yrs out
- Wind 4/10 Moderate 15% chance of damaging wind over 30 yrs
- Air quality 3/10 Moderate 2 unhealthy d/yr today · 3 by 30 yrs out
Nearby sold comps map
Loading sold comps map…
Walkable amenities ~0.75 mi
Loading nearby amenities…
Taxation est. · year 1
- Rental income
- $11,195
- − Mortgage interest
- −$4,196
- − Property taxes
- −$277
- − Insurance
- −$374
- − Repairs & maintenance
- −$896
- − Management
- −$896
- − Depreciation
- −$2,179
- Taxable income
- $2,378
- Est. tax owed @ 24.0%
- −$571
- After-tax cash flow
- $2,908/yr
For passive investors: Depreciation is non-cash, so a rental often shows a tax loss while cash-flowing — sheltering income. Rental losses are passive: they offset passive income freely, and up to $25,000/yr can offset ordinary (W-2) income if you actively participate and your MAGI is under $100k (phasing out to $0 by $150k); unused losses carry forward. On sale, claimed depreciation is recaptured at up to 25%, and gains may owe capital-gains tax (a 1031 exchange can defer both). Figures are a year-1 estimate at your 24.0% rate — not tax advice; consult a CPA.
Schools (NCES district)
- District
- Madill
- NCES district ID
- 4018700
- Math proficiency
- 20% ▼ -17.00%
- Reading proficiency
- 22% ▼ -13.00%
- Median HH income
- $40,372
- Composite
- 17.82/100
- National rank
- #9008
- State rank
- #162 of 270 in OK
Livability — Cumberland
No livability data for this city. (Only ~50 U.S. cities are tracked.)
Census & demographics
- Census place
- Cumberland, OK
- Population (ZIP)
- 8,414
Population outlook (Marshall County) Hauer SSP2
- Today (2025)
- 17,405 people
- By 2030
- 18,038 · +3.6%
- By 2040
- 19,513 · +12.1%
- By 2050
- 21,283 · +22.3%
- By 2075
- 27,884 · +60.2%
- By 2100
- 35,435 · +103.6%
Race, ethnicity, and origin ACS 2023
- Neighborhood character
- Diverse neighborhood (Simpson 0.63)
- Race & ethnicity
- White 54% Hispanic / Latino 28% Two or more races 15% Native American 8%
- Hispanic origin (detail)
- Mexican 27%
- Common ancestry
- Iranian 1% Serbian 1% Lithuanian 1%
- Foreign-born
- 11% · Canada
- Languages at home
- 76% English-only · Spanish 22% German/W. Germanic 1%
Political lean MEDSL · Marshall
- 2024 margin
- Solid R (+63.4) · D 17.7% · R 81.2% · Other 1.1%
- 2008→2024 swing
- -24.6pp toward R · 2008: -38.8pp · 2024: -63.4pp
- All cycles
- 2024: R+63.4 2020: R+62.5 2016: R+56.6 2012: R+45.7 2008: R+38.8
Not yet ingested
- Civics
- —
Market trends
- HPI YoY
- ▼ -2.76%
- Current HPI
- 188.3049
- Rent YoY
- —
- Metro
- —
- State GDP YoY
- ▲ 1.55%
- F500 in state
- 6
Industry mix (Fortune 500 HQ in OK)
| Industry | F500 HQs | Revenue |
|---|---|---|
| Energy | 3 | $48B |
|
||
Price history
+433.0% since first listed10 events — show timeline
- 2026-04-16 Price Changed $79,950 MLS Technology, Inc.
- 2026-04-16 Relisted — MLS Technology, Inc.
- 2026-03-02 Pending — MLS Technology, Inc.
- 2026-02-24 Listed $87,000 MLS Technology, Inc.
- 2026-02-23 Listing Removed — MLS Technology, Inc.
- 2025-07-22 Listed $87,000 MLS Technology, Inc.
- 2025-07-21 Listing Removed — MLS Technology, Inc.
- 2025-07-15 Price Changed $87,000 MLS Technology, Inc.
- 2025-01-21 Listed $99,900 MLS Technology, Inc.
- 2007-10-23 Sold (Public Records) $15,000 Public Records
Property tax history
+6.3%/yrLatest (2025): $277 · +6.1% YoY. Source: county tax records.
Cash-flow waterfall
monthlySold comps — $/sqft
last 12 mo · ≤1 miLoading sold comps…