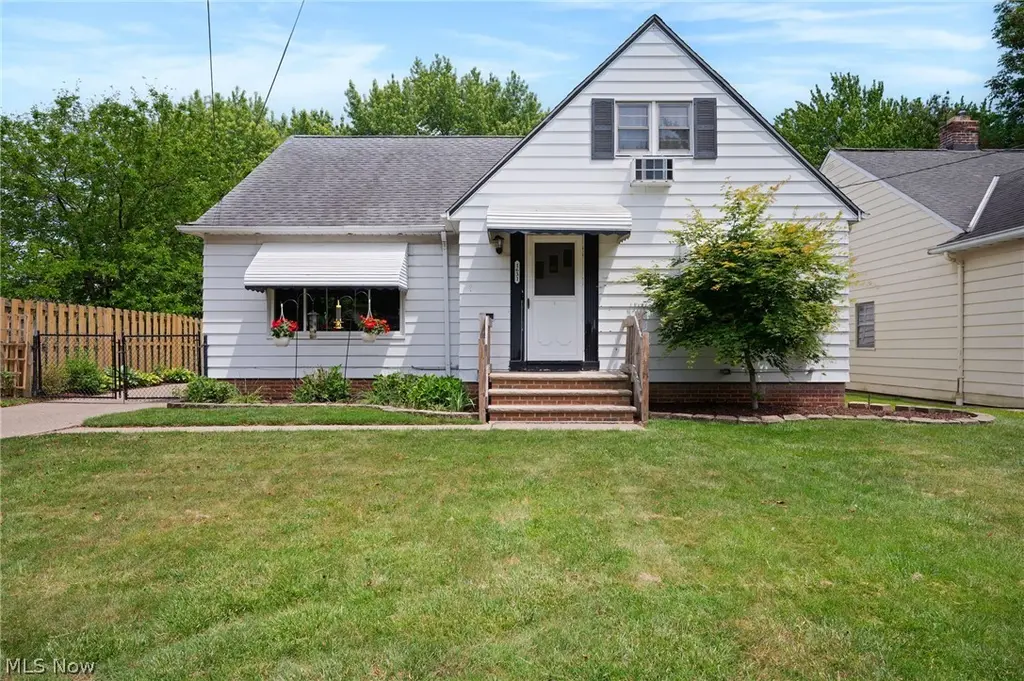
1631 Brainard Rd · Lyndhurst, OH
Flood risk 1/10 · Minimal
- FEMA flood zone
- X (unshaded)
- Chance of flooding over 30 yrs
- 0.0%
- Est. flood insurance / yr
- $507 – $1,088
Fire risk 1/10 · Minimal
- Est. fire insurance / yr
- $713 – $1,323
Heat risk 2/10 · Minimal
- Hot days now (above 96°F)
- 7 days/yr
- Hot days in 30 yrs
- 17 days/yr
Wind risk 1/10 · Minimal
- Chance of severe wind over 30 yrs
- —
Air-quality risk 3/10 · Minor
- Unhealthy air days now
- 2 days/yr
- Unhealthy air days in 30 yrs
- 5 days/yr
Risk factors via First Street. Map © Google.
Why this score? — see what drove the D+ grade
The composite is a weighted blend of 9 inputs, each scored 0–100. Each bar is that input's sub-score; the figure is the points it added to the 100-point composite (weight × sub-score).
- ARV discount +15.0/15.0
- Cash flow +12.5/30.0
- 1% rule +4.4/10.0
- Livability +4.1/5.0
- DSCR +3.7/10.0
- Rent growth +3.6/5.0
- Schools +3.1/10.0
- Condition / age +2.5/5.0
- Appreciation +0.0/10.0
$250,000
🖨 Deal sheet 📄 Offer letter ✓ Due diligence
Listing remarks MLS
Completely updated bungalow in the Lyndhurst community. Spacious and open family room with newly refinished hardwood floors. Formal dining area. Beautifully remodeled kitchen with stainless steel appliances. ceramic flooring, and KraftMaid cabinetry. Renovated full bath on first with ceramic tile flooring, tiled shower, and newer vanity. Two sizable bedrooms on the first floor with hardwood flooring. Fully finished owners suite on the second level with a separate bonus area, and an updated en-suite master bath with ceramic tiled walk-in shower. Loads of insulated storage on the second level. Expansive fully finished basement with 1/2 bathroom. Fully fenced backyard with 2.5 car garage. Patio area. Freshly painted throughout! Close to shopping, restaurants, and highway. Call for a private showing today! Welcome Home!
Key facts
- Outdoor dining
- Finished basement
- Fenced-in backyard
Tags
Property features AI
Exterior
- Parking: Detached garage; 2 garage spaces
- Utilities: Public water; Public sewer
- Home design: Two-story home; Vinyl siding
- Construction: Built per public records (year source: Public Records); Asphalt/fiberglass roof; Vinyl siding construction; Home warranty included
- Exterior features: Patio; Lot approximately 50 x 172
Interior
- Kitchen: Dishwasher; Range; Microwave; Refrigerator
- Bedrooms: 2 main-level bedrooms
- Bathrooms: 2 full bathrooms; 1 half bathroom; 1 bathroom on the main level
- Heating & cooling: Forced-air gas heating; Central air conditioning; Ceiling fans
- Interior features: Finished full basement; Decorative fireplace located in the recreation room; 7 total rooms
- Laundry & utility: Washer hookup; Gas dryer hookup; Laundry in basement; Dryer
Neighborhood map
What this means for you Summary
Snapshot
- This is a 3-bed/2.5-bath single-family listed at $250k.
Deal economics
- At list price, monthly cash flow is $-37 ($-441/yr) — negative.
- To cash-flow at today's rent, offer at most $244k (2.6% below list).
- To meet the 1% rule (rent ≥ 1% of price), the offer needs to be $235k (5.8% below list).
- Recommended offer: $235k (5.8% below list) — sets the bar for 1% rule.
Location & tenants
- Location reads 82/100 on livability (#76 in OH, #1,152 nationally) — a professional / high-income tenant draw. Strengths: cost of living A+, housing A+, health & safety A+; Watch: amenities C-, commute F.
- South Euclid-Lyndhurst City (suburban): math 23% / reading 45% proficiency, ranked #556 of 656 in OH (top 85%) — families likely to look elsewhere, expect single-tenant / working-renter base with shorter leases.
- Market conditions: Rents rising fast (+4.5%/yr); 176 active listings in the ZIP; 10 comparable units currently listed for rent nearby; rentals at typical pace (median 15d on market — plan ~3-4 weeks tenant-placement turnaround); 40% of comp listings sitting > 30 days — soft ceiling on asking rent; solid renter incomes; 1,441 units permitted in Cuyahoga County in 2024 (700 in 5+ unit buildings).
- This rent runs 34% of the median local income ($82k/yr) — at the standard rent-burdened threshold; future hikes will face affordability resistance.
Forward outlook
- Local home prices are declining (-3.0%/yr); year-one equity from $2k of loan paydown is wiped out by about $8k of value loss. Plan a longer hold.
- Cuyahoga County population projected to shrink 8% by 2050 — rents likely to lag national; underwrite the cash flow, not the appreciation.
Negotiation context
- Only 7 days on market — expect competitive offers; lowballing is unlikely to land.
- 4 sale attempts since 17y ago with the ask held roughly flat each time — persistent listings suggest the price (not the market) is what's stuck; bring a comps-based counter.
- Current owner paid $209k; 20% above their basis — modest negotiation headroom, anchor on the comps not their cost.
Risks & watch-outs
- Watch-outs: built in 1954 — expect roof / HVAC / electrical / plumbing capex.
Questions for the listing agent
- What do current leases actually rent for vs. the listed asking? Can we see a recent rent roll and the last 12 months of T-12 income?
- Built in 1954 — when were the roof, HVAC, electrical panel, plumbing, and water heater last replaced?
- Is there a deadline driving the sale (1031 exchange, divorce, estate, relocation)? That informs how much negotiation room exists.
- Schools are A-rated — typically a magnet for longer-tenancy family renters. What's the average tenant stay here, and is there a school-zone premium baked into asking?
- The area grade is low — what's the realistic commute time and amenity access for the typical tenant pool here? Any planned neighborhood developments (good or bad) we should know about?
- What's the average days-on-market for RENTAL listings here right now (not sales)? A rising rental-DOM trend means longer vacancies and softer asking-rent achievability than the comps imply.
- What's the recent tenant-quality profile in this submarket — average credit score on applications, eviction rate, late-payment / NSF rate, and stable-employment percentage? A property-management company in the area should have these aggregated.
- How much new for-sale + rental construction is in the pipeline within 1–3 miles? Heavy new supply typically softens prices + rents 12–24 months out; constrained supply supports both.
Investment metrics
- 1% rule
- 0.94% ✗
- Cap rate
- 6.12%
- Cash-on-cash
- -0.63%
- DSCR
- 0.97
- GRM
- 8.8
CMA / ARV
- ARV (on-the-fly)
- $300,384
- Comps found
- 12
Show comp detail 12 sales within ~0.75 mi
| Address | Dist | Beds/Ba | Sqft | Sold | Price | $/sf | Match |
|---|---|---|---|---|---|---|---|
| 1994 Aldersgate Dr | 0.65mi | 3/2.0 | 1,800 (+1%) | 1mo | $293,000 | $163 | 66 |
| 1884 Brainard Rd | 0.48mi | 3/1.5 | 1,698 (-5%) | 3mo | $285,000 | $168 | 63 |
| 1766 Longwood Dr | 0.33mi | 3/2.0 | 2,020 (+13%) | 0mo | $203,000 | $100 | 61 |
| 1544 Edgefield Rd | 0.25mi | 4/2.0 (+1) | 1,583 (-12%) | 2mo | $245,000 | $155 | 61 |
| 1730 Alcester Rd | 0.74mi | 3/2.5 | 1,715 (-4%) | 1mo | $305,500 | $178 | 58 |
| 1359 Beaconfield Rd | 0.63mi | 3/2.5 | 1,915 (+7%) | 2mo | $245,000 | $128 | 57 |
| 1412 Belrose Rd | 0.60mi | 3/2.5 | 1,640 (-8%) | 2mo | $297,500 | $181 | 57 |
| 1360 Croyden Rd | 0.52mi | 3/1.5 | 2,008 (+12%) | 0mo | $265,000 | $132 | 51 |
| 5918 Maplewood Rd | 0.75mi | 4/2.5 (+1) | 1,888 (+6%) | 2mo | $285,000 | $151 | 49 |
| 1291 Haverston Rd | 0.68mi | 4/3.0 (+1) | 1,646 (-8%) | 0mo | $319,900 | $194 | 48 |
| 1339 Haverston Rd | 0.59mi | 3/1.5 | 1,528 (-14%) | 0mo | $285,000 | $187 | 44 |
| 5991 Cantwell Dr | 0.72mi | 4/2.5 (+1) | 2,012 (+12%) | 3mo | $360,000 | $179 | 38 |
Match score weights: distance 35% · size 25% · config 20% · recency 20%. Top-matched comps best support the ARV.
Projected returns pro-forma
-3.0% appreciation · 4.45% rent growth · sell at horizon
- IRR
- -15.5%
- Equity multiple
- 0.44×
- Total profit
- $-39,228
- Equity at exit
- $37,276
- IRR
- -4.4%
- Equity multiple
- 0.69×
- Total profit
- $-21,881
- Equity at exit
- $21,615
Cash invested: $70,000 (down + closing). Projections, not guarantees.
Landlord ↔ Tenant lean methodology
- Overall (STATE)
- 73 Landlord-Friendly
- State Ohio
- 73 Landlord-Friendly · R+6
- County
- — inherits STATE
- City
- — inherits STATE
ZIP-level market 44124
- Rents YoY
- 4.5%
- Active inventory
- 176
- Price-to-rent
- 8.8×
Monthly cashflow live
- Estimated rent
- $2,354 high interval (Pro) →
- Mortgage (P&I)
- −$1,311
- Tax from tax record
- −$481 /mo · $5,777/yr
- Insurance
- −$104
- HOA
- −$0
- Vacancy / Maint / Mgmt
- −$494
- Net cashflow
- $-37
Break-even live
UW: 25.0% down · 7.5% · 30yr · 1.5% tax · 5.0% vac · 8.0% maint · 8.0% mgmt
Financing live
Cash to close
- Down payment
- $62,500
- Closing costs
- $7,500
- Reserves months
- —
- Total cash needed
- —
Loan-product check · same deal, 3 products live
Conventional
25% down · 7.5% · 30yr
- Down + closing
- —
- Monthly P&I
- —
- Monthly cashflow
- —
- DSCR
- —
- Eligible?
- —
Personal DTI + credit; lowest rate.
DSCR
20% down · 8.5% · 30yr
- Down + closing
- —
- Monthly P&I
- —
- Monthly cashflow
- —
- DSCR
- —
- Eligible?
- —
No personal income docs; deal must DSCR.
Hard money
10% down · 12.0% · 12mo
- Down + closing
- —
- Monthly P&I
- —
- Monthly cashflow
- —
- DSCR
- —
- Eligible?
- —
Short-term bridge; refi at stabilization.
Rent comps 10 comps
| Address | Beds | Baths | Sqft | Rent | $/sqft | DOM | Units | Dist |
|---|---|---|---|---|---|---|---|---|
| 5670 Cherokee Dr Cleveland, OH | 4.0 | 2.0 | 1920 | $1,950 | $1.02 | 7d | 1 | 0.05mi |
| 1620 Brainard Rd Cleveland, OH | 3.0 | 1.5 | 1501 | $2,275 | $1.52 | 14d | 1 | 0.08mi |
| 1678 Byron Dr Cleveland, OH | 3.0 | 2.0 | 2390 | $2,200 | $0.92 | 11d | 1 | 0.43mi |
| 2021 Aldersgate Dr Cleveland, OH | 4.0 | 2.5 | 2012 | $2,850 | $1.42 | 43d | 1 | 0.58mi |
| 1270 Roland Rd Cleveland, OH | 4.0 | 2.0 | 1720 | $2,450 | $1.42 | 43d | 1 | 0.98mi |
| 28875 Addison Ct Cleveland, OH | 3.0 | 2.5 | 2337 | $4,975 | $2.13 | 44d | 1 | 0.99mi |
| 1735 Chelmsford Rd Cleveland, OH | 3.0 | 2.0 | 1300 | $2,200 | $1.69 | 43d | 1 | 1.00mi |
| 28790 Addison Ct Pepper Pike, OH | 2.0–3.0 | 2.5 | 2105 | $6,100 | $2.90 | 1d | 3 | 1.00mi |
| 27040 Cedar Rd Beachwood, OH | 3.0 | 1.0–2.5 | 845 | $1,881 | $2.22 | 1d | 99 | 1.33mi |
| 26600 George Zeiger Dr Beachwood, OH | 1.0–3.0 | 1.0–3.0 | 1734 | $5,375 | $3.10 | 1d | 40 | 1.47mi |
Listing history 7 events
-
2026-06-18days on market $250,000 Active 7 DOM
-
2026-06-17days on market $250,000 Active 6 DOM
-
2026-06-16days on market $250,000 Active 5 DOM
-
2026-06-15days on market $250,000 Active 4 DOM
-
2026-06-13days on market $250,000 Active 2 DOM
-
2026-06-13remarks 699-char remark
-
2026-06-13$250,000 Active 1 DOM
ⓘ Source: listings_history table (triggers on properties + properties_extension) + one-shot
backfill from property_details.listing_events for pre-trigger history.
Tax reassessment forecast OH · Partial reset (capped growth)
- Current annual tax
- $5,777 · $481/mo
- Projected year-2 tax
- $5,777 · $481/mo
- Expected delta
- $0/yr ($0/mo · 0.0%)
ⓘ Screening estimate from a state-policy table — verify with the county assessor before closing.
Climate risk First Street
- Flood 1/10 Low FEMA zone X (unshaded) · 0% chance over 30 yrs
- Wildfire 1/10 Low
- Heat 2/10 Low 7 d/yr ≥96°F today · 17 d/yr by 30 yrs out
- Wind 1/10 Low
- Air quality 3/10 Moderate 2 unhealthy d/yr today · 5 by 30 yrs out
Nearby sold comps map
Loading sold comps map…
Walkable amenities ~0.75 mi
Loading nearby amenities…
Taxation est. · year 1
- Rental income
- $28,251
- − Mortgage interest
- −$14,004
- − Property taxes
- −$5,777
- − Insurance
- −$1,250
- − Repairs & maintenance
- −$2,260
- − Management
- −$2,260
- − Depreciation
- −$7,273
- Taxable loss
- −$4,573
- Est. tax savings @ 24.0%
- +$1,097
- After-tax cash flow
- $656/yr
For passive investors: Depreciation is non-cash, so a rental often shows a tax loss while cash-flowing — sheltering income. Rental losses are passive: they offset passive income freely, and up to $25,000/yr can offset ordinary (W-2) income if you actively participate and your MAGI is under $100k (phasing out to $0 by $150k); unused losses carry forward. On sale, claimed depreciation is recaptured at up to 25%, and gains may owe capital-gains tax (a 1031 exchange can defer both). Figures are a year-1 estimate at your 24.0% rate — not tax advice; consult a CPA.
Schools (NCES district)
- District
- South Euclid-Lyndhurst City
- NCES district ID
- 3904479
- Math proficiency
- 23% ▼ -22.00%
- Reading proficiency
- 45% ▼ -11.00%
- Median HH income
- $61,244
- Composite
- 30.51/100
- National rank
- #6212
- State rank
- #556 of 656 in OH
Livability — Lyndhurst
- Score
- 82/100
- State rank
- #76
- US rank
- #1152
Category grades
Schools grade is shown separately in the Schools card above.
Census & demographics
- Census place
- Lyndhurst, OH
- County
- Cuyahoga County · 1,090,369 people
- Metro
- Cleveland-Elyria, OH
- Population (ZIP)
- 39,779
- Household income
- $82,392
- Rent vs Own
- Severe rent burden
- 1286.0
Population outlook (Cuyahoga County) Hauer SSP2
- Today (2025)
- 1,244,621 people
- By 2030
- 1,230,093 · -1.2%
- By 2040
- 1,189,108 · -4.5%
- By 2050
- 1,145,706 · -7.9%
- By 2075
- 1,076,557 · -13.5%
- By 2100
- 978,987 · -21.3%
Race, ethnicity, and origin ACS 2023
- Neighborhood character
- Predominantly White (69%)
- Race & ethnicity
- White 69% Black 15% Two or more races 7% Asian 6% Hispanic / Latino 4%
- Common ancestry
- Romanian 6% Scotch-Irish 4% Lithuanian 3%
- Foreign-born
- 14% · Canada, China, Vietnam
- Languages at home
- 84% English-only · Russian/Polish/Slavic 4% Other Indo-European 4% Spanish 3%
Political lean MEDSL · Cuyahoga
- 2024 margin
- Solid D (+31.5) · D 65.4% · R 33.9%
- 2008→2024 swing
- -7.4pp toward R · 2008: 38.9pp · 2024: 31.5pp
- All cycles
- 2024: D+31.5 2020: D+34.1 2016: D+35.0 2012: D+38.7 2008: D+38.9
Not yet ingested
- Civics
- —
Market trends
- HPI YoY
- ▼ -212.96%
- Current HPI
- 164.108
- Rent YoY
- ▲ 4.45%
- Metro
- Cleveland-Elyria, OH
- State GDP YoY
- ▲ 1.98%
- F500 in state
- 48
Industry mix (Fortune 500 HQ in OH)
| Industry | F500 HQs | Revenue |
|---|---|---|
| Insurance | 3 | $145B |
|
||
| Industrial Machinery | 3 | $49B |
|
||
| Financial Services | 3 | $24B |
|
||
| Consumer Goods | 2 | $93B |
|
||
| Aerospace / Defense | 2 | $47B |
|
||
| Utilities | 2 | $33B |
|
||
Price history
+525.0% since first listed14 events — show timeline
- 2026-06-11 Listed $250,000 MLSNOW
- 2024-05-16 Sold (Public Records) $209,000 Public Records
- 2021-06-03 Sold (Public Records) $209,000 Public Records
- 2021-05-28 Sold (MLS) $209,000 MLSNOW
- 2021-04-29 Pending — MLSNOW
- 2021-04-25 Listed $199,900 MLSNOW
- 2019-04-25 Sold (Public Records) $140,000 Public Records
- 2019-04-25 Sold (MLS) $140,000 MLSNOW
- 2019-03-26 Contingent — MLSNOW
- 2019-03-24 Listed $150,000 MLSNOW
- 2010-01-12 Sold (Public Records) $105,000 Public Records
- 2010-01-12 Sold (MLS) $105,000 MLSNOW
- 2009-09-09 Listed $119,500 MLSNOW
- 1976-06-01 Sold (Public Records) $40,000 Public Records
Property tax history
+6.0%/yrLatest (2025): $5,777 · +12.2% YoY. Source: county tax records.
Cash-flow waterfall
monthlySold comps — $/sqft
last 12 mo · ≤1 miLoading sold comps…