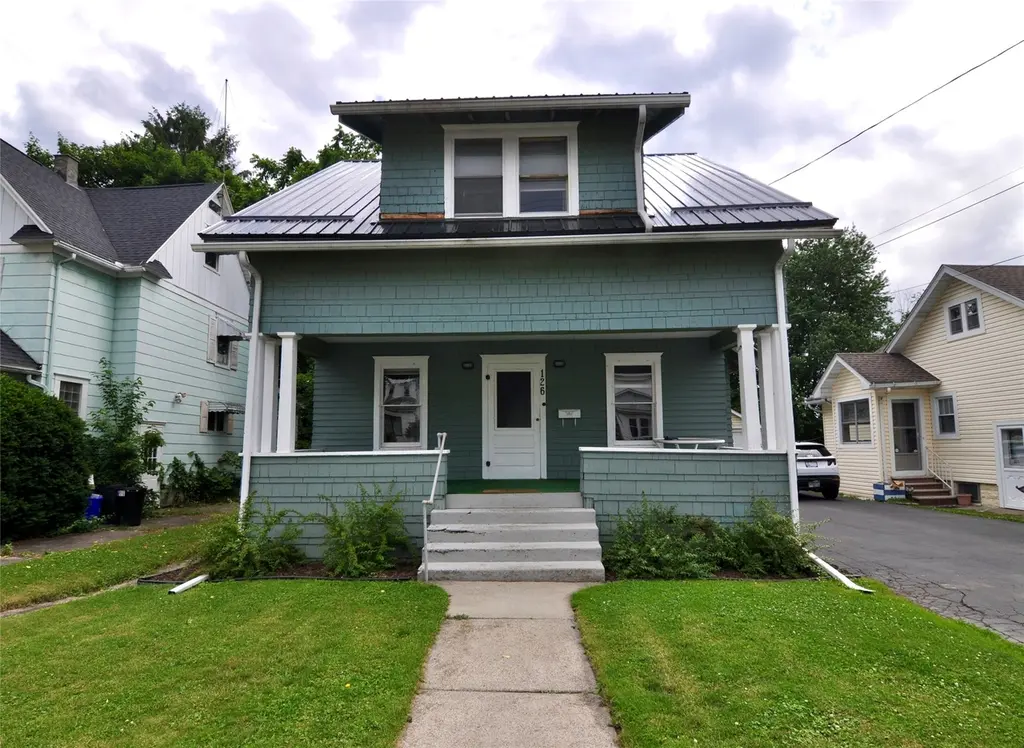
126 Ackley Ave · Johnson City, NY
Flood risk 1/10 · Minimal
- FEMA flood zone
- X
- Chance of flooding over 30 yrs
- 0.0%
- Est. flood insurance / yr
- $473 – $860
Fire risk 2/10 · Minimal
- Est. fire insurance / yr
- $691 – $1,283
Heat risk 3/10 · Minor
- Hot days now (above 92°F)
- 7 days/yr
- Hot days in 30 yrs
- 16 days/yr
Wind risk 2/10 · Minimal
- Chance of severe wind over 30 yrs
- 1.0%
Air-quality risk 2/10 · Minimal
- Unhealthy air days now
- 0 days/yr
- Unhealthy air days in 30 yrs
- 1 days/yr
Risk factors via First Street. Map © Google.
Why this score? — see what drove the D+ grade
The composite is a weighted blend of 9 inputs, each scored 0–100. Each bar is that input's sub-score; the figure is the points it added to the 100-point composite (weight × sub-score).
- Cash flow +11.5/30.0
- Appreciation +10.0/10.0
- Rent growth +4.9/5.0
- 1% rule +4.6/10.0
- Livability +3.8/5.0
- DSCR +3.4/10.0
- Schools +3.3/10.0
- Condition / age +2.5/5.0
- ARV discount +1.1/15.0
$169,000
🖨 Deal sheet (PDF) 📄 Offer letter ✓ Due diligence
Listing remarks MLS
It's like a new house! New wiring, New plumbing, new plaster walls, new steps to the second floor, super-insulated under attic floor, foam insulation at sill plate at top of foundation, walls are insulated as is the ceiling of the first floor. the doors are new solid wood six panel doors, a new bathroom with all new plumbing, a separate shower, and tub, new kitchen with new appliances. Back porch area potential for a half bath and first-floor laundry. the exterior is freshly painted. Buy a house where the majority of the work has already been done! One car garage. CAT6 throughout interior and exterior for internet and security cameras. Countertops are in-process to be completed as products are delivered.
Key facts
- New plumbing
- Open concept
- New electric
Tags
Property features AI
Exterior
- Parking: Detached garage (1 car)
- Utilities: Public water; Public sewer
- Home design: Single-family residence; Residential property; Wood siding construction
- Construction: Wood siding
- Exterior features: Covered porch; Deck; Fenced yard; Level lot
Interior
- Kitchen: Range; Free-standing range; Dishwasher; Microwave; Refrigerator; Exhaust fan
- Flooring: Carpet; Hardwood; Laminate; Tile
- Bathrooms: 1 full bathroom
- Heating & cooling: Baseboard heating; No central cooling
- Interior features: Insulated windows; 8 total rooms; Basement present
- Laundry & utility: Washer; Dryer; Gas water heater
Neighborhood map
What this means for you Summary
Snapshot
- This is a 3-bed/1.0-bath single-family listed at $169k.
Deal economics
- At list price, monthly cash flow is $-56 ($-669/yr) — negative.
- To cash-flow at today's rent, offer at most $159k (5.8% below list).
- To meet the 1% rule (rent ≥ 1% of price), the offer needs to be $163k (3.5% below list).
- Recommended offer: $159k (5.8% below list) — sets the bar for cash-flow.
Location & tenants
- Location reads 76/100 on livability (#238 in NY, #3,739 nationally) — a middle-class / working-renter tenant base. Strengths: cost of living A+, housing A+, health & safety A+; Watch: crime F, employment D-.
- Johnson City Central School District (suburban): math 38% / reading 41% proficiency, ranked #535 of 590 in NY (top 91%) — families likely to look elsewhere, expect single-tenant / working-renter base with shorter leases.
- Zoned schools: Johnson City Elementary/Primary School (496 students, 55% FRL); Johnson City Middle School (math 19% / reading 43%, grade F, #534 of 729 statewide, top 73%, 500 students, 65% FRL); Johnson City Senior High School (math 98% / reading 64%, grade A, #485 of 1,100 statewide, top 45%, 729 students, 60% FRL) — zoned schools at 60% FRL track the district average.
- Zoned-school proficiency averages 56% at this address vs 40% district-wide (+16 pts) — the actual schools serving this property are materially stronger than the Johnson City Central School District average implies; a family-tenant draw the district grade alone would hide.
- Market conditions: Rents rising fast (+9.5%/yr); 101 active listings in the ZIP; 20 comparable units currently listed for rent nearby; rentals at typical pace (median 23d on market — plan ~3-4 weeks tenant-placement turnaround); 340 units permitted in Broome County in 2024 (269 in 5+ unit buildings).
Forward outlook
- In year one you build about $18k of equity ($1k loan paydown + $17k appreciation (10.0% local appreciation)).
- Broome County population projected at -13% by 2050 — secular population decline; favor cash flow + early exit over multi-decade hold.
- At projected returns (10.0% appreciation + 8.0% rent growth), your $47k cash investment doubles in ~3 years — after that, you're playing with house money.
- By year 3, paydown + projected appreciation supports a ~$46k cash-out refi (75% LTV) — recoverable capital for the next deal without selling this one.
Negotiation context
- Only 5 days on market — expect competitive offers; lowballing is unlikely to land.
- 2 sale attempts since 4y ago with the ask held roughly flat each time — persistent listings suggest the price (not the market) is what's stuck; bring a comps-based counter.
- Current owner paid $135k; 25% above their basis — modest negotiation headroom, anchor on the comps not their cost.
Risks & watch-outs
- Watch-outs: property tax is 2.7% of price; built in 1930 — expect roof / HVAC / electrical / plumbing capex.
Questions for the listing agent
- What do current leases actually rent for vs. the listed asking? Can we see a recent rent roll and the last 12 months of T-12 income?
- Built in 1930 — when were the roof, HVAC, electrical panel, plumbing, and water heater last replaced?
- Property tax is high relative to price — has the assessment been appealed recently, and will the sale trigger a re-assessment?
- Is there a deadline driving the sale (1031 exchange, divorce, estate, relocation)? That informs how much negotiation room exists.
- Crime grade is F in this area — have there been break-ins, vandalism, or insurance claims at this property in the last 3 years? What carrier currently insures it and at what premium?
- The area grade is low — what's the realistic commute time and amenity access for the typical tenant pool here? Any planned neighborhood developments (good or bad) we should know about?
- What's the average days-on-market for RENTAL listings here right now (not sales)? A rising rental-DOM trend means longer vacancies and softer asking-rent achievability than the comps imply.
- What's the recent tenant-quality profile in this submarket — average credit score on applications, eviction rate, late-payment / NSF rate, and stable-employment percentage? A property-management company in the area should have these aggregated.
- How much new for-sale + rental construction is in the pipeline within 1–3 miles? Heavy new supply typically softens prices + rents 12–24 months out; constrained supply supports both.
Investment metrics
- 1% rule
- 0.96% ✗
- Cap rate
- 5.90%
- Cash-on-cash
- -1.41%
- DSCR
- 0.94
- GRM
- 8.6
CMA / ARV
- ARV (on-the-fly)
- $148,032
- Comps found
- 12
Show comp detail 12 sales within ~0.75 mi
| Address | Dist | Beds/Ba | Sqft | Sold | Price | $/sf | Match |
|---|---|---|---|---|---|---|---|
| 204 Baldwin St N | 0.37mi | 3/1.0 | 1,012 (-2%) | 6mo | $187,500 | $185 | 76 |
| 211 Hudson St | 0.34mi | 3/1.0 | 962 (-6%) | 2mo | $149,900 | $156 | 72 |
| 28 & 24 Dartmouth Dr | 0.11mi | 3/1.0 | 944 (-8%) | 13mo | $115,000 | $122 | 71 |
| 58 Orchard Ave | 0.23mi | 2/1.0 (-1) | 998 (-3%) | 11mo | $145,000 | $145 | 70 |
| 233 Grand Ave | 0.44mi | 3/1.0 | 952 (-7%) | 3mo | $122,000 | $128 | 65 |
| 50 Hill Ave | 0.30mi | 3/1.0 | 1,131 (+10%) | 9mo | $165,000 | $146 | 62 |
| 109 Hill Ave | 0.20mi | 2/1.0 (-1) | 938 (-9%) | 12mo | $160,000 | $171 | 61 |
| 59 Lusk St | 0.39mi | 3/1.0 | 1,133 (+10%) | 6mo | $162,000 | $143 | 60 |
| 44 Narwood St | 0.48mi | 2/1.0 (-1) | 972 (-5%) | 5mo | $140,000 | $144 | 59 |
| 52 Albert St | 0.72mi | 2/1.0 (-1) | 992 (-4%) | 3mo | $122,000 | $123 | 53 |
| 90 Theron St | 0.52mi | 3/1.5 | 1,144 (+11%) | 10mo | $159,900 | $140 | 47 |
| 3 Cleveland Ave | 0.55mi | 3/2.0 | 1,152 (+12%) | 5mo | $154,500 | $134 | 46 |
Match score weights: distance 35% · size 25% · config 20% · recency 20%. Top-matched comps best support the ARV.
Projected returns pro-forma
10.0% appreciation · 8.0% rent growth · sell at horizon
- IRR
- 25.2%
- Equity multiple
- 3.05×
- Total profit
- $97,242
- Equity at exit
- $152,249
- IRR
- 23.8%
- Equity multiple
- 7.57×
- Total profit
- $310,762
- Equity at exit
- $328,330
Cash invested: $47,320 (down + closing). Projections, not guarantees.
Landlord ↔ Tenant lean methodology
- Overall (STATE)
- 15 Strongly Tenant-Friendly
- State New York
- 15 Strongly Tenant-Friendly · D+10
- County
- — inherits STATE
- City
- — inherits STATE
ZIP-level market 13790
- Home prices YoY
- 6.8%
- Rents YoY
- 9.5%
- Active inventory
- 101
- Price-to-rent
- 8.6×
Monthly cashflow live
- Estimated rent
- $1,630 high interval (Pro) →
- Mortgage (P&I)
- −$886
- Tax from tax record
- −$387 /mo · $4,645/yr
- Insurance
- −$70
- HOA
- −$0
- Vacancy / Maint / Mgmt
- −$342
- Net cashflow
- $-56
Break-even live
Sensitivity live
| Price | -10% $40 | -5% $-8 | +0% $-56 | +5% $-104 | +10% $-151 |
|---|---|---|---|---|---|
| Rent | -10% $-185 | -5% $-120 | +0% $-56 | +5% $9 | +10% $73 |
| Rate | -1.0pp $29 | -0.5pp $-13 | base $-56 | +0.5pp $-100 | +1.0pp $-144 |
UW: 25.0% down · 7.5% · 30yr · 1.5% tax · 5.0% vac · 8.0% maint · 8.0% mgmt
Financing live
Cash to close
- Down payment
- $42,250
- Closing costs
- $5,070
- Reserves months
- —
- Total cash needed
- —
Loan-product check · same deal, 3 products live
Conventional
25% down · 7.5% · 30yr
- Down + closing
- —
- Monthly P&I
- —
- Monthly cashflow
- —
- DSCR
- —
- Eligible?
- —
Personal DTI + credit; lowest rate.
DSCR
20% down · 8.5% · 30yr
- Down + closing
- —
- Monthly P&I
- —
- Monthly cashflow
- —
- DSCR
- —
- Eligible?
- —
No personal income docs; deal must DSCR.
Hard money
10% down · 12.0% · 12mo
- Down + closing
- —
- Monthly P&I
- —
- Monthly cashflow
- —
- DSCR
- —
- Eligible?
- —
Short-term bridge; refi at stabilization.
Rent comps 20 comps
| Address | Beds | Baths | Sqft | Rent | $/sqft | DOM | Units | Dist |
|---|---|---|---|---|---|---|---|---|
| 400 Riverside Dr Unit 27 Johnson City, NY | 2.0 | 1.0 | 800 | $2,000 | $2.50 | 14d | 1 | 0.28mi |
| 400 Riverside Dr Unit 15 Johnson City, NY | 3.0 | 1.0 | 1000 | $2,425 | $2.42 | 14d | 1 | 0.28mi |
| 400 Riverside Dr Unit 212 Johnson City, NY | 3.0 | 1.0 | 1100 | $2,500 | $2.27 | 14d | 1 | 0.28mi |
| 207 Saint Charles St #2 Johnson City, NY | 2.0 | 1.0 | 925 | $1,250 | $1.35 | 22d | 1 | 0.36mi |
| 145 Floral Ave Unit 4 Johnson City, NY | 3.0 | 1.0 | 1095 | $1,250 | $1.14 | 22d | 1 | 0.40mi |
| 127 Burbank Ave Unit 2 Johnson City, NY | 2.0 | 1.0 | 1032 | $1,000 | $0.97 | 22d | 1 | 0.41mi |
| 143 Harrison St Unit 2 Johnson City, NY | 2.0 | 1.0 | 750 | $1,100 | $1.47 | 14d | 1 | 0.49mi |
| 155 Willow St Unit 3 Johnson City, NY | 2.0 | 1.0 | 739 | $1,200 | $1.62 | 22d | 1 | 0.54mi |
| 79 Saint Charles St Apt 3 Johnson City, NY | 3.0 | 1.0 | 793 | $1,340 | $1.69 | 14d | 1 | 0.64mi |
| 51 Allen St Unit 1 Johnson City, NY | 3.0 | 1.0 | 1170 | $1,575 | $1.35 | 22d | 1 | 0.71mi |
| 50 Crocker Ave Johnson City, NY | 4.0 | 2.0 | 1411 | $2,000 | $1.42 | 22d | 1 | 0.73mi |
| 263 Main St Unit 2 Johnson City, NY | 2.0 | 2.0 | 850 | $1,399 | $1.65 | 22d | 1 | 0.82mi |
| 133 Crestmont Rd Unit 2 Binghamton, NY | 3.0 | 1.0 | 1300 | $1,900 | $1.46 | 45d | 1 | 0.93mi |
| 99 Helen St Unit 2 Binghamton, NY | 3.0 | 1.0 | 1220 | $1,600 | $1.31 | 45d | 1 | 0.96mi |
| 296 Main St Unit 6 Binghamton, NY | 3.0 | 1.0 | 1200 | $1,250 | $1.04 | 14d | 1 | 1.00mi |
| 263 Main St Binghamton, NY | 2.0 | 1.0 | 920 | $1,200 | $1.30 | 14d | 1 | 1.07mi |
| 16 Highland Ave Unit 1 Binghamton, NY | 3.0 | 1.0 | 1400 | $1,650 | $1.18 | 45d | 1 | 1.16mi |
| 11 Dayton St Apt 5 Johnson City, NY | 2.0 | 1.0 | 900 | $1,200 | $1.33 | 14d | 1 | 1.17mi |
| 36 Haendel St Unit Second Floor Binghamton, NY | 3.0 | 1.0 | 1200 | $1,450 | $1.21 | 45d | 1 | 1.25mi |
| 10 Bidwell St Johnson City, NY | 3.0 | 2.0 | 1200 | $1,850 | $1.54 | 45d | 1 | 1.30mi |
Listing history 6 events
-
2026-06-21days on market $169,000 Active 5 DOM
-
2026-06-19days on market $169,000 Active 3 DOM
-
2026-06-18days on market $169,000 Active 2 DOM
-
2026-06-18remarks 641-char remark
-
2026-06-17remarks 638-char remark
-
2026-06-17$169,000 Active 1 DOM
ⓘ Source: listings_history table (triggers on properties + properties_extension) + one-shot
backfill from property_details.listing_events for pre-trigger history.
Tax reassessment forecast NY · Partial reset (capped growth)
- Current annual tax
- $4,645 · $387/mo
- Projected year-2 tax
- $4,645 · $387/mo
- Expected delta
- $0/yr ($0/mo · 0.0%)
ⓘ Screening estimate from a state-policy table — verify with the county assessor before closing.
Climate risk First Street
- Flood 1/10 Low FEMA zone X · 0% chance over 30 yrs
- Wildfire 2/10 Low
- Heat 3/10 Moderate 7 d/yr ≥92°F today · 16 d/yr by 30 yrs out
- Wind 2/10 Low 100% chance of damaging wind over 30 yrs
- Air quality 2/10 Low 0 unhealthy d/yr today · 1 by 30 yrs out
Nearby sold comps map
Loading sold comps map…
Walkable amenities ~0.75 mi
Loading nearby amenities…
Taxation est. · year 1
- Rental income
- $19,565
- − Mortgage interest
- −$9,467
- − Property taxes
- −$4,645
- − Insurance
- −$845
- − Repairs & maintenance
- −$1,565
- − Management
- −$1,565
- − Depreciation
- −$4,916
- Taxable loss
- −$3,438
- Est. tax savings @ 24.0%
- +$825
- After-tax cash flow
- $157/yr
For passive investors: Depreciation is non-cash, so a rental often shows a tax loss while cash-flowing — sheltering income. Rental losses are passive: they offset passive income freely, and up to $25,000/yr can offset ordinary (W-2) income if you actively participate and your MAGI is under $100k (phasing out to $0 by $150k); unused losses carry forward. On sale, claimed depreciation is recaptured at up to 25%, and gains may owe capital-gains tax (a 1031 exchange can defer both). Figures are a year-1 estimate at your 24.0% rate — not tax advice; consult a CPA.
Schools (NCES district)
- District
- Johnson City Central School District
- NCES district ID
- 3615900
- Math proficiency
- 38% ▼ -8.00%
- Reading proficiency
- 41% ▲ 2.00%
- Median HH income
- $40,514
- Composite
- 33.17/100
- National rank
- #5545
- State rank
- #535 of 590 in NY
Livability — Johnson City
- Score
- 76/100
- State rank
- #238
- US rank
- #3739
Category grades
Schools grade is shown separately in the Schools card above.
Census & demographics
- Census place
- Johnson City, NY
- County
- Broome County · 126,805 people
- City population
- 18,739
- Metro
- Binghamton, NY
- Population (ZIP)
- 18,739
- Household income
- $59,045
- Rent vs Own
- Severe rent burden
- 1233.0
Population outlook (Broome County) Hauer SSP2
- Today (2025)
- 187,989 people
- By 2030
- 183,066 · -2.6%
- By 2040
- 172,228 · -8.4%
- By 2050
- 163,161 · -13.2%
- By 2075
- 153,641 · -18.3%
- By 2100
- 140,851 · -25.1%
Race, ethnicity, and origin ACS 2023
- Neighborhood character
- Predominantly White (75%)
- Race & ethnicity
- White 75% Two or more races 9% Asian 8% Black 6% Hispanic / Latino 4%
- Common ancestry
- Romanian 6% Lithuanian 3% Scotch-Irish 2%
- Foreign-born
- 9% · Canada, China, Vietnam
- Languages at home
- 88% English-only · Other Indo-European 4% French/Haitian/Cajun 2% Spanish 2%
Political lean MEDSL · Broome
- 2024 margin
- Toss-up / Even · D 50.2% · R 49.8%
- 2008→2024 swing
- -7.6pp toward R · 2008: 8.0pp · 2024: 0.4pp
- All cycles
- 2024: D+0.4 2020: D+3.5 2016: R+3.7 2012: D+4.6 2008: D+8.0
Not yet ingested
- Civics
- —
Market trends
- HPI YoY
- ▲ 18.06%
- Current HPI
- 285.3668
- Rent YoY
- ▲ 9.47%
- Metro
- Binghamton, NY
- State GDP YoY
- ▲ 2.60%
- F500 in state
- 92
Industry mix (Fortune 500 HQ in NY)
| Industry | F500 HQs | Revenue |
|---|---|---|
| Financial Services | 10 | $950B |
|
||
| Consumer Goods | 9 | $162B |
|
||
| Insurance | 4 | $225B |
|
||
| Telecommunications | 2 | $144B |
|
||
| Pharmaceuticals | 2 | $112B |
|
||
| Media / Entertainment | 2 | $69B |
|
||
Price history
+322.5% since first listed5 events — show timeline
- 2026-06-16 Listed $169,000 GBAOR
- 2022-12-16 Sold (MLS) $135,000 GBAOR
- 2022-10-28 Pending — GBAOR
- 2022-09-19 Listed $139,000 GBAOR
- 2020-02-28 Sold (Public Records) $40,000 Public Records
Property tax history
+7.5%/yrLatest (2025): $4,645 · +1.7% YoY. Source: county tax records.
Cash-flow waterfall
monthlySold comps — $/sqft
last 12 mo · ≤1 miLoading sold comps…