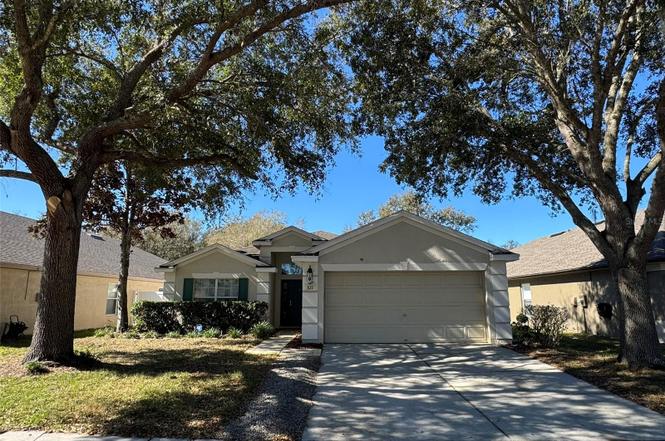
635 White Flower Way · Spring Hill, FL
Flood risk 1/10 · Minimal
- FEMA flood zone
- X (shaded)
- Chance of flooding over 30 yrs
- 0.0%
- Est. flood insurance / yr
- $507 – $1,088
Fire risk 4/10 · Minor
- Est. fire insurance / yr
- $947 – $1,759
Heat risk 10/10 · Severe
- Hot days now (above 109°F)
- 7 days/yr
- Hot days in 30 yrs
- 26 days/yr
Wind risk 10/10 · Severe
- Chance of severe wind over 30 yrs
- 99.0%
Air-quality risk 2/10 · Minimal
- Unhealthy air days now
- 1 days/yr
- Unhealthy air days in 30 yrs
- 2 days/yr
Risk factors via First Street. Map © Google.
Why this score? — see what drove the D grade
The composite is a weighted blend of 9 inputs, each scored 0–100. Each bar is that input's sub-score; the figure is the points it added to the 100-point composite (weight × sub-score).
- Cash flow +12.6/30.0
- ARV discount +12.1/15.0
- Schools +4.2/10.0
- DSCR +3.7/10.0
- Livability +3.2/5.0
- 1% rule +2.9/10.0
- Rent growth +2.9/5.0
- Condition / age +2.5/5.0
- Appreciation +0.0/10.0
$279,900
🖨 Deal sheet 📄 Offer letter ✓ Due diligence
Listing remarks MLS
Beautiful home located across from from Passive Pack-Will ready for move in by June!Nice view of park
Key facts
- Clubhouse
- Community pool
- Resort-style pool
Tags
Property features AI
Finance
- Other: Property zoned RES; Lot approximately 0.13 acres (about 0 to less than 1/4 acre)
- Financial info: No lease restrictions indicated
- HOA & community: HOA managed by Wise Property Management; Monthly HOA fee of $97 (required); Association approval required; Pets allowed
Exterior
- Parking: Attached 2-car garage
- Utilities: Public water; Public sewer; Cable connected; Electricity connected; Sewer connected
- Home design: Single family residence; Residential property; One story; Faces northeast; Homestead exempt
- Construction: Concrete construction; Shingle roof; Block foundation; Built on one level
- Exterior features: Other exterior features
Interior
- Kitchen: Dishwasher
- Bedrooms: 4 bedrooms
- Flooring: Carpet; Tile
- Bathrooms: 2 full bathrooms
- Heating & cooling: Central heating; Central air conditioning
- Interior features: Cathedral ceilings; Ceiling fans; Crown molding
- Laundry & utility: Laundry closet
Neighborhood map
What this means for you Summary
Snapshot
- This is a 4-bed/2.0-bath single-family listed at $280k.
Deal economics
- At list price, monthly cash flow is $-37 ($-449/yr) — negative.
- To cash-flow at today's rent, offer at most $273k (2.4% below list).
- To meet the 1% rule (rent ≥ 1% of price), the offer needs to be $221k (21.0% below list).
- Recommended offer: $221k (21.0% below list) — sets the bar for 1% rule.
- Cap rate 6.1% vs local median 4.4% in Spring Hill — top-decile yield for the area; either an underpriced asset or a hidden risk that comps aren't pricing in. Stress-test before assuming the spread holds.
Location & tenants
- Location reads 63/100 on livability (#738 in FL) — a middle-class / working-renter tenant base. Strengths: cost of living A+, housing A+; Watch: health & safety C-, employment D+, amenities F.
- Hernando (suburban): math 50% / reading 50% proficiency, ranked #38 of 73 in FL (top 52%) — acceptable for families but not a draw, mixed tenant base, ~2y average lease.
- Zoned schools: Moton Elementary School (math 46% / reading 39%, grade F, #1,383 of 2,144 statewide, top 65%, 679 students, 79% FRL); Nature Coast Technical High (math 52% / reading 51%, grade D+, #167 of 667 statewide, top 25%, 1,298 students, 38% FRL) — zoned schools at 59% FRL track the district average.
- Market conditions: Rents rising (+1.6%/yr); 196 active listings in the ZIP; 20 comparable units currently listed for rent nearby; rentals at typical pace (median 24d on market — plan ~3-4 weeks tenant-placement turnaround); solid renter incomes; 2,505 units permitted in Hernando County in 2024 (318 in 5+ unit buildings).
- This rent runs 31% of the median local income ($85k/yr) — at the standard rent-burdened threshold; future hikes will face affordability resistance.
Forward outlook
- Local home prices are declining (-3.0%/yr); year-one equity from $2k of loan paydown is wiped out by about $8k of value loss. Plan a longer hold.
- Hernando County population projected at +11% by 2050 — modest demand growth; plan on rents tracking national, not racing it.
Negotiation context
- It's been on market 113 days — a 9% lower offer ($255k) is reasonable based on typical stale-listing flexibility.
- 2 sale attempts since 20y ago; this cycle's ask has dropped $20k (7%) from the opening price — seller is motivated, your offer sets the floor, not the list.
- Current owner paid $188k; 49% above their basis — modest negotiation headroom, anchor on the comps not their cost.
Risks & watch-outs
- Climate carrying-cost: severe wind risk, 99% chance of damaging wind over 30y; extreme-heat days projected 7→26/yr by 2055 (HVAC capex compounding) — expect insurance premiums to compound above CPI over the hold.
Questions for the listing agent
- What do current leases actually rent for vs. the listed asking? Can we see a recent rent roll and the last 12 months of T-12 income?
- It's been on market 113 days. Have you received any prior offers? Is the seller open to a 21% concession, seller financing, or rate buy-down credit?
- What does the HOA fee cover, when was the last increase, and are there any pending special assessments or reserve-fund shortfalls?
- Why hasn't it sold? Are there any deal-killer items the seller is aware of (foundation, flood, title, zoning, code violations)?
- Is there a deadline driving the sale (1031 exchange, divorce, estate, relocation)? That informs how much negotiation room exists.
- The area grade is low — what's the realistic commute time and amenity access for the typical tenant pool here? Any planned neighborhood developments (good or bad) we should know about?
- What's the average days-on-market for RENTAL listings here right now (not sales)? A rising rental-DOM trend means longer vacancies and softer asking-rent achievability than the comps imply.
- What's the recent tenant-quality profile in this submarket — average credit score on applications, eviction rate, late-payment / NSF rate, and stable-employment percentage? A property-management company in the area should have these aggregated.
- How much new for-sale + rental construction is in the pipeline within 1–3 miles? Heavy new supply typically softens prices + rents 12–24 months out; constrained supply supports both.
Investment metrics
- 1% rule
- 0.79% ✗
- Cap rate
- 6.13%
- Cash-on-cash
- -0.57%
- DSCR
- 0.97
- GRM
- 10.5
CMA / ARV
- ARV (on-the-fly)
- $311,540
- Comps found
- 12
Show comp detail 12 sales within ~0.75 mi
| Address | Dist | Beds/Ba | Sqft | Sold | Price | $/sf | Match |
|---|---|---|---|---|---|---|---|
| 15566 Sword Lily Pl | 0.35mi | 4/2.0 | 1,604 (-5%) | 1mo | $279,000 | $174 | 75 |
| 783 Petal Mist Ln | 0.47mi | 3/2.0 (-1) | 1,702 (+1%) | 1mo | $274,000 | $161 | 71 |
| 398 Sea Holly Dr | 0.28mi | 3/2.0 (-1) | 1,814 (+8%) | 2mo | $380,000 | $209 | 68 |
| 15331 Stone House Dr | 0.60mi | 3/2.0 (-1) | 1,700 (+1%) | 3mo | $297,000 | $175 | 63 |
| 15723 Stone House Dr | 0.70mi | 3/2.0 (-1) | 1,701 (+1%) | 0mo | $315,000 | $185 | 60 |
| 758 Alpine Thistle Dr | 0.31mi | 3/2.0 (-1) | 1,443 (-14%) | 0mo | $275,000 | $191 | 56 |
| 371 Voltaire Dr | 0.43mi | 3/2.0 (-1) | 1,503 (-11%) | 1mo | $259,990 | $173 | 56 |
| 143 Voltaire Dr | 0.46mi | 3/2.0 (-1) | 1,503 (-11%) | 2mo | $275,000 | $183 | 54 |
| 175 Voltaire Dr | 0.48mi | 3/2.0 (-1) | 1,503 (-11%) | 2mo | $250,000 | $166 | 53 |
| 690 Old Windsor Way | 0.63mi | 3/2.0 (-1) | 1,562 (-7%) | 3mo | $315,000 | $202 | 51 |
| 988 Scarlet Plume Ln | 0.66mi | 3/2.0 (-1) | 1,443 (-14%) | 3mo | $295,000 | $204 | 37 |
| 15690 Stone House Dr | 0.74mi | 3/2.0 (-1) | 1,443 (-14%) | 3mo | $298,000 | $207 | 34 |
Match score weights: distance 35% · size 25% · config 20% · recency 20%. Top-matched comps best support the ARV.
Projected returns pro-forma
-3.0% appreciation · 1.61% rent growth · sell at horizon
- IRR
- -18.7%
- Equity multiple
- 0.35×
- Total profit
- $-50,848
- Equity at exit
- $41,734
- IRR
- -14.0%
- Equity multiple
- 0.24×
- Total profit
- $-59,759
- Equity at exit
- $24,201
Cash invested: $78,372 (down + closing). Projections, not guarantees.
Landlord ↔ Tenant lean methodology
- Overall (STATE)
- 87 Strongly Landlord-Friendly
- State Florida
- 87 Strongly Landlord-Friendly · R+3
- County
- — inherits STATE
- City
- — inherits STATE
ZIP-level market 34604
- Home prices YoY
- -23.4%
- Rents YoY
- 1.6%
- Active inventory
- 196
- Price-to-rent
- 10.5×
Monthly cashflow live
- Estimated rent
- $2,212 high interval (Pro) →
- Mortgage (P&I)
- −$1,468
- Tax from tax record
- −$104 /mo · $1,243/yr
- Insurance
- −$117
- HOA
- −$97
- Vacancy / Maint / Mgmt
- −$465
- Net cashflow
- $-37
Break-even live
UW: 25.0% down · 7.5% · 30yr · 1.5% tax · 5.0% vac · 8.0% maint · 8.0% mgmt
Financing live
Cash to close
- Down payment
- $69,975
- Closing costs
- $8,397
- Reserves months
- —
- Total cash needed
- —
Loan-product check · same deal, 3 products live
Conventional
25% down · 7.5% · 30yr
- Down + closing
- —
- Monthly P&I
- —
- Monthly cashflow
- —
- DSCR
- —
- Eligible?
- —
Personal DTI + credit; lowest rate.
DSCR
20% down · 8.5% · 30yr
- Down + closing
- —
- Monthly P&I
- —
- Monthly cashflow
- —
- DSCR
- —
- Eligible?
- —
No personal income docs; deal must DSCR.
Hard money
10% down · 12.0% · 12mo
- Down + closing
- —
- Monthly P&I
- —
- Monthly cashflow
- —
- DSCR
- —
- Eligible?
- —
Short-term bridge; refi at stabilization.
Rent comps 20 comps
| Address | Beds | Baths | Sqft | Rent | $/sqft | DOM | Units | Dist |
|---|---|---|---|---|---|---|---|---|
| 495 Painted Leaf Dr Brooksville, FL | 3.0 | 2.0 | 1814 | $1,950 | $1.07 | 24d | 1 | 0.24mi |
| 495 Painted Leaf Dr Brooksville, FL | 3.0 | 2.0 | 1814 | $1,950 | $1.07 | 20d | 1 | 0.24mi |
| 14523 Wake Robin Dr Brooksville, FL | 4.0 | 2.0 | 1604 | $2,125 | $1.32 | 23d | 1 | 0.42mi |
| 15592 Enclave WAY Masaryktown, FL | 1.0–3.0 | 1.0–2.0 | 1041 | $1,945 | $1.87 | 1d | 21 | 0.60mi |
| 15405 Stone House Dr Brooksville, FL | 3.0 | 2.0 | 1443 | $2,095 | $1.45 | 4d | 1 | 0.68mi |
| 15734 Stone House Dr Brooksville, FL | 3.0 | 2.0 | 1462 | $2,198 | $1.50 | 3d | 1 | 0.71mi |
| 18816 Cimbora Dr Spring Hill, FL | 3.0 | 3.5 | 2112 | $2,800 | $1.33 | 24d | 1 | 0.86mi |
| 75 Fairmont Dr Spring Hill, FL | 3.0 | 2.0 | 2150 | $2,160 | $1.00 | 21d | 1 | 0.99mi |
| 446 Argyll Dr Spring Hill, FL | 4.0 | 2.0 | 1809 | $2,100 | $1.16 | 24d | 1 | 1.01mi |
| 14043 Cooper Rd Spring Hill, FL | 3.0 | 2.0 | 1586 | $2,010 | $1.27 | 20d | 1 | 1.01mi |
| 367 Argyll Dr Spring Hill, FL | 3.0 | 2.0 | 1432 | $1,900 | $1.33 | 24d | 1 | 1.05mi |
| 177 Fairmont Dr Spring Hill, FL | 3.0 | 2.0 | 2072 | $1,979 | $0.96 | 21d | 1 | 1.05mi |
| 675 Argyll Dr Spring Hill, FL | 4.0 | 3.0 | 1881 | $2,400 | $1.28 | 2d | 1 | 1.10mi |
| 14017 Tudor St Spring Hill, FL | 4.0 | 2.0 | 1726 | $2,155 | $1.25 | 3d | 1 | 1.16mi |
| 14059 Sullivan St Spring Hill, FL | 3.0 | 2.0 | 1349 | $1,795 | $1.33 | 24d | 1 | 1.21mi |
| 14040 Allston Ave Spring Hill, FL | 3.0 | 2.0 | 1523 | $2,000 | $1.31 | 24d | 1 | 1.30mi |
| 13409 Short Ct Spring Hill, FL | 3.0 | 2.0 | 2114 | $2,100 | $0.99 | 24d | 1 | 1.32mi |
| 1549 Diane St Spring Hill, FL | 3.0 | 2.0 | 1572 | $2,320 | $1.48 | 24d | 1 | 1.43mi |
| 1695 Rookery Rd Spring Hill, FL | 3.0 | 2.0 | 1572 | $2,350 | $1.49 | 24d | 1 | 1.44mi |
| 1755 Rookery Rd Spring Hill, FL | 3.0 | 2.0 | 1572 | $2,320 | $1.48 | 24d | 1 | 1.49mi |
HOA detail
- Monthly dues
- $97 · $1,164/yr
Listing history 19 events
-
2026-06-18days on market $279,900 Active 113 DOM
-
2026-06-17days on market $279,900 Active 112 DOM
-
2026-06-16days on market $279,900 Active 111 DOM
-
2026-06-15days on market $279,900 Active 110 DOM
-
2026-06-13days on market $279,900 Active 108 DOM
-
2026-06-13days on market $279,900 Active 107 DOM
-
2026-06-09days on market $279,900 Active 104 DOM
-
2026-06-08days on market $279,900 Active 103 DOM
-
2026-06-07days on market $279,900 Active 102 DOM
-
2026-06-04days on market $279,900 Active 99 DOM
-
2026-06-03days on market $279,900 Active 98 DOM
-
2026-06-02days on market $279,900 Active 97 DOM
-
2026-06-01days on market $279,900 Active 96 DOM
-
2026-05-31days on market $279,900 Active 95 DOM
-
2026-05-19price $279,900
-
2026-04-11price $289,900
-
2026-02-25$299,900 Active
-
2006-10-14soldstatus $188,030 101-char remark
Show marketing remark (101 chars)
Beautiful home located across from from Passive Pack-Will ready for move in by June!Nice view of park
-
2006-04-25$179,900 101-char remark
Show marketing remark (101 chars)
Beautiful home located across from from Passive Pack-Will ready for move in by June!Nice view of park
ⓘ Source: listings_history table (triggers on properties + properties_extension) + one-shot
backfill from property_details.listing_events for pre-trigger history.
Tax reassessment forecast FL · Resets to sale price
- Current annual tax
- $1,243 · $104/mo
- Projected year-2 tax
- $2,323 · $194/mo
- Expected delta
- +$1,081/yr (+$90/mo · 87.0%)
ⓘ Screening estimate from a state-policy table — verify with the county assessor before closing.
Climate risk First Street
- Flood 1/10 Low FEMA zone X (shaded) · 0% chance over 30 yrs
- Wildfire 4/10 Moderate
- Heat 10/10 Extreme 7 d/yr ≥109°F today · 26 d/yr by 30 yrs out
- Wind 10/10 Extreme 99% chance of damaging wind over 30 yrs
- Air quality 2/10 Low 1 unhealthy d/yr today · 2 by 30 yrs out
Nearby sold comps map
Loading sold comps map…
Walkable amenities ~0.75 mi
Loading nearby amenities…
Taxation est. · year 1
- Rental income
- $26,546
- − Mortgage interest
- −$15,679
- − Property taxes
- −$1,243
- − Insurance
- −$1,400
- − Repairs & maintenance
- −$2,124
- − Management
- −$2,124
- − HOA
- −$1,164
- − Depreciation
- −$8,143
- Taxable loss
- −$5,329
- Est. tax savings @ 24.0%
- +$1,279
- After-tax cash flow
- $830/yr
For passive investors: Depreciation is non-cash, so a rental often shows a tax loss while cash-flowing — sheltering income. Rental losses are passive: they offset passive income freely, and up to $25,000/yr can offset ordinary (W-2) income if you actively participate and your MAGI is under $100k (phasing out to $0 by $150k); unused losses carry forward. On sale, claimed depreciation is recaptured at up to 25%, and gains may owe capital-gains tax (a 1031 exchange can defer both). Figures are a year-1 estimate at your 24.0% rate — not tax advice; consult a CPA.
Schools (NCES district)
- District
- Hernando
- NCES district ID
- 1200810
- Math proficiency
- 50% ▼ -8.00%
- Reading proficiency
- 50% ▼ -4.00%
- Median HH income
- $41,985
- Composite
- 42.03/100
- National rank
- #3329
- State rank
- #38 of 73 in FL
Livability — Spring Hill
- Score
- 63/100
- State rank
- #738
- US rank
- #15937
Category grades
Schools grade is shown separately in the Schools card above.
Census & demographics
- Census place
- Spring Hill, FL
- County
- Hernando County · 169,677 people
- City population
- 83,915
- Metro
- Tampa-St. Petersburg-Clearwater, FL
- Population (ZIP)
- 13,642
- Household income
- $84,833
- Rent vs Own
- Severe rent burden
- 142.0
Population outlook (Hernando County) Hauer SSP2
- Today (2025)
- 189,218 people
- By 2030
- 194,367 · +2.7%
- By 2040
- 203,398 · +7.5%
- By 2050
- 209,589 · +10.8%
- By 2075
- 218,452 · +15.4%
- By 2100
- 205,923 · +8.8%
Race, ethnicity, and origin ACS 2023
- Neighborhood character
- Predominantly White (74%)
- Race & ethnicity
- White 74% Hispanic / Latino 16% Two or more races 10% Black 3% Asian 2%
- Hispanic origin (detail)
- Mexican 1% Puerto Rican 10% Cuban 3%
- Common ancestry
- Romanian 3% Lithuanian 2% Scotch-Irish 2%
- Foreign-born
- 4% · Canada
- Languages at home
- 89% English-only · Spanish 8% Other Indo-European 1% Russian/Polish/Slavic 1%
Political lean MEDSL · Hernando
- 2024 margin
- Solid R (+37.0) · D 31.1% · R 68.2%
- 2008→2024 swing
- -33.5pp toward R · 2008: -3.6pp · 2024: -37.0pp
- All cycles
- 2024: R+37.0 2020: R+30.2 2016: R+29.0 2012: R+8.5 2008: R+3.6
Not yet ingested
- Civics
- —
Market trends
- HPI YoY
- ▼ -84.38%
- Current HPI
- 276.4751
- Rent YoY
- ▲ 1.61%
- Metro
- Tampa-St. Petersburg-Clearwater, FL
- State GDP YoY
- ▲ 3.28%
- F500 in state
- 36
Industry mix (Fortune 500 HQ in FL)
| Industry | F500 HQs | Revenue |
|---|---|---|
| Industrial Technology | 2 | $29B |
|
||
| Insurance | 2 | $17B |
|
||
| Retail | 1 | $60B |
|
||
| Technology Distribution | 1 | $58B |
|
||
| Homebuilding | 1 | $35B |
|
||
| Technology Manufacturing | 1 | $35B |
|
||
Price history
+55.6% since first listed5 events — show timeline
- 2026-05-19 Price Changed $279,900 Stellar MLS as Distributed by MLS Grid
- 2026-04-11 Price Changed $289,900 Stellar MLS as Distributed by MLS Grid
- 2026-02-25 Listed $299,900 Stellar MLS as Distributed by MLS Grid
- 2006-10-14 Sold (MLS) $188,030 Stellar MLS as Distributed by MLS Grid
- 2006-04-25 Listed $179,900 Stellar MLS as Distributed by MLS Grid
Property tax history
+3.9%/yrLatest (2025): $1,243 · +0.4% YoY. Source: county tax records.
Cash-flow waterfall
monthlySold comps — $/sqft
last 12 mo · ≤1 miLoading sold comps…