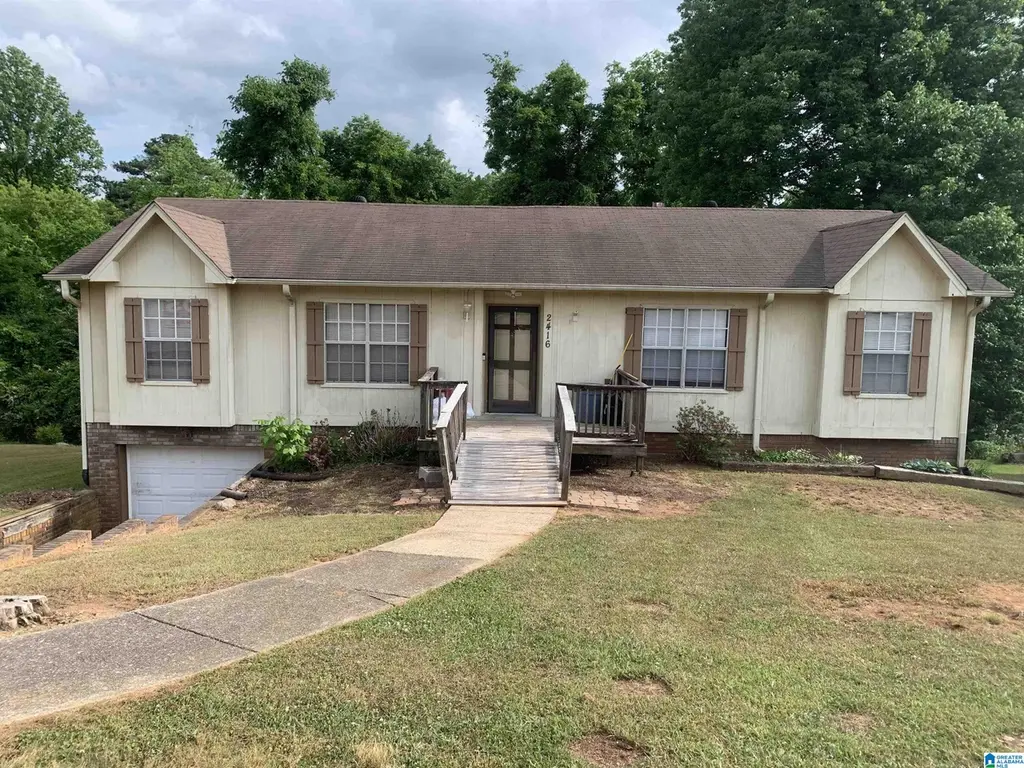
2416 Cove Cir NE · Center Point, AL
Flood risk 1/10 · Minimal
- FEMA flood zone
- X (unshaded)
- Chance of flooding over 30 yrs
- 0.0%
- Est. flood insurance / yr
- $473 – $860
Fire risk 3/10 · Minor
- Est. fire insurance / yr
- $916 – $1,700
Heat risk 5/10 · Moderate
- Hot days now (above 105°F)
- 7 days/yr
- Hot days in 30 yrs
- 19 days/yr
Wind risk 6/10 · Moderate
- Chance of severe wind over 30 yrs
- 27.0%
Air-quality risk 5/10 · Moderate
- Unhealthy air days now
- 7 days/yr
- Unhealthy air days in 30 yrs
- 9 days/yr
Risk factors via First Street. Map © Google.
Why this score? — see what drove the C- grade
The composite is a weighted blend of 9 inputs, each scored 0–100. Each bar is that input's sub-score; the figure is the points it added to the 100-point composite (weight × sub-score).
- Cash flow +23.2/30.0
- ARV discount +8.2/15.0
- DSCR +7.5/10.0
- 1% rule +4.9/10.0
- Rent growth +3.3/5.0
- Livability +3.2/5.0
- Condition / age +2.5/5.0
- Schools +1.8/10.0
- Appreciation +0.0/10.0
$139,900
🖨 Deal sheet 📄 Offer letter ✓ Due diligence
Listing remarks
This is a great house to make your own! Just a needs a face lift and maybe a little nip and tuck. Very functional floor plan with full basement. Priced to sell. Roof - July 2011 CH/A - 2024 Hot Water Heater - 2025 All the big ticket items have been replaced.
Key facts
- 0.35 acre lot
- Garage
- Built 1976
Property features AI
Finance
- Financial info: Fire fee of $275 yearly; Garbage fee of $55 quarterly; Down payment assistance available
- HOA & community: No association fee
Exterior
- Parking: Front garage entry; One total garage space (basement-level garage space listed); Driveway parking; Off-street parking; On-street parking
- Utilities: Public water; Septic system; Electric water heater; Internet service availability unknown
- Home design: Single-family existing construction; Basement entry/facing (front garage entry noted)
- Construction: Wood siding exterior; Concrete block foundation; Basement; Year built listed as existing
- Exterior features: Front porch; Open deck; Subdivision lot
Interior
- Kitchen: Laminate countertops; Pantry; Eating area; Built-in dishwasher; Electric oven and electric stove; Refrigerator included
- Bedrooms: Master bedroom on main level; Additional bedrooms on main level
- Flooring: Carpet; Hardwood laminate; Vinyl
- Bathrooms: Two full bathrooms; Tub/shower combo; Master bath on main level
- Heating & cooling: Central heating (gas); Central electric cooling
- Interior features: Cathedral/vaulted ceilings; Window treatments remain; One gas fireplace with brick surround, gas starter and gas logs in the great room; Full basement with both finished and unfinished areas (concrete block foundation); Attic present; Rooms include great room, dining room, kitchen, master bedroom with master bath, additional bedrooms, full bath, and den/family room
- Laundry & utility: Washer hookup; Electric dryer hookup; Laundry areas on main level and in basement; Additional laundry space in garage area and other area
Neighborhood map
What this means for you Summary
Snapshot
- This is a 3-bed/2.0-bath single-family listed at $140k.
Deal economics
- At list price, monthly cash flow is $253 ($3k/yr) — positive.
- The deal already cash-flows at list — no discount required.
- To meet the 1% rule (rent ≥ 1% of price), the offer needs to be $138k (1.0% below list).
- Recommended offer: $136k (3.0% below list) — sets the bar for market timing.
Location & tenants
- Location reads 63/100 on livability (#193 in AL) — a middle-class / working-renter tenant base. Strengths: cost of living A+, commute A, housing A; Watch: crime D, amenities F, employment F.
- Jefferson County (suburban): math 9% / reading 32% proficiency, ranked #104 of 129 in AL (top 81%) — low school quality limits family demand, transient renter base, plan for 1-2y turnover.
- Zoned schools: Center Point Elementary School (618 students, 82% FRL); Center Point High School (math 2% / reading 2%, grade F, #291 of 305 statewide, top 100%, 774 students, 91% FRL) — zoned schools average 86% FRL vs 49% district-wide (38 pts higher); higher-poverty schools than district average — tighter screening recommended.
- Zoned-school proficiency averages 2% at this address vs 20% district-wide (-18 pts) — the specific schools serving this property underperform the Jefferson County average; the district grade overstates school quality for this exact location.
- Market conditions: Rents rising (+3.0%/yr); 334 active listings in the ZIP; 40 comparable units currently listed for rent nearby; rentals lingering (median 44d on market — plan ~5-8 weeks vacancy on turnover, expect pricing pressure); 50% of comp listings sitting > 30 days — soft ceiling on asking rent; 2,114 units permitted in Jefferson County in 2024 (556 in 5+ unit buildings).
- This rent runs 31% of the median local income ($53k/yr) — at the standard rent-burdened threshold; future hikes will face affordability resistance.
Forward outlook
- Local home prices are declining (-3.0%/yr); year-one equity from $967 of loan paydown is wiped out by about $4k of value loss. Plan a longer hold.
- Jefferson County population projected to shrink 4% by 2050 — rents likely to lag national; underwrite the cash flow, not the appreciation.
Negotiation context
- It's been on market 54 days — a 3% lower offer ($136k) is reasonable based on typical stale-listing flexibility.
- 2 sale attempts; this cycle's ask has dropped $20k (13%) from the opening price — seller is motivated, your offer sets the floor, not the list.
- Current owner paid $55k; list at $140k implies a 154% gain — meaningful room to come down on a strong offer.
Risks & watch-outs
- Climate carrying-cost: major wind risk, 27% chance of damaging wind over 30y; extreme-heat days projected 7→19/yr by 2055 (HVAC capex compounding) — expect insurance premiums to compound above CPI over the hold.
Questions for the listing agent
- It's been on market 54 days. Have you received any prior offers? Is the seller open to a 3% concession, seller financing, or rate buy-down credit?
- Built in 1976 — when were the roof, HVAC, electrical panel, plumbing, and water heater last replaced?
- Is there a deadline driving the sale (1031 exchange, divorce, estate, relocation)? That informs how much negotiation room exists.
- Schools are F-rated, which usually means shorter tenancies and higher turnover. Who's the typical renter profile here, and what's been the actual vacancy rate?
- Crime grade is D in this area — have there been break-ins, vandalism, or insurance claims at this property in the last 3 years? What carrier currently insures it and at what premium?
- What's the average days-on-market for RENTAL listings here right now (not sales)? A rising rental-DOM trend means longer vacancies and softer asking-rent achievability than the comps imply.
- What's the recent tenant-quality profile in this submarket — average credit score on applications, eviction rate, late-payment / NSF rate, and stable-employment percentage? A property-management company in the area should have these aggregated.
- How much new for-sale + rental construction is in the pipeline within 1–3 miles? Heavy new supply typically softens prices + rents 12–24 months out; constrained supply supports both.
Investment metrics
- 1% rule
- 0.99% ✗
- Cap rate
- 8.47%
- Cash-on-cash
- 7.76%
- DSCR
- 1.35
- GRM
- 8.4
CMA / ARV
- ARV (median comp)
- $142,234
- List price
- $139,900
- Delta
- -1.64%
- Verdict
- FAIR
- Comps
- 20 within 1.0 mi
Show comp detail 12 sales within ~0.75 mi
| Address | Dist | Beds/Ba | Sqft | Sold | Price | $/sf | Match |
|---|---|---|---|---|---|---|---|
| 2532 5th St NE | 0.27mi | 3/2.0 | 1,560 (+2%) | 3mo | $190,000 | $122 | 81 |
| 317 26th Ave NE | 0.29mi | 3/1.5 | 1,500 (-2%) | 7mo | $158,500 | $106 | 76 |
| 2316 3rd Way NE | 0.21mi | 3/2.0 | 1,665 (+9%) | 5mo | $182,000 | $109 | 70 |
| 4558 Cantebury Ln | 0.48mi | 3/2.0 | 1,470 (-4%) | 4mo | $244,900 | $167 | 68 |
| 2421 2nd St NE | 0.27mi | 3/2.0 | 1,661 (+9%) | 8mo | $196,000 | $118 | 66 |
| 613 25th Ave NE | 0.30mi | 3/2.0 | 1,400 (-8%) | 7mo | $93,000 | $66 | 66 |
| 2236 2nd Pl NE | 0.43mi | 3/2.0 | 1,392 (-9%) | 3mo | $195,000 | $140 | 63 |
| 2212 Shirley Dr | 0.71mi | 3/2.0 | 1,518 (-0%) | 5mo | $199,900 | $132 | 61 |
| 2649 6th St | 0.53mi | 3/2.5 | 1,666 (+9%) | 6mo | $195,000 | $117 | 53 |
| 401 20th Ct NE | 0.62mi | 3/2.0 | 1,655 (+8%) | 8mo | $45,000 | $27 | 51 |
| 217 22nd Ave NE | 0.58mi | 4/2.0 (+1) | 1,327 (-13%) | 7mo | $138,000 | $104 | 40 |
| 3009 Wood Cir | 0.68mi | 3/2.5 | 1,734 (+14%) | 7mo | $195,000 | $112 | 38 |
Match score weights: distance 35% · size 25% · config 20% · recency 20%. Top-matched comps best support the ARV.
Projected returns pro-forma
-3.0% appreciation · 3.04% rent growth · sell at horizon
- IRR
- -4.5%
- Equity multiple
- 0.83×
- Total profit
- $-6,537
- Equity at exit
- $20,860
- IRR
- 5.2%
- Equity multiple
- 1.38×
- Total profit
- $15,081
- Equity at exit
- $12,096
Cash invested: $39,172 (down + closing). Projections, not guarantees.
Landlord ↔ Tenant lean methodology
- Overall (STATE)
- 90 Strongly Landlord-Friendly
- State Alabama
- 90 Strongly Landlord-Friendly · R+15
- County
- — inherits STATE
- City
- — inherits STATE
ZIP-level market 35215
- Home prices YoY
- -34.4%
- Rents YoY
- 3.0%
- Active inventory
- 334
- Price-to-rent
- 8.4×
Monthly cashflow live
- Estimated rent
- $1,385 high interval (Pro) →
- Mortgage (P&I)
- −$734
- Tax from tax record
- −$49 /mo · $582/yr
- Insurance
- −$58
- HOA
- −$0
- Vacancy / Maint / Mgmt
- −$291
- Net cashflow
- $253
Break-even live
UW: 25.0% down · 7.5% · 30yr · 1.5% tax · 5.0% vac · 8.0% maint · 8.0% mgmt
Financing live
Cash to close
- Down payment
- $34,975
- Closing costs
- $4,197
- Reserves months
- —
- Total cash needed
- —
Loan-product check · same deal, 3 products live
Conventional
25% down · 7.5% · 30yr
- Down + closing
- —
- Monthly P&I
- —
- Monthly cashflow
- —
- DSCR
- —
- Eligible?
- —
Personal DTI + credit; lowest rate.
DSCR
20% down · 8.5% · 30yr
- Down + closing
- —
- Monthly P&I
- —
- Monthly cashflow
- —
- DSCR
- —
- Eligible?
- —
No personal income docs; deal must DSCR.
Hard money
10% down · 12.0% · 12mo
- Down + closing
- —
- Monthly P&I
- —
- Monthly cashflow
- —
- DSCR
- —
- Eligible?
- —
Short-term bridge; refi at stabilization.
Rent comps 40 comps
| Address | Beds | Baths | Sqft | Rent | $/sqft | DOM | Units | Dist |
|---|---|---|---|---|---|---|---|---|
| 2324 3rd St NE Center Point, AL | 3.0 | 2.0 | 1329 | $1,300 | $0.98 | 23d | 1 | 0.26mi |
| 332 23rd Ave NE Center Point, AL | 3.0 | 1.0 | 1100 | $1,350 | $1.23 | 3d | 1 | 0.28mi |
| 2708 7th St NE Center Point, AL | 3.0 | 1.0 | 1451 | $1,150 | $0.79 | 43d | 1 | 0.38mi |
| 2245 3rd St NE Center Point, AL | 3.0 | 1.0 | 1150 | $1,100 | $0.96 | 23d | 1 | 0.39mi |
| 2629 Wood Dr NE Center Point, AL | 3.0 | 1.0 | 1203 | $1,250 | $1.04 | 43d | 1 | 0.39mi |
| 2249 4th Place Cir NE Center Point, AL | 3.0 | 1.5 | 1400 | $1,400 | $1.00 | 43d | 1 | 0.40mi |
| 2229 3rd St NE Center Point, AL | 3.0 | 1.0 | 1215 | $1,125 | $0.93 | 23d | 1 | 0.48mi |
| 2232 6th St NE Center Point, AL | 3.0 | 1.0 | 1550 | $1,150 | $0.74 | 43d | 1 | 0.51mi |
| 2655 6th St NE Center Point, AL | 3.0 | 2.0 | 1600 | $1,390 | $0.87 | 3d | 1 | 0.52mi |
| 605 Country View Dr Birmingham, AL | 3.0 | 2.0 | 1698 | $1,560 | $0.92 | 43d | 1 | 0.53mi |
| 607 Country View Dr Birmingham, AL | 4.0 | 2.0 | 1568 | $1,550 | $0.99 | 23d | 1 | 0.54mi |
| 413 20th Ct NE Center Point, AL | 3.0 | 1.5 | 1540 | $1,375 | $0.89 | 43d | 1 | 0.65mi |
| 127 Fox Hill Ct Center Point, AL | 3.0 | 2.0 | 1418 | $1,545 | $1.09 | 43d | 1 | 0.71mi |
| 3309 Chase Ln Unit 3309 Birmingham, AL | 2.0 | 2.0 | 1068 | $1,000 | $0.94 | 43d | 1 | 0.77mi |
| 600 20th Ct NE Center Point, AL | 3.0 | 2.0 | 1878 | $1,650 | $0.88 | 23d | 1 | 0.77mi |
| 856 Parkbrook Trl Birmingham, AL | 1.0–3.0 | 1.0–2.0 | 925 | $1,180 | $1.28 | 2d | 10 | 0.84mi |
| 2415 Ormond Dr Center Point, AL | 3.0 | 1.5 | 1194 | $1,295 | $1.08 | 43d | 1 | 0.87mi |
| 3073 Panorama E Birmingham, AL | 1.0–3.0 | 1.0–2.0 | 975 | $1,275 | $1.31 | 1d | 20 | 0.94mi |
| 2245 3rd St NW Center Point, AL | 3.0 | 1.0 | 1156 | $1,100 | $0.95 | 23d | 1 | 1.01mi |
| 319 23rd Ave NW Center Point, AL | 3.0 | 2.0 | 1284 | $1,395 | $1.09 | 43d | 1 | 1.07mi |
| 408 Sunhill Rd NW Center Point, AL | 3.0 | 1.5 | 1290 | $1,355 | $1.05 | 43d | 1 | 1.10mi |
| 107 Sterling Ct NW Center Point, AL | 2.0 | 1.5–2.0 | 1026 | $1,062 | $1.04 | 3d | 4 | 1.11mi |
| 202 Westchester Dr Birmingham, AL | 4.0 | 2.0 | 1374 | $1,300 | $0.95 | 23d | 1 | 1.18mi |
| 1905 2nd St NW Center Point, AL | 3.0 | 1.0 | 1258 | $1,395 | $1.11 | 43d | 1 | 1.19mi |
| 1935 Springlake Ct Unit 1 Birmingham, AL | 2.0 | 1.5 | 1152 | $1,095 | $0.95 | 43d | 1 | 1.19mi |
| 2412 4th St NW Center Point, AL | 3.0 | 1.0 | 1224 | $1,150 | $0.94 | 16d | 1 | 1.19mi |
| 113 19th Ave NW Center Point, AL | 3.0 | 2.0 | 1407 | $1,250 | $0.89 | 11d | 1 | 1.19mi |
| 2416 4th St NW Center Point, AL | 4.0 | 2.0 | 1400 | $1,500 | $1.07 | 23d | 1 | 1.19mi |
| 1845 Stonehenge Dr Birmingham, AL | 3.0 | 2.0 | 1358 | $1,323 | $0.97 | 14d | 1 | 1.20mi |
| 4464 Winchester Hills Way Birmingham, AL | 3.0 | 2.0 | 1178 | $1,750 | $1.49 | 43d | 1 | 1.24mi |
| 4464 Winchester Hills Ln Pinson, AL | 3.0 | 2.0 | 1500 | $1,750 | $1.17 | 11d | 1 | 1.24mi |
| 2320 5th St NW Center Point, AL | 3.0 | 1.0 | 1098 | $1,150 | $1.05 | 43d | 1 | 1.25mi |
| 5010 Darlene Dr Pinson, AL | 3.0 | 2.0 | 1914 | $1,550 | $0.81 | 23d | 1 | 1.25mi |
| 1720 2nd St NE Center Point, AL | 3.0 | 2.0 | 1100 | $1,400 | $1.27 | 43d | 1 | 1.26mi |
| 1104 Oak Creek Trl NE Birmingham, AL | 3.0 | 2.0 | 1233 | $1,543 | $1.25 | 2d | 1 | 1.26mi |
| 424 Tupelo Way Center Point, AL | 4.0 | 2.0 | 1233 | $1,300 | $1.05 | 43d | 1 | 1.30mi |
| 5240 Jean Dr Pinson, AL | 4.0 | 2.0 | 1714 | $1,695 | $0.99 | 43d | 1 | 1.32mi |
| 2613 5th St NW Center Point, AL | 3.0 | 1.0 | 1170 | $1,150 | $0.98 | 11d | 1 | 1.33mi |
| 305 18th Ct NW Center Point, AL | 3.0 | 1.5 | 1270 | $1,100 | $0.87 | 43d | 1 | 1.35mi |
| 1819 Valley Run Cir Birmingham, AL | 4.0 | 2.5 | 1694 | $1,761 | $1.04 | 43d | 1 | 1.39mi |
Listing history 18 events
-
2026-06-17status $139,900 Pending 54 DOM
-
2026-06-17days on market $139,900 Active 54 DOM
-
2026-06-16days on market $139,900 Active 53 DOM
-
2026-06-15days on market $139,900 Active 52 DOM
-
2026-06-13days on market $139,900 Active 50 DOM
-
2026-06-10days on market $139,900 Active 47 DOM
-
2026-06-09pricedays on market $139,900 Active 46 DOM
-
2026-06-08days on market $159,900 Active 45 DOM
-
2026-06-07days on market $159,900 Active 44 DOM
-
2026-06-03days on market $159,900 Active 40 DOM
-
2026-06-02days on market $159,900 Active 39 DOM
-
2026-06-01days on market $159,900 Active 38 DOM
-
2026-05-31days on market $159,900 Active 37 DOM
-
2026-05-09status Active 261-char remark
-
2026-04-30historical Contingent 261-char remark
-
2026-04-24$159,900 Active 261-char remark
-
1980-12-19soldstatus $55,000
-
1979-11-01soldstatus $55,900
ⓘ Source: listings_history table (triggers on properties + properties_extension) + one-shot
backfill from property_details.listing_events for pre-trigger history.
Tax reassessment forecast AL · Resets to sale price
- Current annual tax
- $582 · $49/mo
- Projected year-2 tax
- $582 · $49/mo
- Expected delta
- $0/yr ($0/mo · 0.0%)
ⓘ Screening estimate from a state-policy table — verify with the county assessor before closing.
Climate risk First Street
- Flood 1/10 Low FEMA zone X (unshaded) · 0% chance over 30 yrs
- Wildfire 3/10 Moderate
- Heat 5/10 Major 7 d/yr ≥105°F today · 19 d/yr by 30 yrs out
- Wind 6/10 Major 27% chance of damaging wind over 30 yrs
- Air quality 5/10 Major 7 unhealthy d/yr today · 9 by 30 yrs out
Nearby sold comps map
Loading sold comps map…
Walkable amenities ~0.75 mi
Loading nearby amenities…
Taxation est. · year 1
- Rental income
- $16,615
- − Mortgage interest
- −$7,837
- − Property taxes
- −$582
- − Insurance
- −$700
- − Repairs & maintenance
- −$1,329
- − Management
- −$1,329
- − Depreciation
- −$4,070
- Taxable income
- $768
- Est. tax owed @ 24.0%
- −$184
- After-tax cash flow
- $2,855/yr
For passive investors: Depreciation is non-cash, so a rental often shows a tax loss while cash-flowing — sheltering income. Rental losses are passive: they offset passive income freely, and up to $25,000/yr can offset ordinary (W-2) income if you actively participate and your MAGI is under $100k (phasing out to $0 by $150k); unused losses carry forward. On sale, claimed depreciation is recaptured at up to 25%, and gains may owe capital-gains tax (a 1031 exchange can defer both). Figures are a year-1 estimate at your 24.0% rate — not tax advice; consult a CPA.
Schools (NCES district)
- District
- Jefferson County
- NCES district ID
- 0101920
- Math proficiency
- 9% ▼ -24.00%
- Reading proficiency
- 32% ▼ -5.00%
- Median HH income
- $51,712
- Composite
- 18.4/100
- National rank
- #8937
- State rank
- #104 of 129 in AL
Livability — Center Point
- Score
- 63/100
- State rank
- #193
- US rank
- #15671
Category grades
Schools grade is shown separately in the Schools card above.
Census & demographics
- Census place
- Center Point, AL
- County
- Jefferson County · 527,445 people
- City population
- 43,903
- Metro
- Birmingham-Hoover, AL
- Population (ZIP)
- 43,903
- Household income
- $52,793
- Rent vs Own
- Severe rent burden
- 1729.0
Population outlook (Jefferson County) Hauer SSP2
- Today (2025)
- 669,185 people
- By 2030
- 669,694 · +0.1%
- By 2040
- 661,388 · -1.2%
- By 2050
- 643,086 · -3.9%
- By 2075
- 577,267 · -13.7%
- By 2100
- 474,758 · -29.1%
Race, ethnicity, and origin ACS 2023
- Neighborhood character
- Predominantly Black (75%)
- Race & ethnicity
- Black 75% White 15% Hispanic / Latino 7% Two or more races 3%
- Hispanic origin (detail)
- Mexican 4%
- Common ancestry
- Lithuanian 1% Italian 1% Slovak 1%
- Foreign-born
- 4% · Canada
- Languages at home
- 92% English-only · Spanish 7%
Political lean MEDSL · Jefferson
- 2024 margin
- D (+10.4) · D 54.6% · R 44.2% · Other 1.2%
- 2008→2024 swing
- +5.4pp toward D · 2008: 5.1pp · 2024: 10.4pp
- All cycles
- 2024: D+10.4 2020: D+13.2 2016: D+7.2 2012: D+6.0 2008: D+5.1
Not yet ingested
- Civics
- —
Market trends
- HPI YoY
- ▼ -112.97%
- Current HPI
- 215.0607
- Rent YoY
- ▲ 3.04%
- Metro
- Birmingham-Hoover, AL
- State GDP YoY
- ▲ 2.94%
- F500 in state
- 4
Industry mix (Fortune 500 HQ in AL)
| Industry | F500 HQs | Revenue |
|---|---|---|
| Financial Services | 1 | $8B |
|
||
| Healthcare | 1 | $5B |
|
||
Price history
+150.3% since first listed7 events — show timeline
- 2026-06-17 Pending — Greater Alabama MLS
- 2026-06-09 Price Changed $139,900 Greater Alabama MLS
- 2026-05-09 Relisted — Greater Alabama MLS
- 2026-04-30 Contingent — Greater Alabama MLS
- 2026-04-24 Listed $159,900 Greater Alabama MLS
- 1980-12-19 Sold (Public Records) $55,000 Public Records
- 1979-11-01 Sold (Public Records) $55,900 Public Records
Property tax history
+5.7%/yrLatest (2024): $582 · +48.8% YoY. Source: county tax records.
Cash-flow waterfall
monthlySold comps — $/sqft
last 12 mo · ≤1 miLoading sold comps…