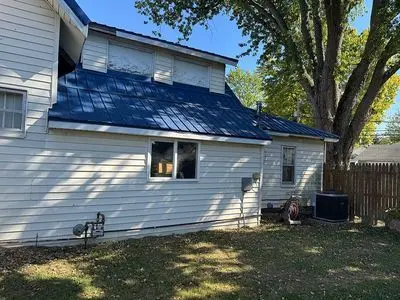
402 E Marion St · Converse, IN
Flood risk 1/10 · Minimal
- FEMA flood zone
- X (unshaded)
- Chance of flooding over 30 yrs
- 0.0%
- Est. flood insurance / yr
- $507 – $1,088
Fire risk 1/10 · Minimal
- Est. fire insurance / yr
- $717 – $1,331
Heat risk 3/10 · Minor
- Hot days now (above 101°F)
- 7 days/yr
- Hot days in 30 yrs
- 17 days/yr
Wind risk 2/10 · Minimal
- Chance of severe wind over 30 yrs
- —
Air-quality risk 3/10 · Minor
- Unhealthy air days now
- 1 days/yr
- Unhealthy air days in 30 yrs
- 3 days/yr
Risk factors via First Street. Map © Google.
Why this score? — see what drove the B grade
The composite is a weighted blend of 9 inputs, each scored 0–100. Each bar is that input's sub-score; the figure is the points it added to the 100-point composite (weight × sub-score).
- Cash flow +30.0/30.0
- DSCR +10.0/10.0
- 1% rule +9.3/10.0
- ARV discount +7.5/15.0
- Appreciation +4.1/10.0
- Schools +3.9/10.0
- Livability +3.3/5.0
- Rent growth +2.5/5.0
- Condition / age +2.5/5.0
$65,000
🖨 Deal sheet (PDF) 📄 Offer letter ✓ Due diligence
Listing remarks MLS
4 bedroom Craftsman Home. Needs some TLC. Wood patio deck. Living room features brick faced, wood burning fireplace. Some natural woodwork. Partial privacy fenced backyard. Storage shed. 22x28 concrete slab for oversized two car garage.
Key facts
- Replaced ac
- Renovated bathroom
- Bonus room
Tags
Neighborhood map
What this means for you Summary
Snapshot
- This is a 2-bed/1.0-bath single-family listed at $65k.
Deal economics
- At list price, monthly cash flow is $310 ($4k/yr) — positive.
- The deal already cash-flows at list — no discount required.
- Meets the 1% rule at list price ($933 rent vs $65k).
- Recommended offer: $63k (3.0% below list) — sets the bar for market timing.
Location & tenants
- Location reads 66/100 on livability (#289 in IN) — a middle-class / working-renter tenant base. Strengths: crime A+, cost of living A+, housing A+; Watch: schools D-, amenities F, commute F.
- Oak Hill United School Corporation (rural): math 40% / reading 50% proficiency, ranked #96 of 301 in IN (top 32%) — families likely to look elsewhere, expect single-tenant / working-renter base with shorter leases.
- Market conditions: 12 active listings in the ZIP; 35 units permitted in Miami County in 2024 (0 in 5+ unit buildings).
Forward outlook
- Local home prices are declining (-1.8%/yr); year-one equity from $449 of loan paydown is wiped out by about $1k of value loss. Plan a longer hold.
- Miami County population projected at -12% by 2050 — secular population decline; favor cash flow + early exit over multi-decade hold.
- At projected returns (-1.8% appreciation + 3.0% rent growth), your $18k cash investment doubles in ~6 years — after that, you're playing with house money.
Negotiation context
- It's been on market 38 days — a 3% lower offer ($63k) is reasonable based on typical stale-listing flexibility.
- 5 sale attempts since 5y ago with the ask held roughly flat each time — persistent listings suggest the price (not the market) is what's stuck; bring a comps-based counter.
- Current owner paid $19k; list at $65k implies a 242% gain — meaningful room to come down on a strong offer.
Risks & watch-outs
- Watch-outs: built in 1930 — expect roof / HVAC / electrical / plumbing capex.
Questions for the listing agent
- It's been on market 38 days. Have you received any prior offers? Is the seller open to a 3% concession, seller financing, or rate buy-down credit?
- Built in 1930 — when were the roof, HVAC, electrical panel, plumbing, and water heater last replaced?
- Is there a deadline driving the sale (1031 exchange, divorce, estate, relocation)? That informs how much negotiation room exists.
- Schools are D-rated, which usually means shorter tenancies and higher turnover. Who's the typical renter profile here, and what's been the actual vacancy rate?
- What's the average days-on-market for RENTAL listings here right now (not sales)? A rising rental-DOM trend means longer vacancies and softer asking-rent achievability than the comps imply.
- What's the recent tenant-quality profile in this submarket — average credit score on applications, eviction rate, late-payment / NSF rate, and stable-employment percentage? A property-management company in the area should have these aggregated.
- How much new for-sale + rental construction is in the pipeline within 1–3 miles? Heavy new supply typically softens prices + rents 12–24 months out; constrained supply supports both.
Investment metrics
- 1% rule
- 1.43% ✓
- Cap rate
- 12.01%
- Cash-on-cash
- 20.41%
- DSCR
- 1.91
- GRM
- 5.8
CMA / ARV
- ARV (on-the-fly)
- $196,418
- Comps found
- 12
Show comp detail 12 sales within ~0.75 mi
| Address | Dist | Beds/Ba | Sqft | Sold | Price | $/sf | Match |
|---|---|---|---|---|---|---|---|
| 39 Howard St | 0.11mi | 3/2.5 (+1) | 1,849 (-0%) | 8mo | $341,977 | $185 | 77 |
| 107 N Eward | 0.12mi | 2/1.0 | 1,990 (+7%) | 8mo | $59,900 | $30 | 76 |
| 40 Howard St | 0.11mi | 3/2.0 (+1) | 1,717 (-7%) | 0mo | $346,898 | $202 | 73 |
| 213 W Water St | 0.38mi | 2/1.5 | 1,764 (-5%) | 3mo | $85,000 | $48 | 70 |
| 103 E 2nd St | 0.39mi | 3/1.5 (+1) | 1,902 (+3%) | 3mo | $94,000 | $49 | 68 |
| 36 Howard St | 0.11mi | 3/2.0 (+1) | 1,697 (-8%) | 6mo | $354,110 | $209 | 67 |
| 28 Grant Ct | 0.11mi | 3/2.5 (+1) | 1,898 (+2%) | 22mo | $348,562 | $184 | 62 |
| 112 N Madison St | 0.20mi | 3/2.0 (+1) | 1,688 (-9%) | 13mo | $178,500 | $106 | 56 |
| 9933 W Delphi Pike | 0.36mi | 3/1.5 (+1) | 1,836 (-1%) | 23mo | $117,500 | $64 | 56 |
| 1005 N Jefferson St | 0.72mi | 3/2.0 (+1) | 1,920 (+4%) | 10mo | $340,000 | $177 | 43 |
| 13087 S Elm St | 0.52mi | 3/2.0 (+1) | 1,672 (-10%) | 9mo | $121,000 | $72 | 43 |
| 9918 W Delphi Pike | 0.37mi | 3/1.5 (+1) | 2,124 (+15%) | 15mo | $90,000 | $42 | 39 |
Match score weights: distance 35% · size 25% · config 20% · recency 20%. Top-matched comps best support the ARV.
Projected returns pro-forma
-1.76% appreciation · 3.0% rent growth · sell at horizon
- IRR
- 16.0%
- Equity multiple
- 1.69×
- Total profit
- $12,624
- Equity at exit
- $13,348
- IRR
- 22.8%
- Equity multiple
- 3.17×
- Total profit
- $39,491
- Equity at exit
- $12,105
Cash invested: $18,200 (down + closing). Projections, not guarantees.
Landlord ↔ Tenant lean methodology
- Overall (STATE)
- 90 Strongly Landlord-Friendly
- State Indiana
- 90 Strongly Landlord-Friendly · R+11
- County
- — inherits STATE
- City
- — inherits STATE
ZIP-level market 46919
- Home prices YoY
- -0.8%
- Active inventory
- 12
- Price-to-rent
- 5.8×
Monthly cashflow live
- Estimated rent
- $933 medium interval (Pro) →
- Mortgage (P&I)
- −$341
- Tax from tax record
- −$59 /mo · $710/yr
- Insurance
- −$27
- HOA
- −$0
- Vacancy / Maint / Mgmt
- −$196
- Net cashflow
- $310
Break-even live
Sensitivity live
| Price | -10% $346 | -5% $328 | +0% $310 | +5% $291 | +10% $273 |
|---|---|---|---|---|---|
| Rent | -10% $236 | -5% $273 | +0% $310 | +5% $346 | +10% $383 |
| Rate | -1.0pp $342 | -0.5pp $326 | base $310 | +0.5pp $293 | +1.0pp $276 |
UW: 25.0% down · 7.5% · 30yr · 1.5% tax · 5.0% vac · 8.0% maint · 8.0% mgmt
Financing live
Cash to close
- Down payment
- $16,250
- Closing costs
- $1,950
- Reserves months
- —
- Total cash needed
- —
Loan-product check · same deal, 3 products live
Conventional
25% down · 7.5% · 30yr
- Down + closing
- —
- Monthly P&I
- —
- Monthly cashflow
- —
- DSCR
- —
- Eligible?
- —
Personal DTI + credit; lowest rate.
DSCR
20% down · 8.5% · 30yr
- Down + closing
- —
- Monthly P&I
- —
- Monthly cashflow
- —
- DSCR
- —
- Eligible?
- —
No personal income docs; deal must DSCR.
Hard money
10% down · 12.0% · 12mo
- Down + closing
- —
- Monthly P&I
- —
- Monthly cashflow
- —
- DSCR
- —
- Eligible?
- —
Short-term bridge; refi at stabilization.
Listing history 24 events
-
2026-06-19days on market $65,000 Active 38 DOM
-
2026-06-18days on market $65,000 Active 37 DOM
-
2026-06-17days on market $65,000 Active 36 DOM
-
2026-06-16days on market $65,000 Active 35 DOM
-
2026-06-15days on market $65,000 Active 34 DOM
-
2026-06-14days on market $65,000 Active 32 DOM
-
2026-06-12days on market $65,000 Active 31 DOM
-
2026-06-09days on market $65,000 Active 28 DOM
-
2026-06-08days on market $65,000 Active 27 DOM
-
2026-06-07days on market $65,000 Active 26 DOM
-
2026-06-05days on market $65,000 Active 23 DOM
-
2026-06-03days on market $65,000 Active 22 DOM
-
2026-06-02days on market $65,000 Active 21 DOM
-
2026-06-01days on market $65,000 Active 20 DOM
-
2026-05-31days on market $65,000 Active 19 DOM
-
2026-05-30days on market $65,000 Active 18 DOM
-
2026-05-12$65,000 Active 511-char remark
-
2022-04-20soldstatus $19,000 236-char remark
Show marketing remark (236 chars)
4 bedroom Craftsman Home. Needs some TLC. Wood patio deck. Living room features brick faced, wood burning fireplace. Some natural woodwork. Partial privacy fenced backyard. Storage shed. 22x28 concrete slab for oversized two car garage.
-
2022-04-20soldstatus $19,000
Show marketing remark (236 chars)
4 bedroom Craftsman Home. Needs some TLC. Wood patio deck. Living room features brick faced, wood burning fireplace. Some natural woodwork. Partial privacy fenced backyard. Storage shed. 22x28 concrete slab for oversized two car garage.
-
2022-03-10$24,900
Show marketing remark (236 chars)
4 bedroom Craftsman Home. Needs some TLC. Wood patio deck. Living room features brick faced, wood burning fireplace. Some natural woodwork. Partial privacy fenced backyard. Storage shed. 22x28 concrete slab for oversized two car garage.
-
2022-03-10$24,900 236-char remark
Show marketing remark (236 chars)
4 bedroom Craftsman Home. Needs some TLC. Wood patio deck. Living room features brick faced, wood burning fireplace. Some natural woodwork. Partial privacy fenced backyard. Storage shed. 22x28 concrete slab for oversized two car garage.
-
2021-12-08historical
-
2021-08-24$29,900
-
2021-08-24$29,900
ⓘ Source: listings_history table (triggers on properties + properties_extension) + one-shot
backfill from property_details.listing_events for pre-trigger history.
Tax reassessment forecast IN · Partial reset (capped growth)
- Current annual tax
- $710 · $59/mo
- Projected year-2 tax
- $710 · $59/mo
- Expected delta
- $0/yr ($0/mo · 0.0%)
ⓘ Screening estimate from a state-policy table — verify with the county assessor before closing.
Climate risk First Street
- Flood 1/10 Low FEMA zone X (unshaded) · 0% chance over 30 yrs
- Wildfire 1/10 Low
- Heat 3/10 Moderate 7 d/yr ≥101°F today · 17 d/yr by 30 yrs out
- Wind 2/10 Low
- Air quality 3/10 Moderate 1 unhealthy d/yr today · 3 by 30 yrs out
Nearby sold comps map
Loading sold comps map…
Walkable amenities ~0.75 mi
Loading nearby amenities…
Taxation est. · year 1
- Rental income
- $11,191
- − Mortgage interest
- −$3,641
- − Property taxes
- −$710
- − Insurance
- −$325
- − Repairs & maintenance
- −$895
- − Management
- −$895
- − Depreciation
- −$1,891
- Taxable income
- $2,833
- Est. tax owed @ 24.0%
- −$680
- After-tax cash flow
- $3,035/yr
For passive investors: Depreciation is non-cash, so a rental often shows a tax loss while cash-flowing — sheltering income. Rental losses are passive: they offset passive income freely, and up to $25,000/yr can offset ordinary (W-2) income if you actively participate and your MAGI is under $100k (phasing out to $0 by $150k); unused losses carry forward. On sale, claimed depreciation is recaptured at up to 25%, and gains may owe capital-gains tax (a 1031 exchange can defer both). Figures are a year-1 estimate at your 24.0% rate — not tax advice; consult a CPA.
Schools (NCES district)
- District
- Oak Hill United School Corporation
- NCES district ID
- 1808340
- Math proficiency
- 40% ▼ -1.00%
- Reading proficiency
- 50% ▼ -2.00%
- Median HH income
- $52,442
- Composite
- 38.84/100
- National rank
- #4105
- State rank
- #96 of 301 in IN
Livability — Converse
- Score
- 66/100
- State rank
- #289
- US rank
- #11781
Category grades
Schools grade is shown separately in the Schools card above.
Census & demographics
- Census place
- Converse, IN
- Population (ZIP)
- 1,792
Population outlook (Miami County) Hauer SSP2
- Today (2025)
- 34,421 people
- By 2030
- 33,571 · -2.5%
- By 2040
- 31,919 · -7.3%
- By 2050
- 30,313 · -11.9%
- By 2075
- 26,202 · -23.9%
- By 2100
- 20,856 · -39.4%
Race, ethnicity, and origin ACS 2023
- Neighborhood character
- Predominantly White (96%)
- Race & ethnicity
- White 96% Two or more races 3%
- Common ancestry
- Scandinavian 2% Iranian 2% Lithuanian 1%
- Foreign-born
- 1% · South Korea
- Languages at home
- 98% English-only · Spanish 1%
Political lean MEDSL · Miami
- 2024 margin
- Solid R (+54.5) · D 21.8% · R 76.3% · Other 1.9%
- 2008→2024 swing
- -35.1pp toward R · 2008: -19.5pp · 2024: -54.5pp
- All cycles
- 2024: R+54.5 2020: R+53.1 2016: R+53.6 2012: R+30.9 2008: R+19.5
Not yet ingested
- Civics
- —
Market trends
- HPI YoY
- ▼ -1.76%
- Current HPI
- 214.1898
- Rent YoY
- —
- Metro
- —
- State GDP YoY
- ▲ 2.90%
- F500 in state
- 18
Industry mix (Fortune 500 HQ in IN)
| Industry | F500 HQs | Revenue |
|---|---|---|
| Industrial Machinery | 2 | $37B |
|
||
| Healthcare | 1 | $177B |
|
||
| Pharmaceuticals | 1 | $45B |
|
||
| Metals / Steel | 1 | $18B |
|
||
| Agriculture | 1 | $17B |
|
||
| Packaging | 1 | $12B |
|
||
Price history
+117.4% since first listed8 events — show timeline
- 2026-05-12 Listed $65,000 FSBO.com
- 2022-04-20 Sold (MLS) $19,000 MIBOR as Distributed by MLS Grid
- 2022-04-20 Sold (MLS) $19,000 IRMLS
- 2022-03-10 Listed $24,900 MIBOR as Distributed by MLS Grid
- 2022-03-10 Listed $24,900 IRMLS
- 2021-12-08 Listing Removed — MIBOR as Distributed by MLS Grid
- 2021-08-24 Listed $29,900 MIBOR as Distributed by MLS Grid
- 2021-08-24 Listed $29,900 IRMLS
Property tax history
-11.6%/yrLatest (2024): $710 · -4.5% YoY. Source: county tax records.
Cash-flow waterfall
monthlySold comps — $/sqft
last 12 mo · ≤1 miLoading sold comps…