 🏗️ New Construction
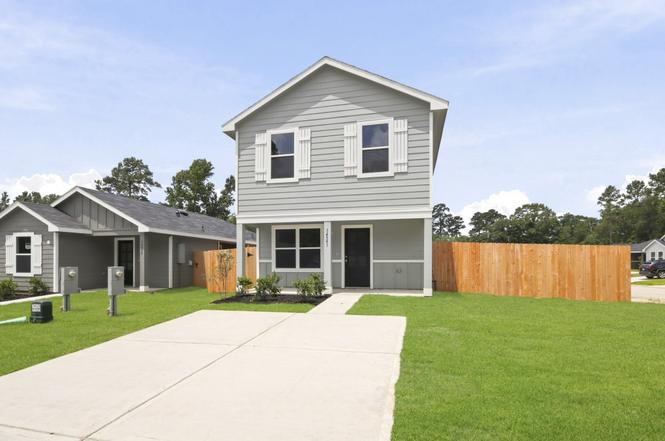
14541 William Trails Dr · Willis, TX
Flood risk No data
- FEMA flood zone
- —
- Chance of flooding over 30 yrs
- —
- Est. flood insurance / yr
- —
Fire risk No data
- Est. fire insurance / yr
- —
Heat risk No data
- Hot days now (above threshold)
- —
- Hot days in 30 yrs
- —
Wind risk No data
- Chance of severe wind over 30 yrs
- —
Air-quality risk No data
- Unhealthy air days now
- —
- Unhealthy air days in 30 yrs
- —
Risk factors via First Street. Map © Google.
Why this score? — see what drove the D+ grade
The composite is a weighted blend of 9 inputs, each scored 0–100. Each bar is that input's sub-score; the figure is the points it added to the 100-point composite (weight × sub-score).
- Cash flow +18.4/30.0
- ARV discount +7.5/15.0
- DSCR +5.8/10.0
- 1% rule +5.2/10.0
- Schools +3.2/10.0
- Livability +3.1/5.0
- Rent growth +2.7/5.0
- Condition / age +2.5/5.0
- Appreciation +0.9/10.0
$169,990
🖨 Deal sheet 📄 Offer letter ✓ Due diligence
Key facts
- Covered front porch
- Utility room
- Walk-in closet
Tags
Property features AI
Finance
- Other: Municipal Utility District disclosure available
- Financial info: Lease not considered
- HOA & community: Community managed by Inframark; Annual association fee of $500
Exterior
- Parking: No parking details provided
- Security: Prewired for security; Smoke detectors
- Utilities: Public water; Public sewer
- Home design: Residential property; Under construction (new construction); Slab foundation; Composition roof
- Construction: Built by D.R. Horton; Cement siding; Year built 2026
- Exterior features: Porch; Private yard; Located in a subdivision
Interior
- Kitchen: Dishwasher; Electric cooktop; Electric oven; Microwave; Disposal
- Bedrooms: Primary bedroom on second level (approx. 12 x 12); Bedroom on second level (approx. 11 x 10); Bedroom on second level (approx. 11 x 10)
- Flooring: Carpet; Vinyl
- Bathrooms: 2 full bathrooms; 1 half bathroom
- Heating & cooling: Central heating (electric); Central air conditioning (electric); Thermostat (energy efficient)
- Interior features: Granite counters; Kitchen/dining combo; Living/dining room; Programmable thermostat; Ventilation (improved indoor air quality)
- Laundry & utility: Washer hookup; Electric dryer hookup
Neighborhood map
What this means for you Summary
Snapshot
- This is a 3-bed/2.5-bath single-family listed at $170k.
Deal economics
- At list price, monthly cash flow is $167 ($2k/yr) — positive.
- The deal already cash-flows at list — no discount required.
- Meets the 1% rule at list price ($2k rent vs $170k).
- Recommended offer: $150k (12.0% below list) — sets the bar for market timing.
- Cap rate 7.4% vs local median 4.7% in Willis — top-decile yield for the area; either an underpriced asset or a hidden risk that comps aren't pricing in. Stress-test before assuming the spread holds.
Location & tenants
- Location reads 62/100 on livability (#933 in TX) — a middle-class / working-renter tenant base. Strengths: cost of living A+, housing A+; Watch: crime C-, employment D+, amenities F.
- Willis ISD (rural): math 33% / reading 40% proficiency, ranked #458 of 826 in TX (top 55%) — families likely to look elsewhere, expect single-tenant / working-renter base with shorter leases.
- Zoned schools: Edward B Cannan El (math 34% / reading 32%, grade F, #2,208 of 4,322 statewide, top 52%, 672 students, 74% FRL); Lynn Lucas Middle (math 23% / reading 32%, grade F, #1,156 of 1,662 statewide, top 71%, 971 students, 74% FRL); Willis H S (math 19% / reading 46%, grade F, #1,029 of 1,632 statewide, top 64%, 2,521 students, 57% FRL).
- Market conditions: Rents flat; 710 active listings in the ZIP; 13,259 units permitted in Montgomery County in 2024 (1,402 in 5+ unit buildings).
- This rent runs 31% of the median local income ($71k/yr) — at the standard rent-burdened threshold; future hikes will face affordability resistance.
Forward outlook
- Local home prices are declining (-3.0%/yr); year-one equity from $1k of loan paydown is wiped out by about $5k of value loss. Plan a longer hold.
- Montgomery County population projected at +65% by 2050 — long-run rental-demand tailwind backs the buy-and-hold thesis.
Negotiation context
- It's been on market 209 days — a 12% lower offer ($150k) is reasonable based on typical stale-listing flexibility.
- 2 sale attempts; this cycle's ask has dropped $18k (10%) from the opening price — seller is motivated, your offer sets the floor, not the list.
Questions for the listing agent
- It's been on market 209 days. Have you received any prior offers? Is the seller open to a 12% concession, seller financing, or rate buy-down credit?
- What does the HOA fee cover, when was the last increase, and are there any pending special assessments or reserve-fund shortfalls?
- Why hasn't it sold? Are there any deal-killer items the seller is aware of (foundation, flood, title, zoning, code violations)?
- Is there a deadline driving the sale (1031 exchange, divorce, estate, relocation)? That informs how much negotiation room exists.
- Schools are D-rated, which usually means shorter tenancies and higher turnover. Who's the typical renter profile here, and what's been the actual vacancy rate?
- The area grade is low — what's the realistic commute time and amenity access for the typical tenant pool here? Any planned neighborhood developments (good or bad) we should know about?
- What's the average days-on-market for RENTAL listings here right now (not sales)? A rising rental-DOM trend means longer vacancies and softer asking-rent achievability than the comps imply.
- What's the recent tenant-quality profile in this submarket — average credit score on applications, eviction rate, late-payment / NSF rate, and stable-employment percentage? A property-management company in the area should have these aggregated.
- How much new for-sale + rental construction is in the pipeline within 1–3 miles? Heavy new supply typically softens prices + rents 12–24 months out; constrained supply supports both.
Investment metrics
- 1% rule
- 1.02% ✓
- Cap rate
- 7.42%
- Cash-on-cash
- 4.02%
- DSCR
- 1.18
- GRM
- 8.1
CMA / ARV
- ARV (on-the-fly)
- $178,488
- Comps found
- 12
Show comp detail 12 sales within ~0.75 mi
| Address | Dist | Beds/Ba | Sqft | Sold | Price | $/sf | Match |
|---|---|---|---|---|---|---|---|
| 14570 William Trails Dr | 0.07mi | 3/2.5 | 1,206 (0%) | 2mo | $174,990 | $145 | 95 |
| 11822 Holly Hurst Dr | 0.14mi | 3/2.5 | 1,206 (0%) | 1mo | $173,990 | $144 | 92 |
| 14554 William Trails Dr | 0.05mi | 3/2.5 | 1,206 (0%) | 7mo | $178,990 | $148 | 92 |
| 14586 William Trails Dr | 0.10mi | 3/2.5 | 1,206 (0%) | 7mo | $178,990 | $148 | 90 |
| 14602 William Trails Dr | 0.12mi | 3/2.5 | 1,206 (0%) | 7mo | $178,990 | $148 | 89 |
| 11806 Holly Hurst Dr | 0.16mi | 3/2.5 | 1,206 (0%) | 5mo | $169,990 | $141 | 88 |
| 11818 Holly Hurst Dr | 0.15mi | 3/2.5 | 1,206 (0%) | 8mo | $169,990 | $141 | 87 |
| 11826 Holly Hurst Dr | 0.14mi | 3/2.5 | 1,206 (0%) | 9mo | $169,990 | $141 | 86 |
| 12018 William Trails Cir | 0.17mi | 3/2.5 | 1,206 (0%) | 8mo | $185,000 | $153 | 86 |
| 14619 William Trails Dr | 0.15mi | 3/2.5 | 1,206 (0%) | 9mo | $183,990 | $153 | 86 |
| 14603 William Trails Dr | 0.12mi | 3/2.5 | 1,206 (0%) | 11mo | $182,890 | $152 | 85 |
| 12011 William Trails Cir | 0.20mi | 3/2.5 | 1,206 (0%) | 9mo | $174,990 | $145 | 83 |
Match score weights: distance 35% · size 25% · config 20% · recency 20%. Top-matched comps best support the ARV.
Projected returns pro-forma
-3.0% appreciation · 0.98% rent growth · sell at horizon
- IRR
- -12.3%
- Equity multiple
- 0.56×
- Total profit
- $-21,848
- Equity at exit
- $26,613
- IRR
- -6.7%
- Equity multiple
- 0.61×
- Total profit
- $-19,419
- Equity at exit
- $15,432
Cash invested: $49,977 (down + closing). Projections, not guarantees.
Landlord ↔ Tenant lean methodology
- Overall (STATE)
- 87 Strongly Landlord-Friendly
- State Texas
- 87 Strongly Landlord-Friendly · R+5
- County
- — inherits STATE
- City
- — inherits STATE
ZIP-level market 77378
- Home prices YoY
- -3.0%
- Rents YoY
- 1.0%
- Active inventory
- 710
- Price-to-rent
- 7.8×
Monthly cashflow live
- Estimated rent
- $1,826 medium interval (Pro) →
- Mortgage (P&I)
- −$936
- Tax est. 1.5%
- −$223 /mo · $2,677/yr
- Insurance
- −$74
- HOA
- −$42
- Vacancy / Maint / Mgmt
- −$384
- Net cashflow
- $167
Break-even live
UW: 25.0% down · 7.5% · 30yr · 1.5% tax · 5.0% vac · 8.0% maint · 8.0% mgmt
Financing live
Cash to close
- Down payment
- $44,622
- Closing costs
- $5,355
- Reserves months
- —
- Total cash needed
- —
Loan-product check · same deal, 3 products live
Conventional
25% down · 7.5% · 30yr
- Down + closing
- —
- Monthly P&I
- —
- Monthly cashflow
- —
- DSCR
- —
- Eligible?
- —
Personal DTI + credit; lowest rate.
DSCR
20% down · 8.5% · 30yr
- Down + closing
- —
- Monthly P&I
- —
- Monthly cashflow
- —
- DSCR
- —
- Eligible?
- —
No personal income docs; deal must DSCR.
Hard money
10% down · 12.0% · 12mo
- Down + closing
- —
- Monthly P&I
- —
- Monthly cashflow
- —
- DSCR
- —
- Eligible?
- —
Short-term bridge; refi at stabilization.
HOA detail
- Monthly dues
- $42 · $504/yr
Listing history 18 events
-
2026-06-18days on market $169,990 Active 209 DOM
-
2026-06-17days on market $169,990 Active 208 DOM
-
2026-06-16days on market $169,990 Active 207 DOM
-
2026-06-15days on market $169,990 Active 206 DOM
-
2026-06-13pricedays on market $169,990 Active 204 DOM
-
2026-06-10price $174,990 Active 200 DOM
-
2026-06-09days on market $179,990 Active 200 DOM
-
2026-06-08days on market $179,990 Active 199 DOM
-
2026-06-07days on market $179,990 Active 198 DOM
-
2026-06-04days on market $179,990 Active 195 DOM
-
2026-06-03days on market $179,990 Active 194 DOM
-
2026-06-02days on market $179,990 Active 193 DOM
-
2026-06-01days on market $179,990 Active 192 DOM
-
2026-05-31days on market $179,990 Active 191 DOM
-
2026-05-20status Active
-
2026-03-26historical Active Under Contract
-
2025-12-06price $179,990
-
2025-11-21$187,990 Active
ⓘ Source: listings_history table (triggers on properties + properties_extension) + one-shot
backfill from property_details.listing_events for pre-trigger history.
Nearby sold comps map
Loading sold comps map…
Walkable amenities ~0.75 mi
Loading nearby amenities…
Taxation est. · year 1
- Rental income
- $21,917
- − Mortgage interest
- −$9,998
- − Property taxes
- −$2,677
- − Insurance
- −$892
- − Repairs & maintenance
- −$1,753
- − Management
- −$1,753
- − HOA
- −$504
- − Depreciation
- −$5,192
- Taxable loss
- −$854
- Est. tax savings @ 24.0%
- +$205
- After-tax cash flow
- $2,214/yr
For passive investors: Depreciation is non-cash, so a rental often shows a tax loss while cash-flowing — sheltering income. Rental losses are passive: they offset passive income freely, and up to $25,000/yr can offset ordinary (W-2) income if you actively participate and your MAGI is under $100k (phasing out to $0 by $150k); unused losses carry forward. On sale, claimed depreciation is recaptured at up to 25%, and gains may owe capital-gains tax (a 1031 exchange can defer both). Figures are a year-1 estimate at your 24.0% rate — not tax advice; consult a CPA.
Schools (NCES district)
- District
- Willis ISD
- NCES district ID
- 4845900
- Math proficiency
- 33% ▼ -15.00%
- Reading proficiency
- 40% ▼ -2.00%
- Median HH income
- $57,828
- Composite
- 32.32/100
- National rank
- #5746
- State rank
- #458 of 826 in TX
Livability — Willis
- Score
- 62/100
- State rank
- #933
- US rank
- #16579
Category grades
Schools grade is shown separately in the Schools card above.
Census & demographics
- County
- Montgomery County · 663,713 people
- City population
- 38,421
- Metro
- Houston-The Woodlands-Sugar Land, TX
- Population (ZIP)
- 17,629
- Household income
- $71,143
- Rent vs Own
- Severe rent burden
- 402.0
Population outlook (Montgomery County) Hauer SSP2
- Today (2025)
- 713,896 people
- By 2030
- 805,263 · +12.8%
- By 2040
- 992,708 · +39.1%
- By 2050
- 1,179,590 · +65.2%
- By 2075
- 1,628,084 · +128.1%
- By 2100
- 1,937,880 · +171.5%
Race, ethnicity, and origin ACS 2023
- Neighborhood character
- Diverse neighborhood (Simpson 0.55)
- Race & ethnicity
- White 58% Hispanic / Latino 32% Two or more races 14% Black 7% Native American 1%
- Hispanic origin (detail)
- Mexican 27%
- Common ancestry
- Romanian 2% Slovak 2% Serbian 1%
- Foreign-born
- 12% · Canada
- Languages at home
- 80% English-only · Spanish 19%
Political lean MEDSL · Montgomery
- 2024 margin
- Solid R (+45.5) · D 26.8% · R 72.3%
- 2008→2024 swing
- +7.2pp toward D · 2008: -52.7pp · 2024: -45.5pp
- All cycles
- 2024: R+45.5 2020: R+43.8 2016: R+51.4 2012: R+60.7 2008: R+52.7
Not yet ingested
- Civics
- —
Market trends
- HPI YoY
- ▼ -8.25%
- Current HPI
- 261.9673
- Rent YoY
- ▲ 0.98%
- Metro
- Houston-The Woodlands-Sugar Land, TX
- State GDP YoY
- ▲ 3.95%
- F500 in state
- 110
Industry mix (Fortune 500 HQ in TX)
| Industry | F500 HQs | Revenue |
|---|---|---|
| Energy | 16 | $1,198B |
|
||
| Technology | 5 | $198B |
|
||
| Engineering / Construction | 4 | $72B |
|
||
| Energy Services | 3 | $60B |
|
||
| Utilities | 3 | $41B |
|
||
| Healthcare | 2 | $330B |
|
||
Price history
-4.3% since first listed4 events — show timeline
- 2026-05-20 Relisted — HARMLS
- 2026-03-26 Contingent — HARMLS
- 2025-12-06 Price Changed $179,990 HARMLS
- 2025-11-21 Listed $187,990 HARMLS
Cash-flow waterfall
monthlySold comps — $/sqft
last 12 mo · ≤1 miLoading sold comps…