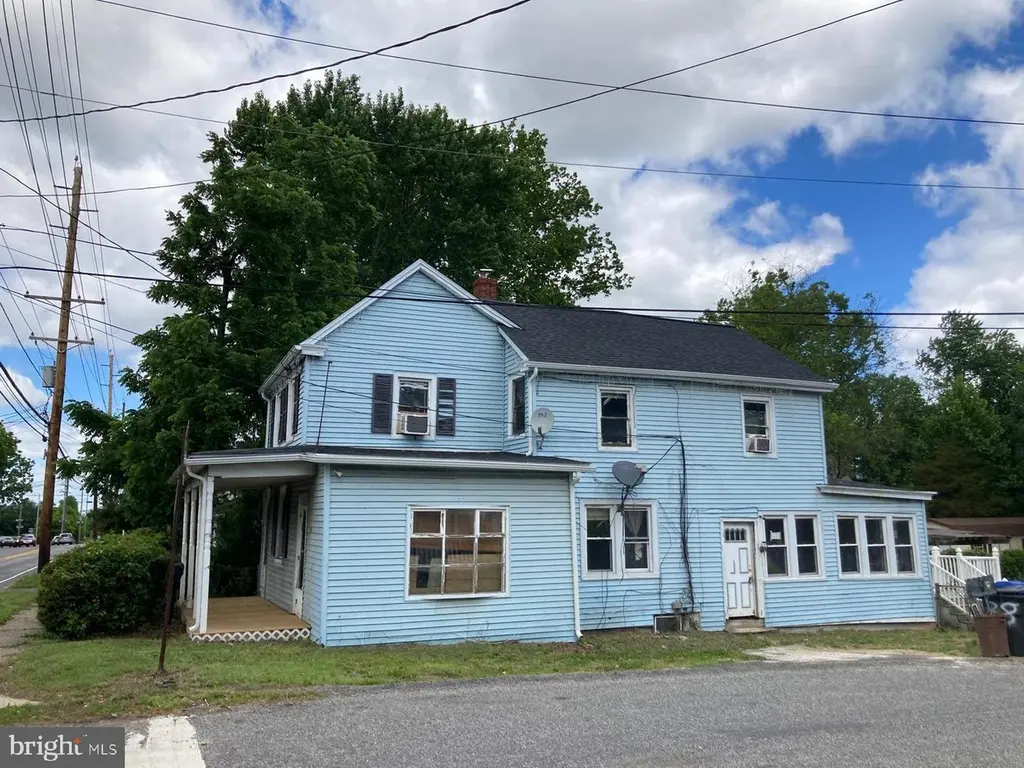
41 S Bridgeboro St · Beverly, NJ
Flood risk 1/10 · Minimal
- FEMA flood zone
- X (unshaded)
- Chance of flooding over 30 yrs
- 0.0%
- Est. flood insurance / yr
- $507 – $1,088
Fire risk 1/10 · Minimal
- Est. fire insurance / yr
- $526 – $976
Heat risk 6/10 · Moderate
- Hot days now (above 104°F)
- 7 days/yr
- Hot days in 30 yrs
- 15 days/yr
Wind risk 6/10 · Moderate
- Chance of severe wind over 30 yrs
- 36.0%
Air-quality risk 4/10 · Minor
- Unhealthy air days now
- 5 days/yr
- Unhealthy air days in 30 yrs
- 7 days/yr
Risk factors via First Street. Map © Google.
Why this score? — see what drove the C- grade
The composite is a weighted blend of 9 inputs, each scored 0–100. Each bar is that input's sub-score; the figure is the points it added to the 100-point composite (weight × sub-score).
- Cash flow +20.2/30.0
- ARV discount +7.5/15.0
- DSCR +6.4/10.0
- 1% rule +5.5/10.0
- Livability +3.8/5.0
- Schools +3.4/10.0
- Rent growth +2.5/5.0
- Condition / age +2.5/5.0
- Appreciation +0.0/10.0
$249,900
🖨 Deal sheet (PDF) 📄 Offer letter ✓ Due diligence
Listing remarks
Attention investors, flippers, and contractors! Bring your toolbelt and vision to 41 S Bridgeboro St in Delran, NJ. The home features a versatile layout with 3 bedrooms and 1 bathroom waiting to be completely customized. Recent improvements include a brand-new roof, new gutters, and structural updates. All structural improvements were completed according to an engineer's plan, and the Delran Township construction permits are officially closed. The property is being sold strictly in AS-IS condition with no repairs, warranties, or credits provided by the seller. Buyer is responsible for all municipal certifications and the certificate of occupancy. CASH ONLY. Schedule your walkthrough today a
Key facts
- Versatile layout
- Brand new roof
- New gutters
Tags
Property features AI
Exterior
- Parking: On-street parking
- Utilities: Public water; Public sewer; Natural gas
- Home design: Detached structure; Estimated year built
- Construction: Vinyl siding; Architectural shingle roof; Crawl space/other foundation
- Exterior features: 50 x 192 lot dimensions; Not in a federal flood zone
Interior
- Bedrooms: Three bedrooms on the first upper level
- Bathrooms: One full bathroom
- Heating & cooling: Forced air heating; Natural gas hot water
- Interior features: Unfinished basement; Living area measured by assessor
Neighborhood map
What this means for you Summary
Snapshot
- This is a 3-bed/1.0-bath single-family listed at $250k.
Deal economics
- At list price, monthly cash flow is $318 ($4k/yr) — positive.
- The deal already cash-flows at list — no discount required.
- Meets the 1% rule at list price ($3k rent vs $250k).
- Recommended offer: $246k (1.5% below list) — sets the bar for market timing.
- Cap rate 7.8% vs local median 5.1% in Beverly — top-decile yield for the area; either an underpriced asset or a hidden risk that comps aren't pricing in. Stress-test before assuming the spread holds.
Location & tenants
- Location reads 76/100 on livability (#130 in NJ, #3,487 nationally) — a middle-class / working-renter tenant base. Strengths: employment A+, housing A+, commute A; Watch: amenities F.
- Delran Township School District (suburban): math 22% / reading 49% proficiency, ranked #251 of 472 in NJ (top 53%) — families likely to look elsewhere, expect single-tenant / working-renter base with shorter leases; only 17% free/reduced lunch — higher-income household profile.
- Zoned schools: Millbridge Elementary School (653 students, 26% FRL); Delran Middle School (math 25% / reading 53%, grade F, #207 of 431 statewide, top 48%, 710 students, 24% FRL); Delran High School (math 23% / reading 57%, grade F, #187 of 399 statewide, top 48%, 912 students, 21% FRL).
- Market conditions: 133 active listings in the ZIP; 7 comparable units currently listed for rent nearby; rentals leasing fast (median 0d on market — plan ~1-2 weeks tenant-placement turnaround); solid renter incomes; 2,161 units permitted in Burlington County in 2024 (988 in 5+ unit buildings).
- This rent runs 33% of the median local income ($94k/yr) — at the standard rent-burdened threshold; future hikes will face affordability resistance.
Forward outlook
- Local home prices are declining (-3.0%/yr); year-one equity from $2k of loan paydown is wiped out by about $7k of value loss. Plan a longer hold.
- Burlington County population projected to shrink 5% by 2050 — rents likely to lag national; underwrite the cash flow, not the appreciation.
Negotiation context
- It's been on market 21 days — a 2% lower offer ($246k) is reasonable based on typical stale-listing flexibility.
- 5 sale attempts since 16y ago; this cycle's ask has dropped $15k (6%) from the opening price — seller is motivated, your offer sets the floor, not the list.
Risks & watch-outs
- Watch-outs: built in 1900 — expect roof / HVAC / electrical / plumbing capex.
- Climate carrying-cost: major wind risk, 36% chance of damaging wind over 30y; extreme-heat days projected 7→15/yr by 2055 (HVAC capex compounding) — expect insurance premiums to compound above CPI over the hold.
Questions for the listing agent
- Built in 1900 — when were the roof, HVAC, electrical panel, plumbing, and water heater last replaced?
- Is there a deadline driving the sale (1031 exchange, divorce, estate, relocation)? That informs how much negotiation room exists.
- What's the average days-on-market for RENTAL listings here right now (not sales)? A rising rental-DOM trend means longer vacancies and softer asking-rent achievability than the comps imply.
- What's the recent tenant-quality profile in this submarket — average credit score on applications, eviction rate, late-payment / NSF rate, and stable-employment percentage? A property-management company in the area should have these aggregated.
- How much new for-sale + rental construction is in the pipeline within 1–3 miles? Heavy new supply typically softens prices + rents 12–24 months out; constrained supply supports both.
Investment metrics
- 1% rule
- 1.05% ✓
- Cap rate
- 7.82%
- Cash-on-cash
- 5.45%
- DSCR
- 1.24
- GRM
- 7.9
CMA / ARV
- ARV (on-the-fly)
- $510,600
- Comps found
- 10
Show comp detail 10 sales within ~0.75 mi
| Address | Dist | Beds/Ba | Sqft | Sold | Price | $/sf | Match |
|---|---|---|---|---|---|---|---|
| 4 Tara Ln | 0.64mi | 3/2.0 | 1,874 (+1%) | 12mo | $535,000 | $285 | 54 |
| 10 Woodyfield Ln | 0.52mi | 3/2.5 | 1,714 (-7%) | 15mo | $489,500 | $286 | 45 |
| 64 Pancoast Blvd | 0.71mi | 3/1.5 | 1,632 (-12%) | 2mo | $530,000 | $325 | 44 |
| 86 Pancoast Blvd | 0.75mi | 4/2.0 (+1) | 1,820 (-2%) | 14mo | $450,000 | $247 | 41 |
| 12 Springcress Dr | 0.66mi | 3/2.5 | 2,006 (+8%) | 12mo | $553,000 | $276 | 39 |
| 24 Ashley Dr | 0.62mi | 3/2.0 | 1,736 (-6%) | 24mo | $389,900 | $225 | 37 |
| 8 Roslyn Dr | 0.59mi | 2/2.0 (-1) | 1,984 (+7%) | 23mo | $475,000 | $239 | 32 |
| 3 Marsha Dr | 0.73mi | 3/2.0 | 2,034 (+10%) | 17mo | $475,000 | $234 | 31 |
| 6 Providence Ct | 0.66mi | 4/3.5 (+1) | 1,985 (+7%) | 14mo | $575,000 | $290 | 31 |
| 206 James Ct | 0.59mi | 4/2.5 (+1) | 2,048 (+11%) | 20mo | $460,000 | $225 | 27 |
Match score weights: distance 35% · size 25% · config 20% · recency 20%. Top-matched comps best support the ARV.
Projected returns pro-forma
-3.0% appreciation · 3.0% rent growth · sell at horizon
- IRR
- -7.8%
- Equity multiple
- 0.71×
- Total profit
- $-20,204
- Equity at exit
- $37,261
- IRR
- 1.7%
- Equity multiple
- 1.12×
- Total profit
- $8,700
- Equity at exit
- $21,607
Cash invested: $69,972 (down + closing). Projections, not guarantees.
Landlord ↔ Tenant lean methodology
- Overall (STATE)
- 21 Tenant-Leaning
- State New Jersey
- 21 Tenant-Leaning · D+6
- County
- — inherits STATE
- City
- — inherits STATE
ZIP-level market 08075
- Active inventory
- 133
- Price-to-rent
- 7.9×
Monthly cashflow live
- Estimated rent
- $2,629 high interval (Pro) →
- Mortgage (P&I)
- −$1,311
- Tax from tax record
- −$344 /mo · $4,133/yr
- Insurance
- −$104
- HOA
- −$0
- Vacancy / Maint / Mgmt
- −$552
- Net cashflow
- $318
Break-even live
Sensitivity live
| Price | -10% $459 | -5% $388 | +0% $318 | +5% $247 | +10% $176 |
|---|---|---|---|---|---|
| Rent | -10% $110 | -5% $214 | +0% $318 | +5% $421 | +10% $525 |
| Rate | -1.0pp $444 | -0.5pp $381 | base $318 | +0.5pp $253 | +1.0pp $187 |
UW: 25.0% down · 7.5% · 30yr · 1.5% tax · 5.0% vac · 8.0% maint · 8.0% mgmt
Financing live
Cash to close
- Down payment
- $62,475
- Closing costs
- $7,497
- Reserves months
- —
- Total cash needed
- —
Loan-product check · same deal, 3 products live
Conventional
25% down · 7.5% · 30yr
- Down + closing
- —
- Monthly P&I
- —
- Monthly cashflow
- —
- DSCR
- —
- Eligible?
- —
Personal DTI + credit; lowest rate.
DSCR
20% down · 8.5% · 30yr
- Down + closing
- —
- Monthly P&I
- —
- Monthly cashflow
- —
- DSCR
- —
- Eligible?
- —
No personal income docs; deal must DSCR.
Hard money
10% down · 12.0% · 12mo
- Down + closing
- —
- Monthly P&I
- —
- Monthly cashflow
- —
- DSCR
- —
- Eligible?
- —
Short-term bridge; refi at stabilization.
Rent comps 7 comps
| Address | Beds | Baths | Sqft | Rent | $/sqft | DOM | Units | Dist |
|---|---|---|---|---|---|---|---|---|
| 135 Natalie Rd Riverside, NJ | 3.0 | 2.0 | 1257 | $2,360 | $1.88 | 6d | 1 | 0.50mi |
| 5 Larkspur Ct Delran, NJ | 3.0 | 2.5 | 1476 | $3,000 | $2.03 | 0d | 1 | 1.00mi |
| 1639 Perkins Ln Beverly, NJ | 4.0 | 2.5 | 1911 | $3,300 | $1.73 | 0d | 1 | 1.17mi |
| 2 Radnor Ct Willingboro, NJ | 3.0 | 1.5 | 1462 | $2,750 | $1.88 | 0d | 1 | 1.31mi |
| 16 Radnor Ct Willingboro, NJ | 2.0 | 1.5 | 1270 | $2,100 | $1.65 | 14d | 1 | 1.34mi |
| 128 Rockland Dr Willingboro, NJ | 3.0 | 1.5 | 1430 | $2,500 | $1.75 | 0d | 1 | 1.42mi |
| 40 Rittenhouse Dr Willingboro, NJ | 3.0 | 1.5 | 1430 | $2,600 | $1.82 | 0d | 1 | 1.47mi |
Listing history 15 events
-
2026-06-21days on market $249,900 Active 21 DOM
-
2026-06-18days on market $249,900 Active 18 DOM
-
2026-06-17days on market $249,900 Active 17 DOM
-
2026-06-16days on market $249,900 Active 16 DOM
-
2026-06-15days on market $249,900 Active 15 DOM
-
2026-06-13pricedays on market $249,900 Active 13 DOM
-
2026-06-13days on market $264,900 Active 12 DOM
-
2026-06-09days on market $264,900 Active 9 DOM
-
2026-06-08days on market $264,900 Active 8 DOM
-
2026-06-07days on market $264,900 Active 7 DOM
-
2026-06-04days on market $264,900 Active 4 DOM
-
2026-06-03days on market $264,900 Active 3 DOM
-
2026-06-02days on market $264,900 Active 2 DOM
-
2026-06-01remarks 699-char remark
-
2026-06-01$264,900 Active 1 DOM
ⓘ Source: listings_history table (triggers on properties + properties_extension) + one-shot
backfill from property_details.listing_events for pre-trigger history.
Tax reassessment forecast NJ · Partial reset (capped growth)
- Current annual tax
- $4,133 · $344/mo
- Projected year-2 tax
- $5,178 · $431/mo
- Expected delta
- +$1,045/yr (+$87/mo · 25.3%)
ⓘ Screening estimate from a state-policy table — verify with the county assessor before closing.
Climate risk First Street
- Flood 1/10 Low FEMA zone X (unshaded) · 0% chance over 30 yrs
- Wildfire 1/10 Low
- Heat 6/10 Major 7 d/yr ≥104°F today · 15 d/yr by 30 yrs out
- Wind 6/10 Major 36% chance of damaging wind over 30 yrs
- Air quality 4/10 Moderate 5 unhealthy d/yr today · 7 by 30 yrs out
Nearby sold comps map
Loading sold comps map…
Walkable amenities ~0.75 mi
Loading nearby amenities…
Taxation est. · year 1
- Rental income
- $31,545
- − Mortgage interest
- −$13,998
- − Property taxes
- −$4,133
- − Insurance
- −$1,250
- − Repairs & maintenance
- −$2,524
- − Management
- −$2,524
- − Depreciation
- −$7,270
- Taxable loss
- −$153
- Est. tax savings @ 24.0%
- +$37
- After-tax cash flow
- $3,849/yr
For passive investors: Depreciation is non-cash, so a rental often shows a tax loss while cash-flowing — sheltering income. Rental losses are passive: they offset passive income freely, and up to $25,000/yr can offset ordinary (W-2) income if you actively participate and your MAGI is under $100k (phasing out to $0 by $150k); unused losses carry forward. On sale, claimed depreciation is recaptured at up to 25%, and gains may owe capital-gains tax (a 1031 exchange can defer both). Figures are a year-1 estimate at your 24.0% rate — not tax advice; consult a CPA.
Schools (NCES district)
- District
- Delran Township School District
- NCES district ID
- 3403780
- Math proficiency
- 22% ▼ -16.00%
- Reading proficiency
- 49% ▼ -2.00%
- Median HH income
- $83,417
- Composite
- 33.85/100
- National rank
- #5354
- State rank
- #251 of 472 in NJ
Livability — Beverly
- Score
- 76/100
- State rank
- #130
- US rank
- #3487
Category grades
Schools grade is shown separately in the Schools card above.
Census & demographics
- County
- Burlington County · 323,710 people
- Metro
- Philadelphia-Camden-Wilmington, PA-NJ-DE-MD
- Population (ZIP)
- 30,615
- Household income
- $94,407
- Rent vs Own
- Severe rent burden
- 1103.0
Population outlook (Burlington County) Hauer SSP2
- Today (2025)
- 453,425 people
- By 2030
- 452,359 · -0.2%
- By 2040
- 445,033 · -1.9%
- By 2050
- 431,760 · -4.8%
- By 2075
- 406,277 · -10.4%
- By 2100
- 364,732 · -19.6%
Race, ethnicity, and origin ACS 2023
- Neighborhood character
- Predominantly White (70%)
- Race & ethnicity
- White 70% Black 10% Hispanic / Latino 9% Two or more races 9% Asian 3%
- Hispanic origin (detail)
- Puerto Rican 3%
- Common ancestry
- Romanian 8% Estonian 3% Russian 2%
- Foreign-born
- 13% · Canada, China
- Languages at home
- 82% English-only · Other Indo-European 8% Spanish 6% Other Asian/Pacific 2%
Political lean MEDSL · Burlington
- 2024 margin
- D (+16.6) · D 57.6% · R 41.0% · Other 1.3%
- 2008→2024 swing
- -2.0pp toward R · 2008: 18.6pp · 2024: 16.6pp
- All cycles
- 2024: D+16.6 2020: D+19.5 2016: D+14.8 2012: D+18.7 2008: D+18.6
Not yet ingested
- Civics
- —
Market trends
- HPI YoY
- ▼ -396.76%
- Current HPI
- 281.8091
- Rent YoY
- —
- Metro
- Philadelphia-Camden-Wilmington, PA-NJ-DE-MD
- State GDP YoY
- ▲ 2.05%
- F500 in state
- 34
Industry mix (Fortune 500 HQ in NJ)
| Industry | F500 HQs | Revenue |
|---|---|---|
| Consumer Goods | 3 | $31B |
|
||
| Pharmaceuticals | 2 | $153B |
|
||
| Technology | 2 | $21B |
|
||
| Insurance | 2 | $20B |
|
||
| Healthcare | 2 | $19B |
|
||
| Financial Services | 1 | $70B |
|
||
Price history
+164.9% since first listed13 events — show timeline
- 2026-05-31 Listed $264,900 BRIGHT MLS
- 2025-11-14 Pending — BRIGHT MLS
- 2025-11-14 Listing Removed — BRIGHT MLS
- 2025-10-16 Price Changed $215,000 BRIGHT MLS
- 2025-09-24 Price Changed $225,000 BRIGHT MLS
- 2025-09-05 Listed $250,000 BRIGHT MLS
- 2024-06-07 Pending — BRIGHT MLS
- 2024-06-07 Listing Removed — BRIGHT MLS
- 2024-04-10 Listed $275,000 BRIGHT MLS
- 2015-10-23 Listing Removed — BRIGHT MLS
- 2014-07-22 Listed $140,000 BRIGHT MLS
- 2010-12-31 Listing Removed — BRIGHT MLS
- 2010-04-07 Listed $100,000 BRIGHT MLS
Property tax history
+1.2%/yrLatest (2025): $4,133 · +0.7% YoY. Source: county tax records.
Cash-flow waterfall
monthlySold comps — $/sqft
last 12 mo · ≤1 miLoading sold comps…