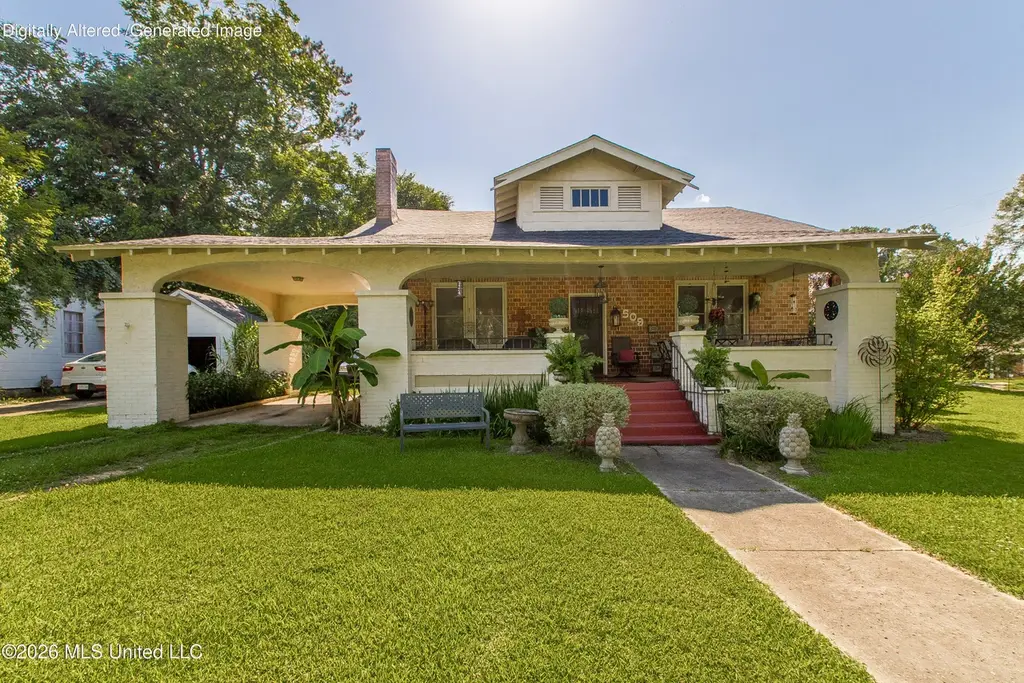
509 Jackson Ave · McComb, MS
Flood risk 1/10 · Minimal
- FEMA flood zone
- X (unshaded)
- Chance of flooding over 30 yrs
- 0.0%
- Est. flood insurance / yr
- $507 – $1,088
Fire risk 4/10 · Minor
- Est. fire insurance / yr
- $1,241 – $2,305
Heat risk 8/10 · Major
- Hot days now (above 109°F)
- 7 days/yr
- Hot days in 30 yrs
- 21 days/yr
Wind risk 8/10 · Major
- Chance of severe wind over 30 yrs
- 99.0%
Air-quality risk 1/10 · Minimal
- Unhealthy air days now
- 0 days/yr
- Unhealthy air days in 30 yrs
- 0 days/yr
Risk factors via First Street. Map © Google.
Why this score? — see what drove the C grade
The composite is a weighted blend of 9 inputs, each scored 0–100. Each bar is that input's sub-score; the figure is the points it added to the 100-point composite (weight × sub-score).
- Cash flow +23.5/30.0
- ARV discount +12.9/15.0
- DSCR +7.6/10.0
- 1% rule +5.7/10.0
- Livability +3.5/5.0
- Rent growth +2.5/5.0
- Condition / age +2.5/5.0
- Schools +1.2/10.0
- Appreciation +0.0/10.0
$135,000
🖨 Deal sheet 📄 Offer letter ✓ Due diligence
Listing remarks MLS
Nice spacious rooms that let you spread out! Take a took at this 3 possibly 4 bedroom, two retro bathroom house located inside McComb city limits.
Key facts
- Front porch
- Sunroom
- Updated kitchen
Tags
Property features AI
Finance
- HOA & community: Sidewalks; Street lights
Exterior
- Parking: Attached carport; Carport with storage; 1 carport space
- Utilities: Public water; Public sewer; Electricity connected; Natural gas connected; Cable available; Sewer connected; Water connected
- Home design: Single-family house; One level; Move-in ready
- Construction: Brick and plaster construction; Shingle roof; Pillar/post/pier foundation; Built (year source: assessor)
- Exterior features: Front porch; Side porch; Patio; Private yard; Fenced yard (wood); Landscaped; Sloped lot; City lot; Corner lot
Interior
- Kitchen: Built-in electric range; Built-in refrigerator
- Flooring: Wood floors
- Bathrooms: 2 full bathrooms
- Heating & cooling: Central heating (natural gas); Central air; Ceiling fans
- Interior features: Beamed ceilings; Ceiling fan(s); Crown molding; High ceilings; Soaking tub; Dead bolt lock(s); Blinds
- Laundry & utility: Laundry room with inside washer and dryer hookups; Electric dryer hookup; Washer hookup
Neighborhood map
What this means for you Summary
Snapshot
- This is a 3-bed/2.0-bath single-family listed at $135k.
Deal economics
- At list price, monthly cash flow is $252 ($3k/yr) — positive.
- The deal already cash-flows at list — no discount required.
- Meets the 1% rule at list price ($1k rent vs $135k).
- Cap rate 8.5% vs local median 6.5% in McComb — top-decile yield for the area; either an underpriced asset or a hidden risk that comps aren't pricing in. Stress-test before assuming the spread holds.
Location & tenants
- Location reads 69/100 on livability (#50 in MS) — a middle-class / working-renter tenant base. Strengths: cost of living A+, health & safety A+, housing A-; Watch: schools D-, amenities F, commute F.
- Mccomb School District (town): math 15% / reading 16% proficiency, ranked #106 of 130 in MS (top 82%) — low school quality limits family demand, transient renter base, plan for 1-2y turnover; 93% free/reduced lunch — lower-income household profile, screen leases tightly.
- Market conditions: 190 active listings in the ZIP; 2 comparable units currently listed for rent nearby; 10 units permitted in Pike County in 2024 (0 in 5+ unit buildings).
Forward outlook
- Local home prices are declining (-3.0%/yr); year-one equity from $933 of loan paydown is wiped out by about $4k of value loss. Plan a longer hold.
- Pike County population projected at -14% by 2050 — secular population decline; favor cash flow + early exit over multi-decade hold.
Negotiation context
- Only 4 days on market — expect competitive offers; lowballing is unlikely to land.
- 5 sale attempts since 17y ago with the ask held roughly flat each time — persistent listings suggest the price (not the market) is what's stuck; bring a comps-based counter.
Risks & watch-outs
- Watch-outs: built in 1922 — expect roof / HVAC / electrical / plumbing capex.
- Climate carrying-cost: severe wind risk, 99% chance of damaging wind over 30y; extreme-heat days projected 7→21/yr by 2055 (HVAC capex compounding) — expect insurance premiums to compound above CPI over the hold.
Questions for the listing agent
- Built in 1922 — when were the roof, HVAC, electrical panel, plumbing, and water heater last replaced?
- Is there a deadline driving the sale (1031 exchange, divorce, estate, relocation)? That informs how much negotiation room exists.
- Schools are D-rated, which usually means shorter tenancies and higher turnover. Who's the typical renter profile here, and what's been the actual vacancy rate?
- What's the average days-on-market for RENTAL listings here right now (not sales)? A rising rental-DOM trend means longer vacancies and softer asking-rent achievability than the comps imply.
- What's the recent tenant-quality profile in this submarket — average credit score on applications, eviction rate, late-payment / NSF rate, and stable-employment percentage? A property-management company in the area should have these aggregated.
- How much new for-sale + rental construction is in the pipeline within 1–3 miles? Heavy new supply typically softens prices + rents 12–24 months out; constrained supply supports both.
Investment metrics
- 1% rule
- 1.07% ✓
- Cap rate
- 8.53%
- Cash-on-cash
- 7.99%
- DSCR
- 1.36
- GRM
- 7.8
CMA / ARV
- ARV (on-the-fly)
- $153,384
- Comps found
- 12
Show comp detail 12 sales within ~0.75 mi
| Address | Dist | Beds/Ba | Sqft | Sold | Price | $/sf | Match |
|---|---|---|---|---|---|---|---|
| 402 High St | 0.03mi | 4/2.0 (+1) | 2,023 (+2%) | 8mo | $169,900 | $84 | 85 |
| 1212 Park St | 0.38mi | 4/2.0 (+1) | 1,945 (-2%) | 7mo | $162,900 | $84 | 67 |
| 128 Sinclair St | 0.68mi | 4/2.5 (+1) | 2,000 (+0%) | 0mo | $214,900 | $107 | 60 |
| 507 W Georgia Ave | 0.34mi | 3/2.0 | 2,264 (+14%) | 1mo | $55,000 | $24 | 60 |
| 1018 Park St | 0.31mi | 4/2.5 (+1) | 2,198 (+10%) | 3mo | $169,500 | $77 | 59 |
| 612 W New York Ave | 0.35mi | 3/2.0 | 1,708 (-14%) | 1mo | $54,600 | $32 | 59 |
| 623 Louisiana Ave | 0.70mi | 3/2.0 | 1,968 (-1%) | 13mo | $135,000 | $69 | 55 |
| 321 W New York Ave | 0.47mi | 2/2.0 (-1) | 1,840 (-8%) | 7mo | $38,000 | $21 | 54 |
| 408 New York Ave W | 0.42mi | 4/2.0 (+1) | 1,850 (-7%) | 12mo | $109,500 | $59 | 54 |
| 600 Lake | 0.58mi | 3/2.0 | 1,880 (-6%) | 14mo | $279,500 | $149 | 52 |
| 227 N James Ave | 0.31mi | 3/3.0 | 2,251 (+13%) | 11mo | $59,000 | $26 | 50 |
| 602 Maxine Ave | 0.61mi | 4/2.0 (+1) | 1,836 (-8%) | 13mo | $194,900 | $106 | 43 |
Match score weights: distance 35% · size 25% · config 20% · recency 20%. Top-matched comps best support the ARV.
Projected returns pro-forma
-3.0% appreciation · 3.0% rent growth · sell at horizon
- IRR
- -4.1%
- Equity multiple
- 0.85×
- Total profit
- $-5,856
- Equity at exit
- $20,129
- IRR
- 5.5%
- Equity multiple
- 1.41×
- Total profit
- $15,521
- Equity at exit
- $11,672
Cash invested: $37,800 (down + closing). Projections, not guarantees.
Landlord ↔ Tenant lean methodology
- Overall (STATE)
- 90 Strongly Landlord-Friendly
- State Mississippi
- 90 Strongly Landlord-Friendly · R+11
- County
- — inherits STATE
- City
- — inherits STATE
ZIP-level market 39648
- Active inventory
- 190
- Price-to-rent
- 7.8×
Monthly cashflow live
- Estimated rent
- $1,448 medium interval (Pro) →
- Mortgage (P&I)
- −$708
- Tax from tax record
- −$128 /mo · $1,538/yr
- Insurance
- −$56
- HOA
- −$0
- Vacancy / Maint / Mgmt
- −$304
- Net cashflow
- $252
Break-even live
UW: 25.0% down · 7.5% · 30yr · 1.5% tax · 5.0% vac · 8.0% maint · 8.0% mgmt
Financing live
Cash to close
- Down payment
- $33,750
- Closing costs
- $4,050
- Reserves months
- —
- Total cash needed
- —
Loan-product check · same deal, 3 products live
Conventional
25% down · 7.5% · 30yr
- Down + closing
- —
- Monthly P&I
- —
- Monthly cashflow
- —
- DSCR
- —
- Eligible?
- —
Personal DTI + credit; lowest rate.
DSCR
20% down · 8.5% · 30yr
- Down + closing
- —
- Monthly P&I
- —
- Monthly cashflow
- —
- DSCR
- —
- Eligible?
- —
No personal income docs; deal must DSCR.
Hard money
10% down · 12.0% · 12mo
- Down + closing
- —
- Monthly P&I
- —
- Monthly cashflow
- —
- DSCR
- —
- Eligible?
- —
Short-term bridge; refi at stabilization.
Rent comps 2 comps
| Address | Beds | Baths | Sqft | Rent | $/sqft | DOM | Units | Dist |
|---|---|---|---|---|---|---|---|---|
| 606 Lakeview Ave McComb, MS | 2.0 | 2.0 | 2312 | $1,500 | $0.65 | 43d | 1 | 0.52mi |
| 238 Westview Cir McComb, MS | 3.0 | 2.0 | 1574 | $1,300 | $0.83 | 43d | 1 | 1.35mi |
Listing history 5 events
-
2026-06-16status $135,000 Pending 4 DOM
-
2026-06-15days on market $135,000 Active 4 DOM
-
2026-06-13days on market $135,000 Active 2 DOM
-
2026-06-12remarks 699-char remark
-
2026-06-12$135,000 Active 1 DOM
ⓘ Source: listings_history table (triggers on properties + properties_extension) + one-shot
backfill from property_details.listing_events for pre-trigger history.
Tax reassessment forecast MS · Resets to sale price
- Current annual tax
- $1,538 · $128/mo
- Projected year-2 tax
- $1,538 · $128/mo
- Expected delta
- $0/yr ($0/mo · 0.0%)
ⓘ Screening estimate from a state-policy table — verify with the county assessor before closing.
Climate risk First Street
- Flood 1/10 Low FEMA zone X (unshaded) · 0% chance over 30 yrs
- Wildfire 4/10 Moderate
- Heat 8/10 Severe 7 d/yr ≥109°F today · 21 d/yr by 30 yrs out
- Wind 8/10 Severe 99% chance of damaging wind over 30 yrs
- Air quality 1/10 Low 0 unhealthy d/yr today · 0 by 30 yrs out
Nearby sold comps map
Loading sold comps map…
Walkable amenities ~0.75 mi
Loading nearby amenities…
Taxation est. · year 1
- Rental income
- $17,376
- − Mortgage interest
- −$7,562
- − Property taxes
- −$1,538
- − Insurance
- −$675
- − Repairs & maintenance
- −$1,390
- − Management
- −$1,390
- − Depreciation
- −$3,927
- Taxable income
- $894
- Est. tax owed @ 24.0%
- −$215
- After-tax cash flow
- $2,804/yr
For passive investors: Depreciation is non-cash, so a rental often shows a tax loss while cash-flowing — sheltering income. Rental losses are passive: they offset passive income freely, and up to $25,000/yr can offset ordinary (W-2) income if you actively participate and your MAGI is under $100k (phasing out to $0 by $150k); unused losses carry forward. On sale, claimed depreciation is recaptured at up to 25%, and gains may owe capital-gains tax (a 1031 exchange can defer both). Figures are a year-1 estimate at your 24.0% rate — not tax advice; consult a CPA.
Schools (NCES district)
- District
- Mccomb School District
- NCES district ID
- 2802880
- Math proficiency
- 15% ▼ -20.00%
- Reading proficiency
- 16% ▼ -5.00%
- Median HH income
- $29,855
- Composite
- 12.26/100
- National rank
- #9645
- State rank
- #106 of 130 in MS
Livability — McComb
- Score
- 69/100
- State rank
- #50
- US rank
- #8347
Category grades
Schools grade is shown separately in the Schools card above.
Census & demographics
- Census place
- McComb, MS
- Population (ZIP)
- 19,767
Population outlook (Pike County) Hauer SSP2
- Today (2025)
- 38,766 people
- By 2030
- 37,874 · -2.3%
- By 2040
- 35,743 · -7.8%
- By 2050
- 33,276 · -14.2%
- By 2075
- 26,799 · -30.9%
- By 2100
- 18,562 · -52.1%
Race, ethnicity, and origin ACS 2023
- Neighborhood character
- Majority Black (64%)
- Race & ethnicity
- Black 64% White 32% Two or more races 2% Hispanic / Latino 2%
- Common ancestry
- Slovak 2% Lithuanian 1% Italian 1%
- Foreign-born
- 1%
- Languages at home
- 98% English-only · Spanish 1%
Political lean MEDSL · Pike
- 2024 margin
- Toss-up / Even · D 47.8% · R 51.3%
- 2008→2024 swing
- -7.0pp toward R · 2008: 3.5pp · 2024: -3.5pp
- All cycles
- 2024: R+3.5 2020: D+1.0 2016: R+0.7 2012: D+7.6 2008: D+3.5
Not yet ingested
- Civics
- —
Market trends
- HPI YoY
- ▼ -88.61%
- Current HPI
- 92.2495
- Rent YoY
- —
- Metro
- —
- State GDP YoY
- —
- F500 in state
- 0
Price history
+59.0% since first listed11 events — show timeline
- 2026-06-11 Listed $135,000 MLSU
- 2026-03-25 Listing Removed — MLSU
- 2026-02-23 Relisted — MLSU
- 2026-01-13 Contingent — MLSU
- 2026-01-06 Price Changed $159,000 MLSU
- 2025-11-11 Price Changed $169,000 MLSU
- 2025-09-25 Listed $177,000 MLSU
- 2017-03-03 Sold (MLS) — MLSU
- 2016-05-27 Listed $65,000 MLSU
- 2009-07-24 Sold (MLS) — MLSU
- 2009-04-30 Listed $84,900 MLSU
Property tax history
+2.1%/yrLatest (2017): $1,538 · +0.8% YoY. Source: county tax records.
Cash-flow waterfall
monthlySold comps — $/sqft
last 12 mo · ≤1 miLoading sold comps…