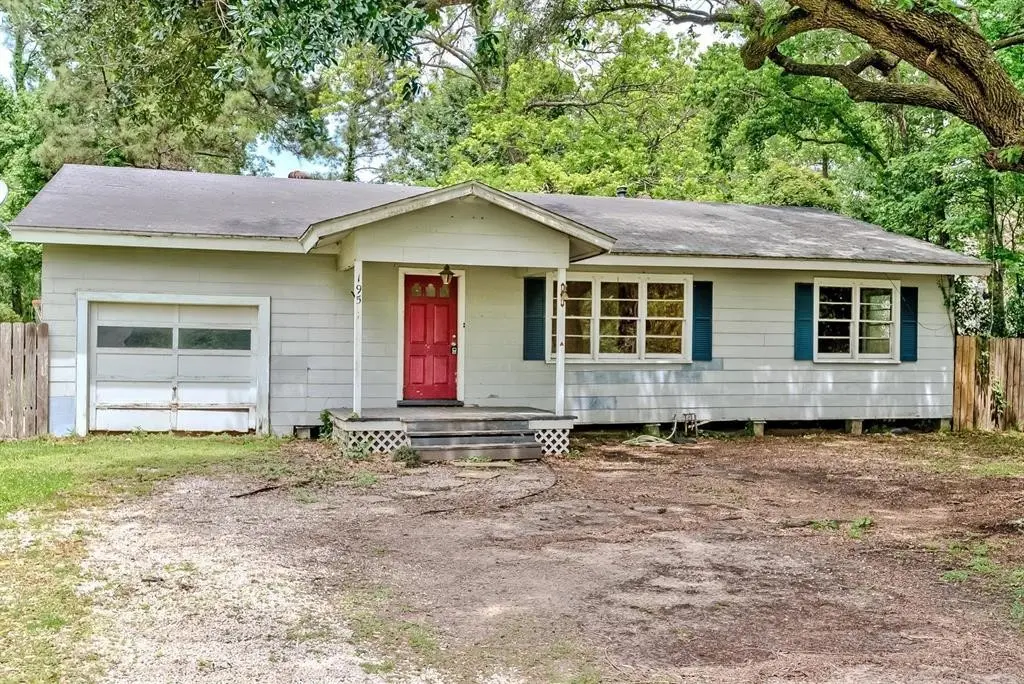
195 E Chance Rd · Lumberton, TX
Flood risk 1/10 · Minimal
- FEMA flood zone
- X (unshaded)
- Chance of flooding over 30 yrs
- 0.0%
- Est. flood insurance / yr
- $507 – $1,088
Fire risk 4/10 · Minor
- Est. fire insurance / yr
- $1,222 – $2,270
Heat risk 9/10 · Severe
- Hot days now (above 111°F)
- 7 days/yr
- Hot days in 30 yrs
- 23 days/yr
Wind risk 9/10 · Severe
- Chance of severe wind over 30 yrs
- 99.0%
Air-quality risk 2/10 · Minimal
- Unhealthy air days now
- 1 days/yr
- Unhealthy air days in 30 yrs
- 1 days/yr
Risk factors via First Street. Map © Google.
Why this score? — see what drove the B grade
The composite is a weighted blend of 9 inputs, each scored 0–100. Each bar is that input's sub-score; the figure is the points it added to the 100-point composite (weight × sub-score).
- Cash flow +30.0/30.0
- 1% rule +10.0/10.0
- DSCR +10.0/10.0
- ARV discount +7.5/15.0
- Schools +4.3/10.0
- Livability +3.8/5.0
- Rent growth +2.5/5.0
- Condition / age +2.5/5.0
- Appreciation +0.0/10.0
$97,000
🖨 Deal sheet 📄 Offer letter ✓ Due diligence
Listing remarks MLS
Opportunity awaits at 195 East Chance! Situated on approximately 0.49 of an acre and serviced by city utilities, this spacious 3-bedroom, 2-bath home offers great potential for investors or buyers. The property features a large open kitchen, generous living space, and a 1-car attached garage. Located in the desirable Lumberton School District, this home is a true fixer-upper and is being sold for cash only, as it will not meet financing requirements. Property is being sold as-is; seller will not make any repairs. Shown by appointment.
Key facts
- True fixer-upper
- Large open kitchen
- 0.49 acre lot
Tags
Property features AI
Exterior
- Parking: Attached garage (1 car)
- Security: Smoke detector(s)
- Utilities: Public water; Public sewer
- Home design: Residential property; Built in 1963; Pillar/post/pier foundation
- Construction: Composition roof
- Exterior features: Fenced yard with backyard fencing; Cleared lot
Interior
- Bedrooms: Primary bedroom on the first floor; Additional bedrooms on the first floor (total 3 bedrooms)
- Flooring: Vinyl
- Bathrooms: 2 full bathrooms, including a primary bathroom on the first floor
- Heating & cooling: Central heating (gas); Central electric air conditioning
- Interior features: Ceiling fan(s); Ventilation for improved indoor air quality
- Laundry & utility: Washer hookup
Neighborhood map
What this means for you Summary
Snapshot
- This is a 3-bed/2.0-bath single-family listed at $97k.
Deal economics
- At list price, monthly cash flow is $677 ($8k/yr) — positive.
- The deal already cash-flows at list — no discount required.
- Meets the 1% rule at list price ($2k rent vs $97k).
- Recommended offer: $94k (3.0% below list) — sets the bar for market timing.
- Cap rate 14.7% vs local median 3.2% in Lumberton — top-decile yield for the area; either an underpriced asset or a hidden risk that comps aren't pricing in. Stress-test before assuming the spread holds.
Location & tenants
- Location reads 75/100 on livability (#160 in TX, #4,326 nationally) — a middle-class / working-renter tenant base. Strengths: crime A+, employment A+, cost of living A+; Watch: amenities F, commute F.
- Lumberton ISD (suburban): math 48% / reading 50% proficiency, ranked #173 of 826 in TX (top 21%) — families likely to look elsewhere, expect single-tenant / working-renter base with shorter leases.
- Zoned schools: Lumberton Pri (math 54% / reading 58%, grade C+, #574 of 4,322 statewide, top 14%, 982 students, 43% FRL); Lumberton Middle (math 47% / reading 51%, grade C-, #378 of 1,662 statewide, top 23%, 969 students, 35% FRL); Lumberton H S (math 55% / reading 61%, grade C, #320 of 1,632 statewide, top 20%, 1,229 students, 30% FRL).
- Market conditions: 318 active listings in the ZIP; 7 comparable units currently listed for rent nearby; rentals at typical pace (median 23d on market — plan ~3-4 weeks tenant-placement turnaround); 43% of comp listings sitting > 30 days — soft ceiling on asking rent; solid renter incomes; 358 units permitted in Hardin County in 2024 (0 in 5+ unit buildings).
Forward outlook
- Local home prices are declining (-3.0%/yr); year-one equity from $671 of loan paydown is wiped out by about $3k of value loss. Plan a longer hold.
- At projected returns (-3.0% appreciation + 3.0% rent growth), your $27k cash investment doubles in ~5 years — after that, you're playing with house money.
Negotiation context
- It's been on market 48 days — a 3% lower offer ($94k) is reasonable based on typical stale-listing flexibility.
- 2 sale attempts; this cycle's ask has dropped $28k (22%) from the opening price — seller is motivated, your offer sets the floor, not the list.
- Current owner paid $59k; list at $97k implies a 64% gain — meaningful room to come down on a strong offer.
Risks & watch-outs
- Climate carrying-cost: severe wind risk, 99% chance of damaging wind over 30y; extreme-heat days projected 7→23/yr by 2055 (HVAC capex compounding) — expect insurance premiums to compound above CPI over the hold.
Questions for the listing agent
- It's been on market 48 days. Have you received any prior offers? Is the seller open to a 3% concession, seller financing, or rate buy-down credit?
- Built in 1963 — when were the roof, HVAC, electrical panel, plumbing, and water heater last replaced?
- Is there a deadline driving the sale (1031 exchange, divorce, estate, relocation)? That informs how much negotiation room exists.
- What's the average days-on-market for RENTAL listings here right now (not sales)? A rising rental-DOM trend means longer vacancies and softer asking-rent achievability than the comps imply.
- What's the recent tenant-quality profile in this submarket — average credit score on applications, eviction rate, late-payment / NSF rate, and stable-employment percentage? A property-management company in the area should have these aggregated.
- How much new for-sale + rental construction is in the pipeline within 1–3 miles? Heavy new supply typically softens prices + rents 12–24 months out; constrained supply supports both.
Investment metrics
- 1% rule
- 1.83% ✓
- Cap rate
- 14.67%
- Cash-on-cash
- 29.92%
- DSCR
- 2.33
- GRM
- 4.6
CMA / ARV
- ARV (median comp)
- $235,454
- List price
- $97,000
- Delta
- -58.80%
- Verdict
- UNDERPRICED
- Comps
- 8 within 1.0 mi
Show comp detail 4 sales within ~0.75 mi
| Address | Dist | Beds/Ba | Sqft | Sold | Price | $/sf | Match |
|---|---|---|---|---|---|---|---|
| 541 N Village Creek Pkwy | 0.28mi | 3/2.5 | 1,450 (+4%) | 10mo | $230,000 | $159 | 71 |
| 106 Cherry Dr | 0.18mi | 4/2.0 (+1) | 1,600 (+14%) | 2mo | $259,000 | $162 | 61 |
| 106 Greenleaf Dr | 0.68mi | 3/2.0 | 1,400 (0%) | 16mo | $226,800 | $162 | 55 |
| 115 Rustic Ln | 0.49mi | 3/2.0 | 1,253 (-10%) | 8mo | $249,900 | $199 | 53 |
Match score weights: distance 35% · size 25% · config 20% · recency 20%. Top-matched comps best support the ARV.
Projected returns pro-forma
-3.0% appreciation · 3.0% rent growth · sell at horizon
- IRR
- 24.5%
- Equity multiple
- 2.01×
- Total profit
- $27,475
- Equity at exit
- $14,463
- IRR
- 32.4%
- Equity multiple
- 3.93×
- Total profit
- $79,705
- Equity at exit
- $8,387
Cash invested: $27,160 (down + closing). Projections, not guarantees.
Landlord ↔ Tenant lean methodology
- Overall (STATE)
- 87 Strongly Landlord-Friendly
- State Texas
- 87 Strongly Landlord-Friendly · R+5
- County
- — inherits STATE
- City
- — inherits STATE
ZIP-level market 77657
- Active inventory
- 318
- Price-to-rent
- 4.6×
Monthly cashflow live
- Estimated rent
- $1,771 high interval (Pro) →
- Mortgage (P&I)
- −$509
- Tax from tax record
- −$173 /mo · $2,075/yr
- Insurance
- −$40
- HOA
- −$0
- Vacancy / Maint / Mgmt
- −$372
- Net cashflow
- $677
Break-even live
UW: 25.0% down · 7.5% · 30yr · 1.5% tax · 5.0% vac · 8.0% maint · 8.0% mgmt
Financing live
Cash to close
- Down payment
- $24,250
- Closing costs
- $2,910
- Reserves months
- —
- Total cash needed
- —
Loan-product check · same deal, 3 products live
Conventional
25% down · 7.5% · 30yr
- Down + closing
- —
- Monthly P&I
- —
- Monthly cashflow
- —
- DSCR
- —
- Eligible?
- —
Personal DTI + credit; lowest rate.
DSCR
20% down · 8.5% · 30yr
- Down + closing
- —
- Monthly P&I
- —
- Monthly cashflow
- —
- DSCR
- —
- Eligible?
- —
No personal income docs; deal must DSCR.
Hard money
10% down · 12.0% · 12mo
- Down + closing
- —
- Monthly P&I
- —
- Monthly cashflow
- —
- DSCR
- —
- Eligible?
- —
Short-term bridge; refi at stabilization.
Rent comps 7 comps
| Address | Beds | Baths | Sqft | Rent | $/sqft | DOM | Units | Dist |
|---|---|---|---|---|---|---|---|---|
| 527 Old Silsbee Rd Unit 1A Lumberton, TX | 2.0 | 1.5 | 1050 | $1,250 | $1.19 | 43d | 1 | 0.34mi |
| 527 Old Silsbee Rd Unit 3C Lumberton, TX | 2.0 | 1.5 | 1100 | $1,250 | $1.14 | 13d | 1 | 0.34mi |
| 200 Raider Ln Lumberton, TX | 3.0 | 2.0 | 1216 | $1,395 | $1.15 | 23d | 1 | 0.89mi |
| 40 Candlelight Ln Lumberton, TX | 3.0 | 2.0 | 1626 | $2,000 | $1.23 | 43d | 1 | 0.89mi |
| 40 Candlelight Ln Lumberton, TX | 3.0 | 2.0 | 1626 | $2,000 | $1.23 | 23d | 1 | 0.89mi |
| 357 S Main St Lumberton, TX | 3.0 | 2.0 | 1216 | $895 | $0.74 | 43d | 1 | 1.08mi |
| 65 Jordan Dr Lumberton, TX | 4.0 | 2.0 | 1352 | $1,995 | $1.48 | 13d | 1 | 1.39mi |
Listing history 18 events
-
2026-06-15status $97,000 Pending 48 DOM
-
2026-06-15days on market $97,000 Active 48 DOM
-
2026-06-14days on market $97,000 Active 46 DOM
-
2026-06-10days on market $97,000 Active 43 DOM
-
2026-06-09days on market $97,000 Active 42 DOM
-
2026-06-08days on market $97,000 Active 41 DOM
-
2026-06-07pricedays on market $97,000 Active 40 DOM
-
2026-06-05days on market $109,000 Active 37 DOM
-
2026-06-03days on market $109,000 Active 36 DOM
-
2026-06-02days on market $109,000 Active 35 DOM
-
2026-06-01days on market $109,000 Active 34 DOM
-
2026-05-31days on market $109,000 Active 33 DOM
-
2026-05-30days on market $109,000 Active 32 DOM
-
2026-05-14price $109,000 540-char remark
Show marketing remark (540 chars)
Opportunity awaits at 195 East Chance! Situated on approximately 0.49 of an acre and serviced by city utilities, this spacious 3-bedroom, 2-bath home offers great potential for investors or buyers. The property features a large open kitchen, generous living space, and a 1-car attached garage. Located in the desirable Lumberton School District, this home is a true fixer-upper and is being sold for cash only, as it will not meet financing requirements. Property is being sold as-is; seller will not make any repairs. Shown by appointment.
-
2026-05-14price $109,000 462-char remark
Show marketing remark (540 chars)
Opportunity awaits at 195 East Chance! Situated on approximately 0.49 of an acre and serviced by city utilities, this spacious 3-bedroom, 2-bath home offers great potential for investors or buyers. The property features a large open kitchen, generous living space, and a 1-car attached garage. Located in the desirable Lumberton School District, this home is a true fixer-upper and is being sold for cash only, as it will not meet financing requirements. Property is being sold as-is; seller will not make any repairs. Shown by appointment.
-
2026-04-28$125,000 Active 462-char remark
-
2026-04-27$125,000 Active 540-char remark
Show marketing remark (540 chars)
Opportunity awaits at 195 East Chance! Situated on approximately 0.49 of an acre and serviced by city utilities, this spacious 3-bedroom, 2-bath home offers great potential for investors or buyers. The property features a large open kitchen, generous living space, and a 1-car attached garage. Located in the desirable Lumberton School District, this home is a true fixer-upper and is being sold for cash only, as it will not meet financing requirements. Property is being sold as-is; seller will not make any repairs. Shown by appointment.
-
1999-05-26soldstatus $59,200
ⓘ Source: listings_history table (triggers on properties + properties_extension) + one-shot
backfill from property_details.listing_events for pre-trigger history.
Tax reassessment forecast TX · Resets to sale price
- Current annual tax
- $2,075 · $173/mo
- Projected year-2 tax
- $2,075 · $173/mo
- Expected delta
- $0/yr ($0/mo · 0.0%)
ⓘ Screening estimate from a state-policy table — verify with the county assessor before closing.
Climate risk First Street
- Flood 1/10 Low FEMA zone X (unshaded) · 0% chance over 30 yrs
- Wildfire 4/10 Moderate
- Heat 9/10 Extreme 7 d/yr ≥111°F today · 23 d/yr by 30 yrs out
- Wind 9/10 Extreme 99% chance of damaging wind over 30 yrs
- Air quality 2/10 Low 1 unhealthy d/yr today · 1 by 30 yrs out
Nearby sold comps map
Loading sold comps map…
Walkable amenities ~0.75 mi
Loading nearby amenities…
Taxation est. · year 1
- Rental income
- $21,255
- − Mortgage interest
- −$5,434
- − Property taxes
- −$2,075
- − Insurance
- −$485
- − Repairs & maintenance
- −$1,700
- − Management
- −$1,700
- − Depreciation
- −$2,822
- Taxable income
- $7,039
- Est. tax owed @ 24.0%
- −$1,689
- After-tax cash flow
- $6,438/yr
For passive investors: Depreciation is non-cash, so a rental often shows a tax loss while cash-flowing — sheltering income. Rental losses are passive: they offset passive income freely, and up to $25,000/yr can offset ordinary (W-2) income if you actively participate and your MAGI is under $100k (phasing out to $0 by $150k); unused losses carry forward. On sale, claimed depreciation is recaptured at up to 25%, and gains may owe capital-gains tax (a 1031 exchange can defer both). Figures are a year-1 estimate at your 24.0% rate — not tax advice; consult a CPA.
Schools (NCES district)
- District
- Lumberton ISD
- NCES district ID
- 4813530
- Math proficiency
- 48% ▼ -5.00%
- Reading proficiency
- 50% ▼ -4.00%
- Median HH income
- $62,996
- Composite
- 43.2/100
- National rank
- #3063
- State rank
- #173 of 826 in TX
Livability — Lumberton
- Score
- 75/100
- State rank
- #160
- US rank
- #4326
Category grades
Schools grade is shown separately in the Schools card above.
Census & demographics
- Census place
- Lumberton, TX
- County
- Hardin County · 39,783 people
- City population
- 22,258
- Metro
- Beaumont-Port Arthur, TX
- Population (ZIP)
- 22,258
- Household income
- $95,718
- Rent vs Own
- Severe rent burden
- 147.0
Population outlook (Hardin County) Hauer SSP2
- Today (2025)
- 57,780 people
- By 2030
- 58,296 · +0.9%
- By 2040
- 58,421 · +1.1%
- By 2050
- 57,391 · -0.7%
- By 2075
- 53,132 · -8.0%
- By 2100
- 44,905 · -22.3%
Race, ethnicity, and origin ACS 2023
- Neighborhood character
- Predominantly White (89%)
- Race & ethnicity
- White 89% Hispanic / Latino 5% Two or more races 5%
- Hispanic origin (detail)
- Mexican 4%
- Common ancestry
- Lithuanian 10% Serbian 3% Slovak 2%
- Foreign-born
- 2% · Canada
- Languages at home
- 97% English-only · Spanish 2%
Political lean MEDSL · Hardin
- 2024 margin
- Solid R (+75.8) · D 11.9% · R 87.7%
- 2008→2024 swing
- -14.6pp toward R · 2008: -61.2pp · 2024: -75.8pp
- All cycles
- 2024: R+75.8 2020: R+73.8 2016: R+73.9 2012: R+67.6 2008: R+61.2
Not yet ingested
- Civics
- —
Market trends
- HPI YoY
- ▼ -160.56%
- Current HPI
- 156.2265
- Rent YoY
- —
- Metro
- Beaumont-Port Arthur, TX
- State GDP YoY
- ▲ 3.95%
- F500 in state
- 110
Industry mix (Fortune 500 HQ in TX)
| Industry | F500 HQs | Revenue |
|---|---|---|
| Energy | 16 | $1,198B |
|
||
| Technology | 5 | $198B |
|
||
| Engineering / Construction | 4 | $72B |
|
||
| Energy Services | 3 | $60B |
|
||
| Utilities | 3 | $41B |
|
||
| Healthcare | 2 | $330B |
|
||
Price history
+63.9% since first listed9 events — show timeline
- 2026-06-18 Pending — BBOR
- 2026-06-15 Pending — HARMLS
- 2026-06-06 Price Changed $97,000 BBOR
- 2026-06-06 Price Changed $97,000 HARMLS
- 2026-05-14 Price Changed $109,000 BBOR
- 2026-05-14 Price Changed $109,000 HARMLS
- 2026-04-28 Listed $125,000 HARMLS
- 2026-04-27 Listed $125,000 BBOR
- 1999-05-26 Sold (Public Records) $59,200 Public Records
Property tax history
+3.1%/yrLatest (2025): $2,075 · +9.5% YoY. Source: county tax records.
Cash-flow waterfall
monthlySold comps — $/sqft
last 12 mo · ≤1 miLoading sold comps…