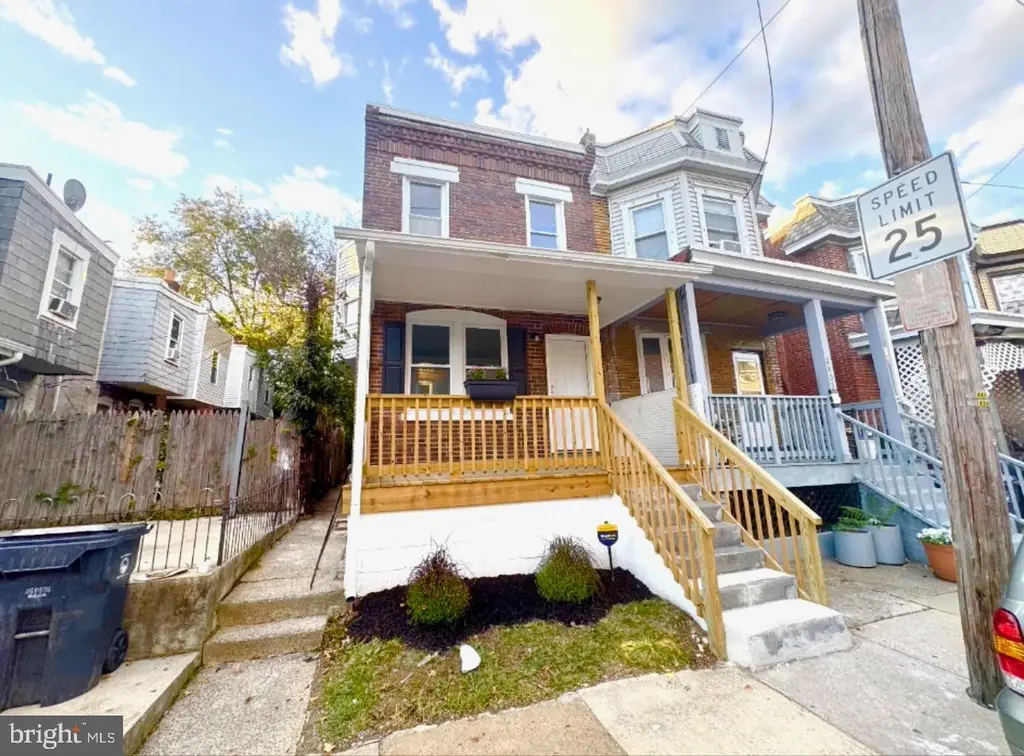
2401 Carter St · Wilmington, DE
Flood risk 1/10 · Minimal
- FEMA flood zone
- X (unshaded)
- Chance of flooding over 30 yrs
- 0.0%
- Est. flood insurance / yr
- $473 – $860
Fire risk 1/10 · Minimal
- Est. fire insurance / yr
- $476 – $884
Heat risk 8/10 · Major
- Hot days now (above 103°F)
- 7 days/yr
- Hot days in 30 yrs
- 16 days/yr
Wind risk 6/10 · Moderate
- Chance of severe wind over 30 yrs
- 27.0%
Air-quality risk 3/10 · Minor
- Unhealthy air days now
- 2 days/yr
- Unhealthy air days in 30 yrs
- 3 days/yr
Risk factors via First Street. Map © Google.
Why this score? — see what drove the C- grade
The composite is a weighted blend of 9 inputs, each scored 0–100. Each bar is that input's sub-score; the figure is the points it added to the 100-point composite (weight × sub-score).
- Cash flow +25.3/30.0
- DSCR +8.3/10.0
- 1% rule +5.5/10.0
- Rent growth +3.9/5.0
- Livability +3.2/5.0
- Schools +3.1/10.0
- Condition / age +2.5/5.0
- ARV discount +0.0/15.0
- Appreciation +0.0/10.0
$169,900
🖨 Deal sheet 📄 Offer letter ✓ Due diligence
Listing remarks MLS
Come see this newly renovated home within the city limits. This home is like buying brand new construction. Brand new roof, electric, plumbing, flooring, windows and HVAC. There are 3 nice size bedrooms and a powder room on the main floor. The upstairs bathroom has been eloquently updated with stylish tiling. All light fixtures are also brand new. The full basement can easily be finished off or it can be used as a huge storage area. The fenced in backyard can be setup as a nice oasis for BBQ's and outside entertainment. This property would be great for a first time home buyer. Located on a quiet street just minutes from public transportation and I-95. Make your appointment today. * * * This property is part of the Wilmington Neighborhood Conservancy Land Bank. Owner occupancy requirements of 5 years is required. This agreement can be transferred if buyer sells before 5 years to new owner-occupied owners.
Key facts
- Brand new plumbing
- Brand new roof
- Brand new flooring
Tags
Neighborhood map
What this means for you Summary
Snapshot
- This is a 3-bed/1.0-bath townhouse listed at $170k.
Deal economics
- At list price, monthly cash flow is $386 ($5k/yr) — positive.
- The deal already cash-flows at list — no discount required.
- Meets the 1% rule at list price ($2k rent vs $170k).
- Recommended offer: $160k (6.0% below list) — sets the bar for market timing.
- Cap rate 9.0% vs local median 5.6% in Wilmington — top-decile yield for the area; either an underpriced asset or a hidden risk that comps aren't pricing in. Stress-test before assuming the spread holds.
Location & tenants
- Location reads 64/100 on livability (#52 in DE) — a middle-class / working-renter tenant base. Strengths: cost of living A+, housing A; Watch: employment D+, schools D, commute D.
- Brandywine School District (suburban): math 28% / reading 40% proficiency, ranked #11 of 26 in DE (top 42%) — families likely to look elsewhere, expect single-tenant / working-renter base with shorter leases.
- Market conditions: Rents rising fast (+5.7%/yr); 119 active listings in the ZIP; 40 comparable units currently listed for rent nearby; rentals at typical pace (median 24d on market — plan ~3-4 weeks tenant-placement turnaround); 1,367 units permitted in New Castle County in 2024 (201 in 5+ unit buildings).
- This rent runs 40% of the median local income ($54k/yr) — at the standard rent-burdened threshold; future hikes will face affordability resistance.
Forward outlook
- Local home prices are declining (-3.0%/yr); year-one equity from $1k of loan paydown is wiped out by about $5k of value loss. Plan a longer hold.
- New Castle County population projected at +9% by 2050 — modest demand growth; plan on rents tracking national, not racing it.
- At projected returns (-3.0% appreciation + 5.7% rent growth), your $48k cash investment doubles in ~9 years — after that, you're playing with house money.
Negotiation context
- It's been on market 78 days — a 6% lower offer ($160k) is reasonable based on typical stale-listing flexibility.
- 8 sale attempts since 19y ago with the ask held roughly flat each time — persistent listings suggest the price (not the market) is what's stuck; bring a comps-based counter.
- Current owner paid $6k; list at $170k implies a 2514% gain — meaningful room to come down on a strong offer.
Risks & watch-outs
- Watch-outs: built in 1915 — expect roof / HVAC / electrical / plumbing capex.
- Climate carrying-cost: major wind risk, 27% chance of damaging wind over 30y; extreme-heat days projected 7→16/yr by 2055 (HVAC capex compounding) — expect insurance premiums to compound above CPI over the hold.
Questions for the listing agent
- It's been on market 78 days. Have you received any prior offers? Is the seller open to a 6% concession, seller financing, or rate buy-down credit?
- Built in 1915 — when were the roof, HVAC, electrical panel, plumbing, and water heater last replaced?
- Why hasn't it sold? Are there any deal-killer items the seller is aware of (foundation, flood, title, zoning, code violations)?
- Is there a deadline driving the sale (1031 exchange, divorce, estate, relocation)? That informs how much negotiation room exists.
- Schools are D-rated, which usually means shorter tenancies and higher turnover. Who's the typical renter profile here, and what's been the actual vacancy rate?
- Crime grade is F in this area — have there been break-ins, vandalism, or insurance claims at this property in the last 3 years? What carrier currently insures it and at what premium?
- What's the average days-on-market for RENTAL listings here right now (not sales)? A rising rental-DOM trend means longer vacancies and softer asking-rent achievability than the comps imply.
- What's the recent tenant-quality profile in this submarket — average credit score on applications, eviction rate, late-payment / NSF rate, and stable-employment percentage? A property-management company in the area should have these aggregated.
- How much new for-sale + rental construction is in the pipeline within 1–3 miles? Heavy new supply typically softens prices + rents 12–24 months out; constrained supply supports both.
Investment metrics
- 1% rule
- 1.05% ✓
- Cap rate
- 9.02%
- Cash-on-cash
- 9.73%
- DSCR
- 1.43
- GRM
- 8.0
CMA / ARV
- ARV (median comp)
- $124,044
- List price
- $169,900
- Delta
- 36.97%
- Verdict
- OVERPRICED
- Comps
- 20 within 1.0 mi
Show comp detail 12 sales within ~0.75 mi
| Address | Dist | Beds/Ba | Sqft | Sold | Price | $/sf | Match |
|---|---|---|---|---|---|---|---|
| 2717 N West St | 0.30mi | 3/1.0 | 1,150 (+2%) | 2mo | $155,000 | $135 | 81 |
| 2412 Lamotte St | 0.02mi | 3/1.0 | 1,275 (+13%) | 0mo | $125,000 | $98 | 76 |
| 2708 Thompson Pl | 0.38mi | 3/1.0 | 1,175 (+4%) | 1mo | $215,000 | $183 | 74 |
| 212 W 25th St | 0.27mi | 3/1.0 | 1,225 (+9%) | 1mo | $80,000 | $65 | 72 |
| 3003 N Tatnall St | 0.38mi | 2/1.0 (-1) | 1,050 (-7%) | 1mo | $165,000 | $157 | 66 |
| 103 W 29th St | 0.30mi | 3/1.5 | 1,250 (+11%) | 2mo | $150,000 | $120 | 64 |
| 417 E 35th St | 0.68mi | 3/1.0 | 1,150 (+2%) | 2mo | $227,000 | $197 | 63 |
| 206 W 26th St | 0.27mi | 3/2.0 | 1,250 (+11%) | 2mo | $228,000 | $182 | 63 |
| 3208 N Madison St | 0.63mi | 3/1.0 | 1,200 (+7%) | 2mo | $274,999 | $229 | 58 |
| 1029 Clifford Brown Walk | 0.70mi | 4/1.5 (+1) | 1,175 (+4%) | 2mo | $30,000 | $26 | 52 |
| 623 W Twenty Eighth St | 0.63mi | 3/1.5 | 1,250 (+11%) | 0mo | $235,000 | $188 | 50 |
| 1212 N Tatnall St | 0.73mi | 3/1.0 | 1,275 (+13%) | 0mo | $165,000 | $129 | 43 |
Match score weights: distance 35% · size 25% · config 20% · recency 20%. Top-matched comps best support the ARV.
Projected returns pro-forma
-3.0% appreciation · 5.72% rent growth · sell at horizon
- IRR
- 1.0%
- Equity multiple
- 1.04×
- Total profit
- $1,952
- Equity at exit
- $25,333
- IRR
- 13.0%
- Equity multiple
- 2.15×
- Total profit
- $54,712
- Equity at exit
- $14,690
Cash invested: $47,572 (down + closing). Projections, not guarantees.
Landlord ↔ Tenant lean methodology
- Overall (STATE)
- 70 Landlord-Friendly
- State Delaware
- 70 Landlord-Friendly · D+7
- County
- — inherits STATE
- City
- — inherits STATE
ZIP-level market 19802
- Rents YoY
- 5.7%
- Active inventory
- 119
- Price-to-rent
- 8.0×
Monthly cashflow live
- Estimated rent
- $1,777 high interval (Pro) →
- Mortgage (P&I)
- −$891
- Tax from tax record
- −$56 /mo · $675/yr
- Insurance
- −$71
- HOA
- −$0
- Vacancy / Maint / Mgmt
- −$373
- Net cashflow
- $386
Break-even live
UW: 25.0% down · 7.5% · 30yr · 1.5% tax · 5.0% vac · 8.0% maint · 8.0% mgmt
Financing live
Cash to close
- Down payment
- $42,475
- Closing costs
- $5,097
- Reserves months
- —
- Total cash needed
- —
Loan-product check · same deal, 3 products live
Conventional
25% down · 7.5% · 30yr
- Down + closing
- —
- Monthly P&I
- —
- Monthly cashflow
- —
- DSCR
- —
- Eligible?
- —
Personal DTI + credit; lowest rate.
DSCR
20% down · 8.5% · 30yr
- Down + closing
- —
- Monthly P&I
- —
- Monthly cashflow
- —
- DSCR
- —
- Eligible?
- —
No personal income docs; deal must DSCR.
Hard money
10% down · 12.0% · 12mo
- Down + closing
- —
- Monthly P&I
- —
- Monthly cashflow
- —
- DSCR
- —
- Eligible?
- —
Short-term bridge; refi at stabilization.
Rent comps 40 comps
| Address | Beds | Baths | Sqft | Rent | $/sqft | DOM | Units | Dist |
|---|---|---|---|---|---|---|---|---|
| 103 E 24th St Unit 1 Wilmington, DE | 3.0 | 1.0 | 1025 | $1,795 | $1.75 | 43d | 1 | 0.02mi |
| 5 E 24th St Unit 1 Wilmington, DE | 3.0 | 1.0 | 1150 | $1,795 | $1.56 | 43d | 1 | 0.07mi |
| 2705 Speakman Pl Wilmington, DE | 3.0 | 1.5 | 1100 | $1,975 | $1.80 | 12d | 1 | 0.22mi |
| 302 W 23rd St Unit 1 Wilmington, DE | 2.0 | 1.0 | 1450 | $1,295 | $0.89 | 24d | 1 | 0.36mi |
| 306 W 23rd St Unit 2 Wilmington, DE | 2.0 | 1.0 | 1475 | $1,295 | $0.88 | 43d | 1 | 0.37mi |
| 306 W 23rd St Unit 1 Wilmington, DE | 2.0 | 1.0 | 1475 | $1,295 | $0.88 | 24d | 1 | 0.37mi |
| 306 Concord Ave Unit 2 Wilmington, DE | 3.0 | 1.0 | 1100 | $1,350 | $1.23 | 43d | 1 | 0.38mi |
| 312 Concord Ave Unit 2 Wilmington, DE | 2.0 | 1.0 | 700 | $1,295 | $1.85 | 24d | 1 | 0.39mi |
| 314 Concord Ave Unit 2 Wilmington, DE | 2.0 | 1.0 | 1300 | $1,295 | $1.00 | 24d | 1 | 0.39mi |
| 3005 N West St Wilmington, DE | 3.0 | 1.0 | 1176 | $1,900 | $1.62 | 24d | 1 | 0.42mi |
| 2923 N Washington St Wilmington, DE | 3.0 | 1.0 | 1225 | $1,600 | $1.31 | 1d | 1 | 0.43mi |
| 400 W 29th St Wilmington, DE | 3.0 | 1.5 | 1125 | $1,950 | $1.73 | 43d | 1 | 0.44mi |
| 2601 N Heald St Wilmington, DE | 3.0 | 1.0 | 1025 | $1,795 | $1.75 | 1d | 1 | 0.44mi |
| 3003 N Washington St Wilmington, DE | 3.0 | 1.0 | 1250 | $1,950 | $1.56 | 43d | 1 | 0.45mi |
| 918 E 17th St Unit 1 Wilmington, DE | 3.0 | 1.0 | 1100 | $1,795 | $1.63 | 1d | 1 | 0.45mi |
| 517 W 26th St Unit NA Wilmington, DE | 3.0 | 1.5 | 1344 | $1,900 | $1.41 | 24d | 1 | 0.50mi |
| 409 W 20th St Unit 2 Wilmington, DE | 2.0 | 1.0 | 1100 | $1,500 | $1.36 | 12d | 1 | 0.52mi |
| 409 W 20th St Unit 2 Wilmington, DE | 2.0 | 1.0 | 1100 | $1,700 | $1.55 | 10d | 1 | 0.52mi |
| 604 W 20th St Unit 2 Wilmington, DE | 2.0 | 1.0 | 900 | $1,195 | $1.33 | 24d | 1 | 0.62mi |
| 518 E 12th St Wilmington, DE | 2.0 | 1.0 | 875 | $1,425 | $1.63 | 20d | 1 | 0.62mi |
| 608 W 20th St Wilmington, DE | 2.0 | 1.0 | 800 | $1,400 | $1.75 | 43d | 1 | 0.63mi |
| 1217 N King St Wilmington, DE | 3.0 | 1.5 | 1300 | $2,145 | $1.65 | 18d | 1 | 0.63mi |
| 1124 Clifford Brown Walk Wilmington, DE | 2.0 | 1.0 | 1240 | $1,625 | $1.31 | 43d | 1 | 0.64mi |
| 107 W 13th St Wilmington, DE | 3.0 | 1.5 | 1325 | $1,895 | $1.43 | 43d | 1 | 0.67mi |
| 547 Eastlawn Ave Wilmington, DE | 3.0 | 1.0 | 1400 | $1,995 | $1.43 | 43d | 1 | 0.68mi |
| 1026 Bennett St Wilmington, DE | 3.0 | 1.0 | 1125 | $1,685 | $1.50 | 1d | 1 | 0.73mi |
| 1004 N Spruce St Wilmington, DE | 3.0 | 1.5 | 1075 | $1,800 | $1.67 | 18d | 1 | 0.74mi |
| 605 E 10th St Wilmington, DE | 3.0 | 1.0 | 1200 | $1,850 | $1.54 | 24d | 1 | 0.74mi |
| 928 Kirkwood St Wilmington, DE | 3.0 | 1.5 | 1150 | $1,700 | $1.48 | 17d | 1 | 0.78mi |
| 1001 N Orange St Wilmington, DE | 1.0–2.0 | 1.0–2.0 | 833 | $2,135 | $2.56 | 1d | 62 | 0.82mi |
| 507 Barrett St Wilmington, DE | 3.0 | 1.0 | 1275 | $1,700 | $1.33 | 43d | 1 | 0.82mi |
| 913 N Market St Wilmington, DE | 1.0–2.0 | 1.0–2.0 | 974 | $1,985 | $2.04 | 43d | 5 | 0.85mi |
| 835 N Spruce St Wilmington, DE | 3.0 | 1.0 | 775 | $1,700 | $2.19 | 1d | 1 | 0.86mi |
| 116 W 9th St Wilmington, DE | 1.0–2.0 | 1.0–2.0 | 813 | $2,250 | $2.77 | 1d | 16 | 0.93mi |
| 3408 Miller Rd Wilmington, DE | 1.0–2.0 | 1.0–2.0 | 889 | $1,775 | $2.00 | 5d | 6 | 0.93mi |
| 228 W 9th St Unit 201 Wilmington, DE | 2.0 | 2.0 | 1031 | $1,695 | $1.64 | 44d | 1 | 0.94mi |
| 15 W Girard St Unit 105 Wilmington, DE | 2.0 | 1.0 | 740 | $1,645 | $2.22 | 5d | 1 | 0.95mi |
| 801 N Market St Unit 207 Wilmington, DE | 2.0 | 2.0 | 1239 | $1,895 | $1.53 | 5d | 1 | 0.96mi |
| 839 N Tatnall St Unit 303 Wilmington, DE | 2.0 | 2.0 | 876 | $1,475 | $1.68 | 5d | 1 | 0.96mi |
| 839 N Tatnall St Unit 101 Wilmington, DE | 2.0 | 2.0 | 1211 | $1,750 | $1.45 | 5d | 1 | 0.96mi |
Listing history 30 events
-
2026-06-18days on market $169,900 Active 78 DOM
-
2026-06-17days on market $169,900 Active 77 DOM
-
2026-06-16days on market $169,900 Active 76 DOM
-
2026-06-15days on market $169,900 Active 75 DOM
-
2026-06-13days on market $169,900 Active 73 DOM
-
2026-06-09days on market $169,900 Active 69 DOM
-
2026-06-08days on market $169,900 Active 68 DOM
-
2026-06-07days on market $169,900 Active 67 DOM
-
2026-06-04days on market $169,900 Active 64 DOM
-
2026-06-03days on market $169,900 Active 63 DOM
-
2026-06-02days on market $169,900 Active 62 DOM
-
2026-06-01days on market $169,900 Active 61 DOM
-
2026-05-31days on market $169,900 Active 60 DOM
-
2026-04-01$169,900 Active 923-char remark
Show marketing remark (923 chars)
Come see this newly renovated home within the city limits. This home is like buying brand new construction. Brand new roof, electric, plumbing, flooring, windows and HVAC. There are 3 nice size bedrooms and a powder room on the main floor. The upstairs bathroom has been eloquently updated with stylish tiling. All light fixtures are also brand new. The full basement can easily be finished off or it can be used as a huge storage area. The fenced in backyard can be setup as a nice oasis for BBQ's and outside entertainment. This property would be great for a first time home buyer. Located on a quiet street just minutes from public transportation and I-95. Make your appointment today. * * * This property is part of the Wilmington Neighborhood Conservancy Land Bank. Owner occupancy requirements of 5 years is required. This agreement can be transferred if buyer sells before 5 years to new owner-occupied owners.
-
2026-03-31historical
-
2026-01-08status Active
-
2025-12-31historical
-
2025-11-17$169,900 Active
-
2025-11-12historical
-
2025-10-21price $179,900
-
2025-10-07$185,000 Active
-
2011-11-17historical
-
2011-05-10$32,000
-
2010-04-20soldstatus $6,500
-
2010-04-20soldstatus $6,500
-
2010-04-06historical
-
2009-12-17$12,900
-
2009-12-17$12,900
-
2007-01-26soldstatus $44,900
-
2007-01-02$44,900
ⓘ Source: listings_history table (triggers on properties + properties_extension) + one-shot
backfill from property_details.listing_events for pre-trigger history.
Tax reassessment forecast DE · Partial reset (capped growth)
- Current annual tax
- $675 · $56/mo
- Projected year-2 tax
- $830 · $69/mo
- Expected delta
- +$155/yr (+$13/mo · 23.0%)
ⓘ Screening estimate from a state-policy table — verify with the county assessor before closing.
Climate risk First Street
- Flood 1/10 Low FEMA zone X (unshaded) · 0% chance over 30 yrs
- Wildfire 1/10 Low
- Heat 8/10 Severe 7 d/yr ≥103°F today · 16 d/yr by 30 yrs out
- Wind 6/10 Major 27% chance of damaging wind over 30 yrs
- Air quality 3/10 Moderate 2 unhealthy d/yr today · 3 by 30 yrs out
Nearby sold comps map
Loading sold comps map…
Walkable amenities ~0.75 mi
Loading nearby amenities…
Taxation est. · year 1
- Rental income
- $21,321
- − Mortgage interest
- −$9,517
- − Property taxes
- −$675
- − Insurance
- −$850
- − Repairs & maintenance
- −$1,706
- − Management
- −$1,706
- − Depreciation
- −$4,943
- Taxable income
- $1,925
- Est. tax owed @ 24.0%
- −$462
- After-tax cash flow
- $4,165/yr
For passive investors: Depreciation is non-cash, so a rental often shows a tax loss while cash-flowing — sheltering income. Rental losses are passive: they offset passive income freely, and up to $25,000/yr can offset ordinary (W-2) income if you actively participate and your MAGI is under $100k (phasing out to $0 by $150k); unused losses carry forward. On sale, claimed depreciation is recaptured at up to 25%, and gains may owe capital-gains tax (a 1031 exchange can defer both). Figures are a year-1 estimate at your 24.0% rate — not tax advice; consult a CPA.
Schools (NCES district)
- District
- Brandywine School District
- NCES district ID
- 1001240
- Math proficiency
- 28% ▼ -13.00%
- Reading proficiency
- 40% ▼ -13.00%
- Median HH income
- $68,743
- Composite
- 31.27/100
- National rank
- #6019
- State rank
- #11 of 26 in DE
Livability — Wilmington
- Score
- 64/100
- State rank
- #52
- US rank
- #14251
Category grades
Schools grade is shown separately in the Schools card above.
Census & demographics
- Census place
- Wilmington, DE
- County
- New Castle County · 483,412 people
- City population
- 173,480
- Metro
- Philadelphia-Camden-Wilmington, PA-NJ-DE-MD
- Population (ZIP)
- 26,051
- Household income
- $53,812
- Rent vs Own
- Severe rent burden
- 1816.0
Population outlook (New Castle County) Hauer SSP2
- Today (2025)
- 594,686 people
- By 2030
- 609,164 · +2.4%
- By 2040
- 632,154 · +6.3%
- By 2050
- 649,068 · +9.1%
- By 2075
- 687,771 · +15.7%
- By 2100
- 694,961 · +16.9%
Race, ethnicity, and origin ACS 2023
- Neighborhood character
- Predominantly Black (68%)
- Race & ethnicity
- Black 68% White 20% Hispanic / Latino 7% Two or more races 5%
- Hispanic origin (detail)
- Puerto Rican 4%
- Common ancestry
- Slovak 1% Romanian 1% Italian 1%
- Foreign-born
- 11% · Canada, Jamaica, China
- Languages at home
- 92% English-only · Spanish 4% Arabic 0%
Political lean MEDSL · New Castle
- 2024 margin
- Solid D (+32.6) · D 65.5% · R 32.9% · Other 1.6%
- 2008→2024 swing
- -8.1pp toward R · 2008: 40.6pp · 2024: 32.6pp
- All cycles
- 2024: D+32.6 2020: D+37.1 2016: D+29.6 2012: D+34.1 2008: D+40.6
Not yet ingested
- Civics
- —
Market trends
- HPI YoY
- ▼ -296.47%
- Current HPI
- 225.6613
- Rent YoY
- ▲ 5.72%
- Metro
- Philadelphia-Camden-Wilmington, PA-NJ-DE-MD
- State GDP YoY
- —
- F500 in state
- 0
Price history
+278.4% since first listed17 events — show timeline
- 2026-04-01 Listed $169,900 BRIGHT MLS
- 2026-03-31 Listing Removed — BRIGHT MLS
- 2026-01-08 Relisted — BRIGHT MLS
- 2025-12-31 Listing Removed — BRIGHT MLS
- 2025-11-17 Listed $169,900 BRIGHT MLS
- 2025-11-12 Listing Removed — BRIGHT MLS
- 2025-10-21 Price Changed $179,900 BRIGHT MLS
- 2025-10-07 Listed $185,000 BRIGHT MLS
- 2011-11-17 Listing Removed — BRIGHT MLS
- 2011-05-10 Listed $32,000 BRIGHT MLS
- 2010-04-20 Sold (MLS) $6,500 BRIGHT MLS
- 2010-04-20 Sold (MLS) $6,500 TREND
- 2010-04-06 Listing Removed — BRIGHT MLS
- 2009-12-17 Listed $12,900 BRIGHT MLS
- 2009-12-17 Listed $12,900 TREND
- 2007-01-26 Sold (MLS) $44,900 BRIGHT MLS
- 2007-01-02 Listed $44,900 BRIGHT MLS
Property tax history
-7.2%/yrLatest (2024): $675 · +12.6% YoY. Source: county tax records.
Cash-flow waterfall
monthlySold comps — $/sqft
last 12 mo · ≤1 miLoading sold comps…