1581 N Del Monte Rd · Dateland, AZ
Flood risk 1/10 · Minimal
- FEMA flood zone
- X (unshaded)
- Chance of flooding over 30 yrs
- 0.0%
- Est. flood insurance / yr
- $507 – $1,088
Fire risk 4/10 · Minor
- Est. fire insurance / yr
- $610 – $1,132
Heat risk 10/10 · Severe
- Hot days now (above 117°F)
- 7 days/yr
- Hot days in 30 yrs
- 19 days/yr
Wind risk 1/10 · Minimal
- Chance of severe wind over 30 yrs
- —
Air-quality risk 1/10 · Minimal
- Unhealthy air days now
- 0 days/yr
- Unhealthy air days in 30 yrs
- 0 days/yr
Risk factors via First Street. Map © Google.
Why this score? — see what drove the D grade
The composite is a weighted blend of 9 inputs, each scored 0–100. Each bar is that input's sub-score; the figure is the points it added to the 100-point composite (weight × sub-score).
- Cash flow +12.3/30.0
- ARV discount +7.5/15.0
- Appreciation +5.0/10.0
- DSCR +3.7/10.0
- Schools +3.6/10.0
- Rent growth +2.5/5.0
- Condition / age +2.5/5.0
- 1% rule +2.3/10.0
- Livability +1.9/5.0
$155,000
🖨 Deal sheet (PDF) 📄 Offer letter ✓ Due diligence
Listing remarks
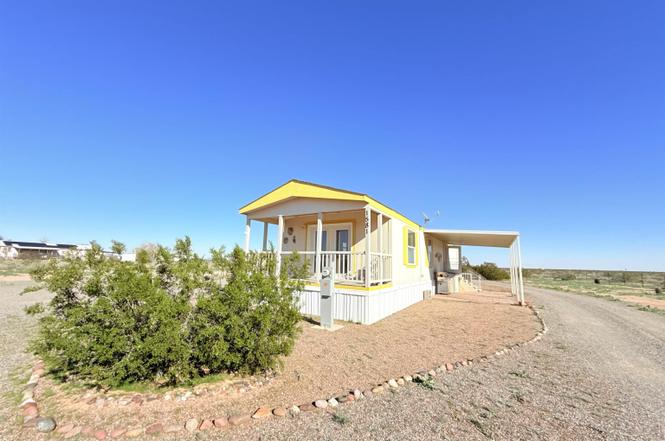
Enjoy peaceful desert living on 1.01 acres in Dateland’s Sun Country Acres! This FURNISHED 2007 manufactured home offers 2 bedrooms, 2 bathrooms, and an efficient open floor plan with abundant natural light. The property provides plenty of space for RV parking, toys, animals, or future improvements, all with wide-open desert and mountain views. RV pad with 50 AMP power cord. Conveniently located just minutes from I-8, allowing easy access to Yuma, Wellton, and Phoenix. Enjoy the privacy of rural living while still being accessible to major travel routes. Ideal for a primary residence, seasonal retreat. The south lot (approximately 43,920 square feet) is to be included in the sale. Cal
Key facts
- Open floor plan
- Rv parking
- 50 amp power cord
Tags
Property features AI
Exterior
- Parking: Open parking; RV access/parking
- Security: Smoke detector(s)
- Utilities: Public water; Septic tank
- Home design: Manufactured home (residential); Located in Sun Country Acres
- Construction: Mobile home / manufactured construction
- Exterior features: RV hookup; Shed(s); Has view; Covered patio
Interior
- Kitchen: Refrigerator; Electric range
- Flooring: Tile; Carpet
- Bathrooms: 2 full bathrooms
- Heating & cooling: Heating; Cooling
- Interior features: Double-pane windows; Blinds; Smoke detector(s)
- Laundry & utility: Washer; Dryer
Neighborhood map
What this means for you Summary
Snapshot
- This is a 2-bed/2.0-bath manufactured listed at $155k.
Deal economics
- At list price, monthly cash flow is $-28 ($-333/yr) — negative.
- To cash-flow at today's rent, offer at most $150k (3.2% below list).
- To meet the 1% rule (rent ≥ 1% of price), the offer needs to be $113k (27.0% below list).
- Recommended offer: $113k (27.0% below list) — sets the bar for 1% rule.
Location & tenants
- Location reads 38/100 on livability (#409 in AZ) — a limited-amenity area; tenant pool skews transient or value-seeking. Strengths: crime A, cost of living A; Watch: amenities F, commute F, employment F.
- Hyder Elementary District (4502) (rural): math 45% / reading 35% proficiency, ranked #206 of 501 in AZ (top 41%) — families likely to look elsewhere, expect single-tenant / working-renter base with shorter leases; 66% free/reduced lunch — lower-income household profile, screen leases tightly.
- Zoned schools: Dateland Elementary School (math 32% / reading 32%, grade F, #505 of 1,109 statewide, top 47%, 86 students, 78% FRL); Antelope Union High School (math 5% / reading 15%, grade F, #298 of 381 statewide, top 90%, 199 students, 64% FRL).
- Zoned-school proficiency averages 21% at this address vs 40% district-wide (-19 pts) — the specific schools serving this property underperform the Hyder Elementary District (4502) average; the district grade overstates school quality for this exact location.
- Market conditions: 32 active listings in the ZIP; 1,399 units permitted in Yuma County in 2024 (180 in 5+ unit buildings).
Forward outlook
- In year one you build about $6k of equity ($1k loan paydown + $5k appreciation (3.0% local appreciation)).
- Yuma County population projected at +4% by 2050 — modest demand growth; plan on rents tracking national, not racing it.
- At projected returns (3.0% appreciation + 3.0% rent growth), your $43k cash investment doubles in ~7 years — after that, you're playing with house money.
- By year 6, paydown + projected appreciation supports a ~$30k cash-out refi (75% LTV) — recoverable capital for the next deal without selling this one.
Negotiation context
- It's been on market 159 days — a 12% lower offer ($136k) is reasonable based on typical stale-listing flexibility.
- Current owner paid $45k; list at $155k implies a 244% gain — meaningful room to come down on a strong offer.
Risks & watch-outs
- Climate carrying-cost: extreme-heat days projected 7→19/yr by 2055 (HVAC capex compounding) — expect insurance premiums to compound above CPI over the hold.
Questions for the listing agent
- What do current leases actually rent for vs. the listed asking? Can we see a recent rent roll and the last 12 months of T-12 income?
- It's been on market 159 days. Have you received any prior offers? Is the seller open to a 27% concession, seller financing, or rate buy-down credit?
- Why hasn't it sold? Are there any deal-killer items the seller is aware of (foundation, flood, title, zoning, code violations)?
- Is there a deadline driving the sale (1031 exchange, divorce, estate, relocation)? That informs how much negotiation room exists.
- Schools are D-rated, which usually means shorter tenancies and higher turnover. Who's the typical renter profile here, and what's been the actual vacancy rate?
- The area grade is low — what's the realistic commute time and amenity access for the typical tenant pool here? Any planned neighborhood developments (good or bad) we should know about?
- What's the average days-on-market for RENTAL listings here right now (not sales)? A rising rental-DOM trend means longer vacancies and softer asking-rent achievability than the comps imply.
- What's the recent tenant-quality profile in this submarket — average credit score on applications, eviction rate, late-payment / NSF rate, and stable-employment percentage? A property-management company in the area should have these aggregated.
- How much new for-sale + rental construction is in the pipeline within 1–3 miles? Heavy new supply typically softens prices + rents 12–24 months out; constrained supply supports both.
Investment metrics
- 1% rule
- 0.73% ✗
- Cap rate
- 6.08%
- Cash-on-cash
- -0.77%
- DSCR
- 0.97
- GRM
- 11.4
CMA / ARV
No comps found within radius.
Projected returns pro-forma
3.0% appreciation · 3.0% rent growth · sell at horizon
- IRR
- 6.8%
- Equity multiple
- 1.39×
- Total profit
- $16,830
- Equity at exit
- $69,695
- IRR
- 9.5%
- Equity multiple
- 2.44×
- Total profit
- $62,310
- Equity at exit
- $107,408
Cash invested: $43,400 (down + closing). Projections, not guarantees.
Landlord ↔ Tenant lean methodology
- Overall (STATE)
- 87 Strongly Landlord-Friendly
- State Arizona
- 87 Strongly Landlord-Friendly · R+3
- County
- — inherits STATE
- City
- — inherits STATE
ZIP-level market 85333
- Active inventory
- 32
- Price-to-rent
- 11.4×
Monthly cashflow live
- Estimated rent
- $1,131 medium interval (Pro) →
- Mortgage (P&I)
- −$813
- Tax from tax record
- −$44 /mo · $529/yr
- Insurance
- −$65
- HOA
- −$0
- Vacancy / Maint / Mgmt
- −$238
- Net cashflow
- $-28
Break-even live
Sensitivity live
| Price | -10% $60 | -5% $16 | +0% $-28 | +5% $-72 | +10% $-115 |
|---|---|---|---|---|---|
| Rent | -10% $-117 | -5% $-72 | +0% $-28 | +5% $17 | +10% $62 |
| Rate | -1.0pp $50 | -0.5pp $12 | base $-28 | +0.5pp $-68 | +1.0pp $-109 |
UW: 25.0% down · 7.5% · 30yr · 1.5% tax · 5.0% vac · 8.0% maint · 8.0% mgmt
Financing live
Cash to close
- Down payment
- $38,750
- Closing costs
- $4,650
- Reserves months
- —
- Total cash needed
- —
Loan-product check · same deal, 3 products live
Conventional
25% down · 7.5% · 30yr
- Down + closing
- —
- Monthly P&I
- —
- Monthly cashflow
- —
- DSCR
- —
- Eligible?
- —
Personal DTI + credit; lowest rate.
DSCR
20% down · 8.5% · 30yr
- Down + closing
- —
- Monthly P&I
- —
- Monthly cashflow
- —
- DSCR
- —
- Eligible?
- —
No personal income docs; deal must DSCR.
Hard money
10% down · 12.0% · 12mo
- Down + closing
- —
- Monthly P&I
- —
- Monthly cashflow
- —
- DSCR
- —
- Eligible?
- —
Short-term bridge; refi at stabilization.
Listing history 20 events
-
2026-06-21days on market $155,000 Active 159 DOM
-
2026-06-19days on market $155,000 Active 157 DOM
-
2026-06-18days on market $155,000 Active 156 DOM
-
2026-06-17days on market $155,000 Active 155 DOM
-
2026-06-16days on market $155,000 Active 154 DOM
-
2026-06-15days on market $155,000 Active 153 DOM
-
2026-06-14days on market $155,000 Active 151 DOM
-
2026-06-12days on market $155,000 Active 150 DOM
-
2026-06-10days on market $155,000 Active 148 DOM
-
2026-06-09days on market $155,000 Active 147 DOM
-
2026-06-08days on market $155,000 Active 146 DOM
-
2026-06-07days on market $155,000 Active 145 DOM
-
2026-06-05days on market $155,000 Active 142 DOM
-
2026-06-04days on market $155,000 Active 141 DOM
-
2026-06-02days on market $155,000 Active 140 DOM
-
2026-06-01days on market $155,000 Active 139 DOM
-
2026-05-31days on market $155,000 Active 138 DOM
-
2026-05-30days on market $155,000 Active 137 DOM
-
2026-01-13$155,000 Active
-
2018-04-02soldstatus $45,000
ⓘ Source: listings_history table (triggers on properties + properties_extension) + one-shot
backfill from property_details.listing_events for pre-trigger history.
Tax reassessment forecast AZ · Resets to sale price
- Current annual tax
- $529 · $44/mo
- Projected year-2 tax
- $1,023 · $85/mo
- Expected delta
- +$494/yr (+$41/mo · 93.4%)
ⓘ Screening estimate from a state-policy table — verify with the county assessor before closing.
Climate risk First Street
- Flood 1/10 Low FEMA zone X (unshaded) · 0% chance over 30 yrs
- Wildfire 4/10 Moderate
- Heat 10/10 Extreme 7 d/yr ≥117°F today · 19 d/yr by 30 yrs out
- Wind 1/10 Low
- Air quality 1/10 Low 0 unhealthy d/yr today · 0 by 30 yrs out
Nearby sold comps map
Loading sold comps map…
Walkable amenities ~0.75 mi
Loading nearby amenities…
Taxation est. · year 1
- Rental income
- $13,576
- − Mortgage interest
- −$8,682
- − Property taxes
- −$529
- − Insurance
- −$775
- − Repairs & maintenance
- −$1,086
- − Management
- −$1,086
- − Depreciation
- −$4,509
- Taxable loss
- −$3,092
- Est. tax savings @ 24.0%
- +$742
- After-tax cash flow
- $409/yr
For passive investors: Depreciation is non-cash, so a rental often shows a tax loss while cash-flowing — sheltering income. Rental losses are passive: they offset passive income freely, and up to $25,000/yr can offset ordinary (W-2) income if you actively participate and your MAGI is under $100k (phasing out to $0 by $150k); unused losses carry forward. On sale, claimed depreciation is recaptured at up to 25%, and gains may owe capital-gains tax (a 1031 exchange can defer both). Figures are a year-1 estimate at your 24.0% rate — not tax advice; consult a CPA.
Schools (NCES district)
- District
- Hyder Elementary District (4502)
- NCES district ID
- 0403900
- Math proficiency
- 45% ▬ 0.00%
- Reading proficiency
- 35% ▬ 0.00%
- Median HH income
- $38,598
- Composite
- 35.85/100
- National rank
- #9600
- State rank
- #206 of 501 in AZ
Livability — Dateland
- Score
- 38/100
- State rank
- #409
- US rank
- #27477
Category grades
Schools grade is shown separately in the Schools card above.
Census & demographics
- Census place
- Dateland, AZ
- Population (ZIP)
- 403
Population outlook (Yuma County) Hauer SSP2
- Today (2025)
- 211,633 people
- By 2030
- 214,114 · +1.2%
- By 2040
- 217,856 · +2.9%
- By 2050
- 220,276 · +4.1%
- By 2075
- 222,359 · +5.1%
- By 2100
- 198,880 · -6.0%
Race, ethnicity, and origin ACS 2023
- Neighborhood character
- Majority Hispanic (63%)
- Race & ethnicity
- Hispanic / Latino 63% White 36% Two or more races 26% Black 1%
- Hispanic origin (detail)
- Mexican 63%
- Common ancestry
- Italian 4% Scottish 4% Serbian 2%
- Foreign-born
- 23% · Canada
- Languages at home
- 54% English-only · Spanish 46%
Political lean MEDSL · Yuma
- 2024 margin
- Strong R (+20.4) · D 39.3% · R 59.8%
- 2008→2024 swing
- -6.6pp toward R · 2008: -13.8pp · 2024: -20.4pp
- All cycles
- 2024: R+20.4 2020: R+6.2 2016: R+5.5 2012: R+16.1 2008: R+13.8
Not yet ingested
- Civics
- —
Market trends
- HPI YoY
- —
- Current HPI
- —
- Rent YoY
- —
- Metro
- —
- State GDP YoY
- ▲ 4.54%
- F500 in state
- 20
Industry mix (Fortune 500 HQ in AZ)
| Industry | F500 HQs | Revenue |
|---|---|---|
| Technology | 2 | $13B |
|
||
| Mining / Metals | 1 | $23B |
|
||
| Environmental Services | 1 | $16B |
|
||
| Metals / Steel | 1 | $14B |
|
||
| Technology Distribution | 1 | $9B |
|
||
| Homebuilding | 1 | $8B |
|
||
Price history
+244.4% since first listed2 events — show timeline
- 2026-01-13 Listed $155,000 YAR
- 2018-04-02 Sold (Public Records) $45,000 Public Records
Property tax history
+7.2%/yrLatest (2025): $529 · +9.2% YoY. Source: county tax records.
Cash-flow waterfall
monthlySold comps — $/sqft
last 12 mo · ≤1 miLoading sold comps…