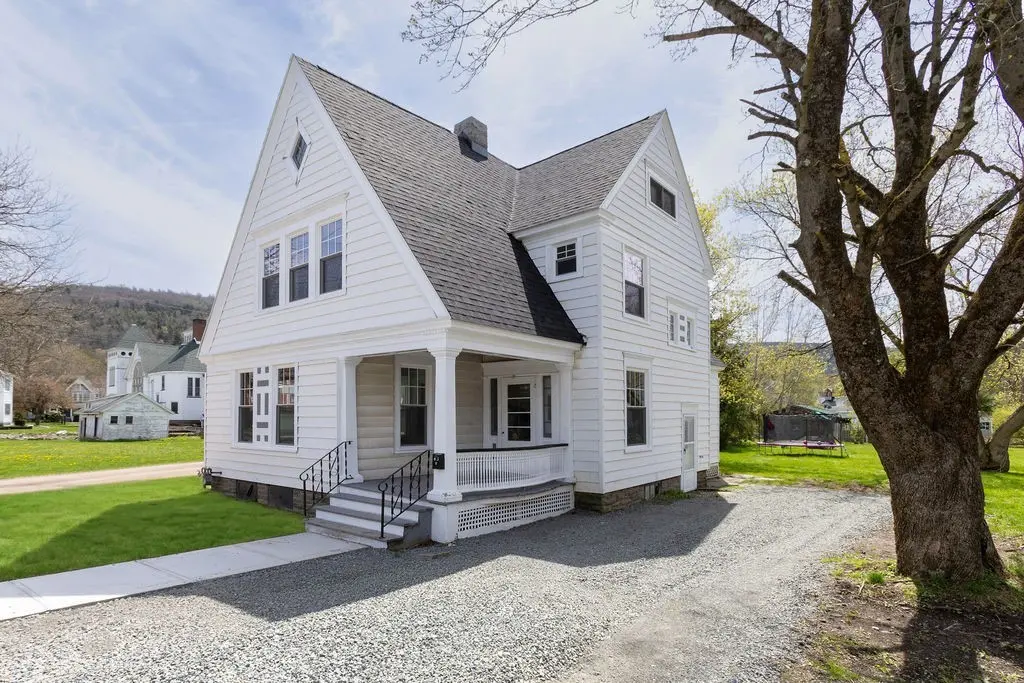
63 East St · Walton, NY
Flood risk 8/10 · Major
- FEMA flood zone
- X (unshaded)
- Chance of flooding over 30 yrs
- 0.99%
- Est. flood insurance / yr
- $473 – $860
Fire risk 1/10 · Minimal
- Est. fire insurance / yr
- $691 – $1,283
Heat risk 2/10 · Minimal
- Hot days now (above 90°F)
- 8 days/yr
- Hot days in 30 yrs
- 19 days/yr
Wind risk 2/10 · Minimal
- Chance of severe wind over 30 yrs
- 1.0%
Air-quality risk 2/10 · Minimal
- Unhealthy air days now
- 0 days/yr
- Unhealthy air days in 30 yrs
- 1 days/yr
Risk factors via First Street. Map © Google.
Why this score? — see what drove the B- grade
The composite is a weighted blend of 9 inputs, each scored 0–100. Each bar is that input's sub-score; the figure is the points it added to the 100-point composite (weight × sub-score).
- Cash flow +30.0/30.0
- 1% rule +10.0/10.0
- DSCR +10.0/10.0
- Appreciation +5.3/10.0
- Schools +3.5/10.0
- Livability +3.5/5.0
- Rent growth +2.5/5.0
- Condition / age +2.5/5.0
- ARV discount +0.0/15.0
$194,500
🖨 Deal sheet (PDF) 📄 Offer letter ✓ Due diligence
Listing remarks MLS
Endless Potential in the Village of Walton! This old-style home is full of character and waiting for the right buyer to bring it back to life. A true diamond in the rough, it’s been in the same family for over 25 years and now offers a unique opportunity for those looking to renovate and personalize their dream home. Situated within walking distance to schools, downtown, and the local pool and park, the location can’t be beat. Whether you’re an investor, DIY enthusiast, or someone with a creative vision, this property has all the makings of something special.
Key facts
- Updated electrical
- Refreshed bathrooms
- Updated kitchen
Tags
Property features AI
Exterior
- Parking: No garage
- Utilities: High-speed internet available; Public water connected; Sewer connected
- Home design: 3 stories; Existing/resale property
- Construction: Stone foundation; See seller remarks for construction materials
- Exterior features: Gravel driveway; Rectangular lot (approximately 0.25 acre, 150 x 150); Road frontage on a main thoroughfare
Interior
- Kitchen: Gas oven; Gas range; Refrigerator
- Flooring: Carpet; Hardwood; Varies
- Bathrooms: 1 full bathroom; 1 half bathroom; One main-level bathroom
- Heating & cooling: Gas forced-air heating
- Interior features: Separate/formal living room; Country kitchen; Full basement
- Laundry & utility: Laundry on upper level; Gas water heater
Neighborhood map
What this means for you Summary
Snapshot
- This is a 3-bed/2.0-bath single-family listed at $194k.
Deal economics
- At list price, monthly cash flow is $1k ($13k/yr) — positive.
- The deal already cash-flows at list — no discount required.
- Meets the 1% rule at list price ($3k rent vs $194k).
- Recommended offer: $189k (3.0% below list) — sets the bar for market timing.
- Cap rate 13.6% vs local median 7.8% in Walton — top-decile yield for the area; either an underpriced asset or a hidden risk that comps aren't pricing in. Stress-test before assuming the spread holds.
Location & tenants
- Location reads 70/100 on livability (#443 in NY) — a middle-class / working-renter tenant base. Strengths: cost of living A+, health & safety A+; Watch: amenities F, commute F, employment F.
- Walton Central School District (town): math 36% / reading 47% proficiency, ranked #510 of 590 in NY (top 86%) — families likely to look elsewhere, expect single-tenant / working-renter base with shorter leases.
- Zoned schools: Townsend Elementary School (math 32% / reading 42%, grade F, #1,519 of 2,108 statewide, top 74%, 367 students, 47% FRL); Walton Middle School (math 17% / reading 42%, grade F, #550 of 729 statewide, top 77%, 189 students, 54% FRL); Walton High School (math 84% / reading 90%, grade A, #308 of 1,100 statewide, top 28%, 283 students, 50% FRL) — zoned schools at 51% FRL track the district average.
- Market conditions: 5 active listings in the ZIP; 66 units permitted in Delaware County in 2024 (0 in 5+ unit buildings).
Forward outlook
- In year one you build about $3k of equity ($1k loan paydown + $1k appreciation (0.6% local appreciation)).
- Delaware County population projected at -27% by 2050 — secular population decline; favor cash flow + early exit over multi-decade hold.
- At projected returns (0.6% appreciation + 3.0% rent growth), your $54k cash investment doubles in ~4 years — after that, you're playing with house money.
Negotiation context
- It's been on market 56 days — a 3% lower offer ($189k) is reasonable based on typical stale-listing flexibility.
- 2 sale attempts with the ask held roughly flat each time — persistent listings suggest the price (not the market) is what's stuck; bring a comps-based counter.
- Current owner paid $30k; list at $194k implies a 548% gain — meaningful room to come down on a strong offer.
Risks & watch-outs
- Watch-outs: flood insurance adds $56/mo; built in 1910 — expect roof / HVAC / electrical / plumbing capex.
- Climate carrying-cost: severe flood risk — expect insurance premiums to compound above CPI over the hold.
Questions for the listing agent
- It's been on market 56 days. Have you received any prior offers? Is the seller open to a 3% concession, seller financing, or rate buy-down credit?
- Built in 1910 — when were the roof, HVAC, electrical panel, plumbing, and water heater last replaced?
- What's the actual annual flood-insurance premium (NFIP or private), and is the property in a SFHA with mandatory coverage?
- Is there a deadline driving the sale (1031 exchange, divorce, estate, relocation)? That informs how much negotiation room exists.
- Schools are D-rated, which usually means shorter tenancies and higher turnover. Who's the typical renter profile here, and what's been the actual vacancy rate?
- What's the average days-on-market for RENTAL listings here right now (not sales)? A rising rental-DOM trend means longer vacancies and softer asking-rent achievability than the comps imply.
- What's the recent tenant-quality profile in this submarket — average credit score on applications, eviction rate, late-payment / NSF rate, and stable-employment percentage? A property-management company in the area should have these aggregated.
- How much new for-sale + rental construction is in the pipeline within 1–3 miles? Heavy new supply typically softens prices + rents 12–24 months out; constrained supply supports both.
Investment metrics
- 1% rule
- 1.63% ✓
- Cap rate
- 13.56%
- Cash-on-cash
- 25.95%
- DSCR
- 2.15
- GRM
- 5.1
CMA / ARV
- ARV (median comp)
- $159,713
- List price
- $194,500
- Delta
- 21.78%
- Verdict
- OVERPRICED
- Comps
- 20 within 1.0 mi
Show comp detail 12 sales within ~0.75 mi
| Address | Dist | Beds/Ba | Sqft | Sold | Price | $/sf | Match |
|---|---|---|---|---|---|---|---|
| 79 Liberty St | 0.13mi | 3/2.0 | 1,440 (-4%) | 1mo | $267,500 | $186 | 87 |
| 82 Saint John St | 0.25mi | 4/2.0 (+1) | 1,408 (-6%) | 3mo | $110,000 | $78 | 72 |
| 57 Liberty St | 0.19mi | 4/2.0 (+1) | 1,431 (-4%) | 14mo | $65,000 | $45 | 68 |
| 49 North St | 0.26mi | 4/1.5 (+1) | 1,560 (+5%) | 10mo | $180,000 | $115 | 65 |
| 81 Park St | 0.42mi | 3/1.5 | 1,536 (+3%) | 19mo | $230,000 | $150 | 58 |
| 13 Liberty St | 0.38mi | 3/1.0 | 1,400 (-6%) | 14mo | $37,000 | $26 | 56 |
| 26 Saint John St | 0.33mi | 3/1.5 | 1,688 (+13%) | 9mo | $225,000 | $133 | 54 |
| 42 Delaware St | 0.59mi | 3/1.0 | 1,390 (-7%) | 8mo | $100,000 | $72 | 50 |
| 9 & 11 New St | 0.75mi | 3/1.0 | 1,584 (+6%) | 3mo | $225,000 | $142 | 49 |
| — | 0.32mi | 3/1.0 | 1,700 (+14%) | 17mo | $110,000 | $65 | 44 |
| 7 Maple St | 0.71mi | 2/1.0 (-1) | 1,404 (-6%) | 8mo | $165,000 | $118 | 41 |
| 5 Ogden St | 0.59mi | 3/1.0 | 1,320 (-12%) | 18mo | $62,000 | $47 | 34 |
Match score weights: distance 35% · size 25% · config 20% · recency 20%. Top-matched comps best support the ARV.
Projected returns pro-forma
0.61% appreciation · 3.0% rent growth · sell at horizon
- IRR
- 26.2%
- Equity multiple
- 2.31×
- Total profit
- $71,542
- Equity at exit
- $62,516
- IRR
- 29.3%
- Equity multiple
- 4.43×
- Total profit
- $186,745
- Equity at exit
- $80,153
Cash invested: $54,460 (down + closing). Projections, not guarantees.
Landlord ↔ Tenant lean methodology
- Overall (STATE)
- 15 Strongly Tenant-Friendly
- State New York
- 15 Strongly Tenant-Friendly · D+10
- County
- — inherits STATE
- City
- — inherits STATE
ZIP-level market 13846
- Home prices YoY
- 0.6%
- Active inventory
- 5
- Price-to-rent
- 5.1×
Monthly cashflow live
- Estimated rent
- $3,176 medium interval (Pro) →
- Mortgage (P&I)
- −$1,020
- Tax from tax record
- −$230 /mo · $2,765/yr
- Insurance
- −$81
- Flood insurance flood zone
- −$56 /mo · $666/yr
- HOA
- −$0
- Vacancy / Maint / Mgmt
- −$667
- Net cashflow
- $1,122
Break-even live
Sensitivity live
| Price | -10% $1,232 | -5% $1,177 | +0% $1,122 | +5% $1,067 | +10% $1,012 |
|---|---|---|---|---|---|
| Rent | -10% $871 | -5% $997 | +0% $1,122 | +5% $1,248 | +10% $1,373 |
| Rate | -1.0pp $1,220 | -0.5pp $1,172 | base $1,122 | +0.5pp $1,072 | +1.0pp $1,021 |
UW: 25.0% down · 7.5% · 30yr · 1.5% tax · 5.0% vac · 8.0% maint · 8.0% mgmt
Financing live
Cash to close
- Down payment
- $48,625
- Closing costs
- $5,835
- Reserves months
- —
- Total cash needed
- —
Loan-product check · same deal, 3 products live
Conventional
25% down · 7.5% · 30yr
- Down + closing
- —
- Monthly P&I
- —
- Monthly cashflow
- —
- DSCR
- —
- Eligible?
- —
Personal DTI + credit; lowest rate.
DSCR
20% down · 8.5% · 30yr
- Down + closing
- —
- Monthly P&I
- —
- Monthly cashflow
- —
- DSCR
- —
- Eligible?
- —
No personal income docs; deal must DSCR.
Hard money
10% down · 12.0% · 12mo
- Down + closing
- —
- Monthly P&I
- —
- Monthly cashflow
- —
- DSCR
- —
- Eligible?
- —
Short-term bridge; refi at stabilization.
Listing history 21 events
-
2026-06-22days on market $194,500 Active 56 DOM
-
2026-06-21days on market $194,500 Active 55 DOM
-
2026-06-21days on market $194,500 Active 54 DOM
-
2026-06-18days on market $194,500 Active 52 DOM
-
2026-06-17days on market $194,500 Active 51 DOM
-
2026-06-16days on market $194,500 Active 50 DOM
-
2026-06-15days on market $194,500 Active 49 DOM
-
2026-06-13days on market $194,500 Active 47 DOM
-
2026-06-12days on market $194,500 Active 46 DOM
-
2026-06-09days on market $194,500 Active 43 DOM
-
2026-06-08days on market $194,500 Active 42 DOM
-
2026-06-07days on market $194,500 Active 41 DOM
-
2026-06-07days on market $194,500 Active 40 DOM
-
2026-06-04days on market $194,500 Active 37 DOM
-
2026-06-02days on market $194,500 Active 36 DOM
-
2026-06-01days on market $194,500 Active 35 DOM
-
2026-05-31days on market $194,500 Active 34 DOM
-
2026-04-27$199,000 Active 797-char remark
-
2025-09-15soldstatus $30,000 Closed 584-char remark
Show marketing remark (584 chars)
Endless Potential in the Village of Walton! This old-style home is full of character and waiting for the right buyer to bring it back to life. A true diamond in the rough, it’s been in the same family for over 25 years and now offers a unique opportunity for those looking to renovate and personalize their dream home. Situated within walking distance to schools, downtown, and the local pool and park, the location can’t be beat. Whether you’re an investor, DIY enthusiast, or someone with a creative vision, this property has all the makings of something special.
-
2025-06-17status Pending 584-char remark
Show marketing remark (584 chars)
Endless Potential in the Village of Walton! This old-style home is full of character and waiting for the right buyer to bring it back to life. A true diamond in the rough, it’s been in the same family for over 25 years and now offers a unique opportunity for those looking to renovate and personalize their dream home. Situated within walking distance to schools, downtown, and the local pool and park, the location can’t be beat. Whether you’re an investor, DIY enthusiast, or someone with a creative vision, this property has all the makings of something special.
-
2025-06-07$49,900 Active 584-char remark
Show marketing remark (584 chars)
Endless Potential in the Village of Walton! This old-style home is full of character and waiting for the right buyer to bring it back to life. A true diamond in the rough, it’s been in the same family for over 25 years and now offers a unique opportunity for those looking to renovate and personalize their dream home. Situated within walking distance to schools, downtown, and the local pool and park, the location can’t be beat. Whether you’re an investor, DIY enthusiast, or someone with a creative vision, this property has all the makings of something special.
ⓘ Source: listings_history table (triggers on properties + properties_extension) + one-shot
backfill from property_details.listing_events for pre-trigger history.
Tax reassessment forecast NY · Partial reset (capped growth)
- Current annual tax
- $2,765 · $230/mo
- Projected year-2 tax
- $3,026 · $252/mo
- Expected delta
- +$261/yr (+$22/mo · 9.4%)
ⓘ Screening estimate from a state-policy table — verify with the county assessor before closing.
Climate risk First Street
- Flood 8/10 Severe FEMA zone X (unshaded) · 99% chance over 30 yrs
- Wildfire 1/10 Low
- Heat 2/10 Low 8 d/yr ≥90°F today · 19 d/yr by 30 yrs out
- Wind 2/10 Low 100% chance of damaging wind over 30 yrs
- Air quality 2/10 Low 0 unhealthy d/yr today · 1 by 30 yrs out
Nearby sold comps map
Loading sold comps map…
Walkable amenities ~0.75 mi
Loading nearby amenities…
Taxation est. · year 1
- Rental income
- $38,116
- − Mortgage interest
- −$10,895
- − Property taxes
- −$2,765
- − Insurance
- −$1,639
- − Repairs & maintenance
- −$3,049
- − Management
- −$3,049
- − Depreciation
- −$5,658
- Taxable income
- $11,060
- Est. tax owed @ 24.0%
- −$2,654
- After-tax cash flow
- $10,813/yr
For passive investors: Depreciation is non-cash, so a rental often shows a tax loss while cash-flowing — sheltering income. Rental losses are passive: they offset passive income freely, and up to $25,000/yr can offset ordinary (W-2) income if you actively participate and your MAGI is under $100k (phasing out to $0 by $150k); unused losses carry forward. On sale, claimed depreciation is recaptured at up to 25%, and gains may owe capital-gains tax (a 1031 exchange can defer both). Figures are a year-1 estimate at your 24.0% rate — not tax advice; consult a CPA.
Schools (NCES district)
- District
- Walton Central School District
- NCES district ID
- 3629820
- Math proficiency
- 36% ▬ 0.00%
- Reading proficiency
- 47% ▲ 3.00%
- Median HH income
- $41,231
- Composite
- 34.86/100
- National rank
- #5088
- State rank
- #510 of 590 in NY
Livability — Walton
- Score
- 70/100
- State rank
- #443
- US rank
- #7789
Category grades
Schools grade is shown separately in the Schools card above.
Census & demographics
- Census place
- Walton, NY
- Population (ZIP)
- 259
Population outlook (Delaware County) Hauer SSP2
- Today (2025)
- 42,668 people
- By 2030
- 40,337 · -5.5%
- By 2040
- 35,514 · -16.8%
- By 2050
- 31,265 · -26.7%
- By 2075
- 24,455 · -42.7%
- By 2100
- 19,529 · -54.2%
Race, ethnicity, and origin ACS 2023
- Neighborhood character
- Predominantly White (99%)
- Race & ethnicity
- White 99% Black 1%
- Common ancestry
- Romanian 3% Serbian 2% Italian 2%
- Foreign-born
- 2%
- Languages at home
- 85% English-only · German/W. Germanic 13% Other Indo-European 2%
Political lean MEDSL · Delaware
- 2024 margin
- R (+19.8) · D 40.1% · R 59.9%
- 2008→2024 swing
- -14.6pp toward R · 2008: -5.2pp · 2024: -19.8pp
- All cycles
- 2024: R+19.8 2020: R+18.4 2016: R+29.2 2012: R+9.6 2008: R+5.2
Not yet ingested
- Civics
- —
Market trends
- HPI YoY
- ▲ 0.61%
- Current HPI
- 107.0809
- Rent YoY
- —
- Metro
- —
- State GDP YoY
- ▲ 2.60%
- F500 in state
- 92
Industry mix (Fortune 500 HQ in NY)
| Industry | F500 HQs | Revenue |
|---|---|---|
| Financial Services | 10 | $950B |
|
||
| Consumer Goods | 9 | $162B |
|
||
| Insurance | 4 | $225B |
|
||
| Telecommunications | 2 | $144B |
|
||
| Pharmaceuticals | 2 | $112B |
|
||
| Media / Entertainment | 2 | $69B |
|
||
Price history
+289.8% since first listed5 events — show timeline
- 2026-05-23 Price Changed $194,500 UNYREIS
- 2026-04-27 Listed $199,000 UNYREIS
- 2025-09-15 Sold (MLS) $30,000 UNYREIS
- 2025-06-17 Pending — UNYREIS
- 2025-06-07 Listed $49,900 UNYREIS
Property tax history
+2.1%/yrLatest (2025): $2,765 · +6.8% YoY. Source: county tax records.
Cash-flow waterfall
monthlySold comps — $/sqft
last 12 mo · ≤1 miLoading sold comps…