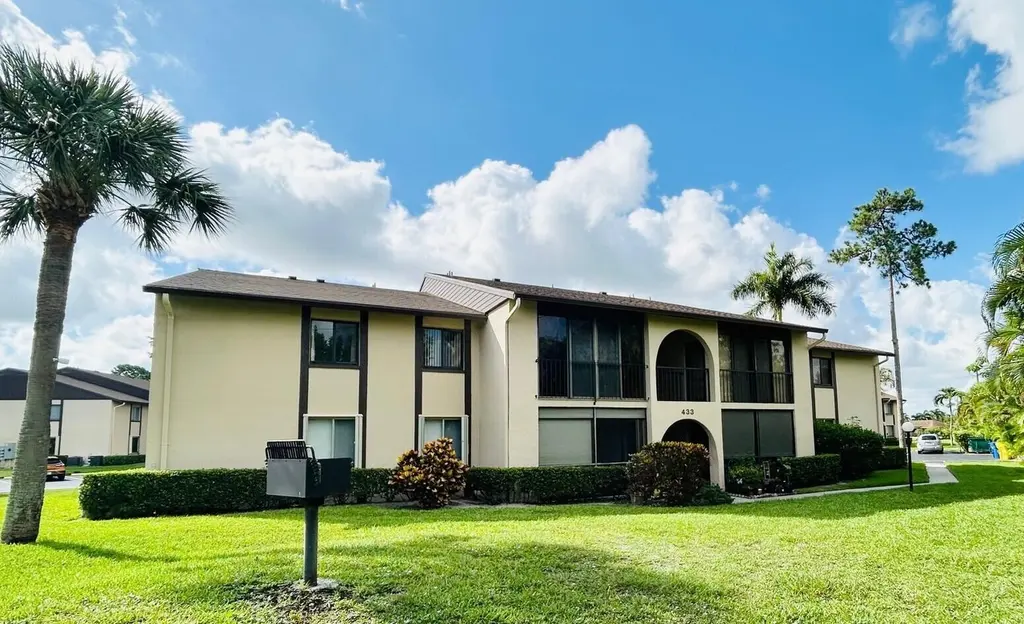
433 Pine Glen Ln Unit C2 · Greenacres, FL
Flood risk 1/10 · Minimal
- FEMA flood zone
- X (unshaded)
- Chance of flooding over 30 yrs
- 0.0%
- Est. flood insurance / yr
- $507 – $1,088
Fire risk 1/10 · Minimal
- Est. fire insurance / yr
- $947 – $1,759
Heat risk 10/10 · Severe
- Hot days now (above 106°F)
- 7 days/yr
- Hot days in 30 yrs
- 28 days/yr
Wind risk 10/10 · Severe
- Chance of severe wind over 30 yrs
- 99.0%
Air-quality risk 2/10 · Minimal
- Unhealthy air days now
- 0 days/yr
- Unhealthy air days in 30 yrs
- 2 days/yr
Risk factors via First Street. Map © Google.
Why this score? — see what drove the C- grade
The composite is a weighted blend of 9 inputs, each scored 0–100. Each bar is that input's sub-score; the figure is the points it added to the 100-point composite (weight × sub-score).
- Cash flow +19.1/30.0
- 1% rule +8.4/10.0
- ARV discount +7.5/15.0
- DSCR +6.0/10.0
- Schools +4.3/10.0
- Livability +3.5/5.0
- Rent growth +2.8/5.0
- Condition / age +2.5/5.0
- Appreciation +0.0/10.0
$154,000
🖨 Deal sheet 📄 Offer letter ✓ Due diligence
Listing remarks MLS
2BR/2BA PERFECT FOR SEASONAL OR YEAR-ROUND. WONDERFUL GLASSED IN PORCH, BEAUTIFUL GLAZED TILE, NEWER A/C AND W/H IN A GREAT COMMUNITY, WELL KEPT AND SERENE. CENTRALLY LOCATED.
Key facts
- Walk in showers
- Gfci outlets
- Usb charging outlet
Tags
Property features AI
Finance
- Other: Directions: Meleluca Lane to Pine Glen Lane, turn right; Senior community
- Financial info: Not on land lease; Pets not allowed (per association)
- HOA & community: Part of Pine Ridge South 4 association; Quarterly HOA fee; HOA amenities include clubhouse, heated pool, tennis courts, pickleball and shuffleboard courts, bocce ball, library, manager on site and management services; HOA covers cable TV, grounds and structure maintenance, pest control, security, common areas, common real estate tax, legal/accounting and reserve funds
Exterior
- Parking: Assigned parking (total 2 spaces; 1 open space)
- Security: Association-provided security
- Utilities: Public water; Public sewer; Cable available; Electricity connected; Sewer connected; Water connected
- Home design: Condominium; One level living; Faces east; Resale property; 2 total stories in building
- Construction: Built with CBS (concrete block) construction
- Exterior features: Not waterfront; Shingle roof; Asphalt and assigned parking
Interior
- Kitchen: Dishwasher; Electric range; Refrigerator; Electric water heater
- Bedrooms: 2 bedrooms on the main level
- Flooring: Laminate; Tile
- Bathrooms: 2 full bathrooms on the main level
- Heating & cooling: Central heating; Central air; Ceiling fan(s)
- Interior features: Walk-in closet(s); Storm windows
- Laundry & utility: In-unit laundry room
Neighborhood map
What this means for you Summary
Snapshot
- This is a 2-bed/2.0-bath condo listed at $154k.
Deal economics
- At list price, monthly cash flow is $163 ($2k/yr) — positive.
- The deal already cash-flows at list — no discount required.
- Meets the 1% rule at list price ($2k rent vs $154k).
Location & tenants
- Location reads 69/100 on livability (#490 in FL) — a middle-class / working-renter tenant base. Strengths: cost of living A+, housing A+, health & safety A; Watch: employment D, amenities F, commute F.
- Palm Beach (suburban): math 46% / reading 53% proficiency, ranked #34 of 73 in FL (top 47%) — families likely to look elsewhere, expect single-tenant / working-renter base with shorter leases.
- Zoned schools: Heritage Elementary School (math 35% / reading 39%, grade F, #1,609 of 2,144 statewide, top 77%, 786 students, 75% FRL); L C Swain Middle School (math 26% / reading 33%, grade F, #469 of 571 statewide, top 84%, 1,451 students, 74% FRL); Santaluces Community High (math 22% / reading 39%, grade F, #434 of 667 statewide, top 66%, 2,675 students, 61% FRL) — zoned schools average 70% FRL vs 52% district-wide (18 pts higher); higher-poverty schools than district average — tighter screening recommended.
- Zoned-school proficiency averages 32% at this address vs 50% district-wide (-17 pts) — the specific schools serving this property underperform the Palm Beach average; the district grade overstates school quality for this exact location.
- Market conditions: Rents rising (+1.3%/yr); 346 active listings in the ZIP; 40 comparable units currently listed for rent nearby; rentals at typical pace (median 24d on market — plan ~3-4 weeks tenant-placement turnaround); 3,974 units permitted in Palm Beach County in 2024 (1,012 in 5+ unit buildings).
- This rent runs 34% of the median local income ($74k/yr) — at the standard rent-burdened threshold; future hikes will face affordability resistance.
Forward outlook
- Local home prices are declining (-3.0%/yr); year-one equity from $1k of loan paydown is wiped out by about $5k of value loss. Plan a longer hold.
- Palm Beach County population projected at +30% by 2050 — long-run rental-demand tailwind backs the buy-and-hold thesis.
Negotiation context
- Only 10 days on market — expect competitive offers; lowballing is unlikely to land.
- 2 sale attempts since 23y ago with the ask held roughly flat each time — persistent listings suggest the price (not the market) is what's stuck; bring a comps-based counter.
- Current owner paid $75k; list at $154k implies a 106% gain — meaningful room to come down on a strong offer.
Risks & watch-outs
- Watch-outs: HOA is 27% of rent.
- Climate carrying-cost: severe wind risk, 99% chance of damaging wind over 30y; extreme-heat days projected 7→28/yr by 2055 (HVAC capex compounding) — expect insurance premiums to compound above CPI over the hold.
Questions for the listing agent
- What does the HOA fee cover, when was the last increase, and are there any pending special assessments or reserve-fund shortfalls?
- Any open or pending special assessments — roof, HVAC, plumbing, elevator, façade? What's the per-unit balance and payoff schedule, and is the seller paying it off at close or rolling it to the buyer?
- Is there a deadline driving the sale (1031 exchange, divorce, estate, relocation)? That informs how much negotiation room exists.
- Schools are D-rated, which usually means shorter tenancies and higher turnover. Who's the typical renter profile here, and what's been the actual vacancy rate?
- What's the average days-on-market for RENTAL listings here right now (not sales)? A rising rental-DOM trend means longer vacancies and softer asking-rent achievability than the comps imply.
- What's the recent tenant-quality profile in this submarket — average credit score on applications, eviction rate, late-payment / NSF rate, and stable-employment percentage? A property-management company in the area should have these aggregated.
- How much new apartment / multifamily construction is in the pipeline within 1–3 miles? Heavy new supply (>2% of stock underway) typically softens rents 12–24 months out; light construction supports rent growth.
Investment metrics
- 1% rule
- 1.34% ✓
- Cap rate
- 7.56%
- Cash-on-cash
- 4.54%
- DSCR
- 1.20
- GRM
- 6.2
CMA / ARV
No comps found within radius.
Projected returns pro-forma
-3.0% appreciation · 1.33% rent growth · sell at horizon
- IRR
- -11.6%
- Equity multiple
- 0.59×
- Total profit
- $-17,698
- Equity at exit
- $22,962
- IRR
- -5.7%
- Equity multiple
- 0.67×
- Total profit
- $-14,440
- Equity at exit
- $13,315
Cash invested: $43,120 (down + closing). Projections, not guarantees.
Landlord ↔ Tenant lean methodology
- Overall (STATE)
- 87 Strongly Landlord-Friendly
- State Florida
- 87 Strongly Landlord-Friendly · R+3
- County
- — inherits STATE
- City
- — inherits STATE
ZIP-level market 33463
- Home prices YoY
- -30.9%
- Rents YoY
- 1.3%
- Active inventory
- 346
- Price-to-rent
- 6.2×
Monthly cashflow live
- Estimated rent
- $2,065 high interval (Pro) →
- Mortgage (P&I)
- −$808
- Tax from tax record
- −$45 /mo · $544/yr
- Insurance
- −$64
- HOA
- −$551
- Vacancy / Maint / Mgmt
- −$434
- Net cashflow
- $163
Break-even live
UW: 25.0% down · 7.5% · 30yr · 1.5% tax · 5.0% vac · 8.0% maint · 8.0% mgmt
Financing live
Cash to close
- Down payment
- $38,500
- Closing costs
- $4,620
- Reserves months
- —
- Total cash needed
- —
Loan-product check · same deal, 3 products live
Conventional
25% down · 7.5% · 30yr
- Down + closing
- —
- Monthly P&I
- —
- Monthly cashflow
- —
- DSCR
- —
- Eligible?
- —
Personal DTI + credit; lowest rate.
DSCR
20% down · 8.5% · 30yr
- Down + closing
- —
- Monthly P&I
- —
- Monthly cashflow
- —
- DSCR
- —
- Eligible?
- —
No personal income docs; deal must DSCR.
Hard money
10% down · 12.0% · 12mo
- Down + closing
- —
- Monthly P&I
- —
- Monthly cashflow
- —
- DSCR
- —
- Eligible?
- —
Short-term bridge; refi at stabilization.
Rent comps 40 comps
| Address | Beds | Baths | Sqft | Rent | $/sqft | DOM | Units | Dist |
|---|---|---|---|---|---|---|---|---|
| 429 Pine Glen Ln Unit C2 Greenacres, FL | 2.0 | 1.0 | 804 | $1,650 | $2.05 | 24d | 1 | 0.05mi |
| 1204 Timberlane Cir Unit 12D Greenacres, FL | 3.0 | 2.0 | 1332 | $2,800 | $2.10 | 3d | 1 | 0.07mi |
| 443 Pine Glen Ln Unit B2 Greenacres, FL | 2.0 | 2.0 | 922 | $1,500 | $1.63 | 24d | 1 | 0.16mi |
| 417 Pine Glen Ln Unit C2 Greenacres, FL | 2.0 | 2.0 | 922 | $1,800 | $1.95 | 24d | 1 | 0.16mi |
| 417 Pine Glen Ln Unit D2 Greenacres, FL | 2.0 | 2.0 | 922 | $1,550 | $1.68 | 24d | 1 | 0.16mi |
| 407 Pine Cir Unit C1 Greenacres, FL | 2.0 | 2.0 | 922 | $1,800 | $1.95 | 24d | 1 | 0.16mi |
| 407 Pine Cir Unit B1 Greenacres, FL | 2.0 | 2.0 | 922 | $1,750 | $1.90 | 24d | 1 | 0.16mi |
| 408 Pine Glen Ln Unit C-2 Greenacres, FL | 2.0 | 1.0 | 804 | $1,600 | $1.99 | 24d | 1 | 0.18mi |
| 4838 Esedra Ct Lake Worth, FL | 1.0 | 1.0 | 804 | $1,550 | $1.93 | 24d | 2 | 0.30mi |
| 4832 Esedra Ct Lake Worth, FL | 1.0–3.0 | 1.0–2.0 | 1026 | $1,650 | $1.61 | 3d | 2 | 0.31mi |
| 4801 Esedra Ct Lake Worth, FL | 2.0 | 2.0 | 1027 | $2,075 | $2.02 | 11d | 2 | 0.31mi |
| 4801 Esedra Ct #201 Lake Worth, FL | 2.0 | 2.0 | 1005 | $2,300 | $2.29 | 24d | 1 | 0.31mi |
| 4832 Esedra Ct #203 Lake Worth, FL | 3.0 | 2.0 | 1225 | $1,800 | $1.47 | 24d | 1 | 0.32mi |
| 4535 Oak Terrace Dr Greenacres, FL | 3.0 | 2.0 | 1061 | $2,500 | $2.36 | 15d | 1 | 0.33mi |
| 4535 Oak Terrace Dr Greenacres, FL | 3.0 | 2.0 | 1061 | $2,400 | $2.26 | 12d | 1 | 0.33mi |
| 4770 Fountains Dr S #303 Lake Worth, FL | 2.0 | 2.0 | 1434 | $2,200 | $1.53 | 2d | 1 | 0.36mi |
| 4702 Fountains Dr S #207 Lake Worth, FL | 2.0 | 2.5 | 1434 | $2,600 | $1.81 | 1d | 1 | 0.39mi |
| 4702 Fountains Dr S #207 Lake Worth, FL | 2.0 | 2.5 | 1434 | $2,600 | $1.81 | 24d | 1 | 0.39mi |
| 5905 Triphammer Rd Lake Worth, FL | 2.0 | 2.0 | 1020 | $3,000 | $2.94 | 24d | 1 | 0.44mi |
| 4243 Oak Terrace Dr #4243 Greenacres, FL | 2.0 | 2.0 | 883 | $1,950 | $2.21 | 24d | 1 | 0.45mi |
| 4245 Oak Terrace Dr Greenacres, FL | 2.0 | 2.0 | 883 | $2,000 | $2.27 | 24d | 1 | 0.45mi |
| 4254 Deste Ct #305 Greenacres, FL | 1.0 | 1.0 | 716 | $1,500 | $2.09 | 24d | 1 | 0.46mi |
| 4259 Oak Terrace Dr Unit 2 Greenacres, FL | 2.0 | 2.0 | 1400 | $2,000 | $1.43 | 24d | 1 | 0.47mi |
| 4259 Oak Terrace Dr Greenacres, FL | 2.0 | 2.0 | 883 | $1,900 | $2.15 | 24d | 1 | 0.47mi |
| 4266 Deste Ct #107 Greenacres, FL | 2.0 | 2.0 | 978 | $2,100 | $2.15 | 24d | 1 | 0.48mi |
| 4657 Fountains Dr S #206 Lake Worth, FL | 1.0 | 1.0 | 882 | $1,650 | $1.87 | 12d | 1 | 0.48mi |
| 4185 Oak Terrace Dr Unit 21 Greenacres, FL | 2.0 | 2.0 | 1400 | $2,000 | $1.43 | 24d | 1 | 0.49mi |
| 4185 Oak Terrace Dr Greenacres, FL | 2.0 | 2.0 | 883 | $1,850 | $2.10 | 22d | 1 | 0.49mi |
| 104 Lake Pine Cir Unit A1 Greenacres, FL | 2.0 | 2.0 | 937 | $2,050 | $2.19 | 24d | 1 | 0.49mi |
| 4221 Oak Terrace Dr Greenacres, FL | 2.0 | 2.0 | 883 | $1,900 | $2.15 | 24d | 1 | 0.49mi |
| 102 Lake Pine Cir Unit A2 Greenacres, FL | 2.0 | 1.0 | 937 | $1,500 | $1.60 | 24d | 1 | 0.53mi |
| 4121 Oak Terrace Dr Greenacres, FL | 2.0 | 2.0 | 883 | $1,950 | $2.21 | 24d | 1 | 0.54mi |
| 4101 Oak Terrace Dr Greenacres, FL | 2.0 | 2.0 | 883 | $1,850 | $2.10 | 11d | 1 | 0.55mi |
| 4169 Oak Terrace Dr Unit 41 Greenacres, FL | 2.0 | 2.0 | 1500 | $2,000 | $1.33 | 24d | 1 | 0.55mi |
| 4242 Deste Ct Unit 208 Greenacres, FL | 2.0 | 2.0 | 978 | $2,500 | $2.56 | 24d | 1 | 0.56mi |
| 121 Lake Pine Cir Unit A2 Greenacres, FL | 2.0 | 1.0 | 818 | $1,600 | $1.96 | 24d | 1 | 0.58mi |
| 105 Lake Pine Cir Unit B2 Greenacres, FL | 2.0 | 2.0 | 937 | $2,000 | $2.13 | 24d | 1 | 0.58mi |
| 6615 Waterfront Xing Lake Worth, FL | 1.0–3.0 | 1.0–2.0 | 1087 | $2,864 | $2.63 | 1d | 22 | 0.59mi |
| 5862 Triphammer Rd Lake Worth, FL | 3.0 | 2.0 | 1130 | $2,850 | $2.52 | 24d | 1 | 0.60mi |
| 4236 Deste Ct #108 Greenacres, FL | 1.0 | 1.0 | 716 | $1,800 | $2.51 | 17d | 1 | 0.62mi |
HOA detail condo
- Monthly dues
- $551 · $6,612/yr
- Assessments
- None detected in remarks — confirm with the listing agent.
Listing history 9 events
-
2026-06-18remarks 691-char remark
-
2026-06-18days on market $154,000 Active 10 DOM
-
2026-06-18price $154,000 Active 9 DOM
-
2026-06-17days on market $159,900 Active 9 DOM
-
2026-06-16days on market $159,900 Active 8 DOM
-
2026-06-15days on market $159,900 Active 7 DOM
-
2026-06-13days on market $159,900 Active 5 DOM
-
2026-06-09remarks 683-char remark
-
2026-06-09$159,900 Active 1 DOM
ⓘ Source: listings_history table (triggers on properties + properties_extension) + one-shot
backfill from property_details.listing_events for pre-trigger history.
Tax reassessment forecast FL · Resets to sale price
- Current annual tax
- $544 · $45/mo
- Projected year-2 tax
- $1,278 · $107/mo
- Expected delta
- +$735/yr (+$61/mo · 135.1%)
ⓘ Screening estimate from a state-policy table — verify with the county assessor before closing.
Climate risk First Street
- Flood 1/10 Low FEMA zone X (unshaded) · 0% chance over 30 yrs
- Wildfire 1/10 Low
- Heat 10/10 Extreme 7 d/yr ≥106°F today · 28 d/yr by 30 yrs out
- Wind 10/10 Extreme 99% chance of damaging wind over 30 yrs
- Air quality 2/10 Low 0 unhealthy d/yr today · 2 by 30 yrs out
Nearby sold comps map
Loading sold comps map…
Walkable amenities ~0.75 mi
Loading nearby amenities…
Taxation est. · year 1
- Rental income
- $24,778
- − Mortgage interest
- −$8,626
- − Property taxes
- −$544
- − Insurance
- −$770
- − Repairs & maintenance
- −$1,982
- − Management
- −$1,982
- − HOA
- −$6,612
- − Depreciation
- −$4,480
- Taxable loss
- −$219
- Est. tax savings @ 24.0%
- +$53
- After-tax cash flow
- $2,010/yr
For passive investors: Depreciation is non-cash, so a rental often shows a tax loss while cash-flowing — sheltering income. Rental losses are passive: they offset passive income freely, and up to $25,000/yr can offset ordinary (W-2) income if you actively participate and your MAGI is under $100k (phasing out to $0 by $150k); unused losses carry forward. On sale, claimed depreciation is recaptured at up to 25%, and gains may owe capital-gains tax (a 1031 exchange can defer both). Figures are a year-1 estimate at your 24.0% rate — not tax advice; consult a CPA.
Schools (NCES district)
- District
- Palm Beach
- NCES district ID
- 1201500
- Math proficiency
- 46% ▼ -16.00%
- Reading proficiency
- 53% ▼ -4.00%
- Median HH income
- $53,943
- Composite
- 42.72/100
- National rank
- #3160
- State rank
- #34 of 73 in FL
Livability — Greenacres
- Score
- 69/100
- State rank
- #490
- US rank
- #9008
Category grades
Schools grade is shown separately in the Schools card above.
Census & demographics
- Census place
- Greenacres, FL
- County
- Palm Beach County · 1,438,312 people
- City population
- 65,478
- Metro
- Miami-Fort Lauderdale-Pompano Beach, FL
- Population (ZIP)
- 65,478
- Household income
- $73,865
- Rent vs Own
- Severe rent burden
- 1466.0
Population outlook (Palm Beach County) Hauer SSP2
- Today (2025)
- 1,637,487 people
- By 2030
- 1,743,255 · +6.5%
- By 2040
- 1,948,712 · +19.0%
- By 2050
- 2,132,979 · +30.3%
- By 2075
- 2,530,027 · +54.5%
- By 2100
- 2,706,979 · +65.3%
Race, ethnicity, and origin ACS 2023
- Neighborhood character
- Diverse neighborhood (Simpson 0.70)
- Race & ethnicity
- Hispanic / Latino 38% Black 29% White 27% Two or more races 11% Asian 4%
- Hispanic origin (detail)
- Mexican 8% Puerto Rican 6% Cuban 5% Dominican 2%
- Common ancestry
- Hispanic 15% Romanian 1% Slovak 1%
- Foreign-born
- 39% · Canada, Jamaica, China
- Languages at home
- 45% English-only · Spanish 32% French/Haitian/Cajun 17% Other Indo-European 2%
Political lean MEDSL · Palm Beach
- 2024 margin
- Toss-up / Even · D 50.0% · R 49.2%
- 2008→2024 swing
- -22.1pp toward R · 2008: 22.9pp · 2024: 0.8pp
- All cycles
- 2024: D+0.8 2020: D+12.8 2016: D+15.3 2012: D+17.0 2008: D+22.9
Not yet ingested
- Civics
- —
Market trends
- HPI YoY
- ▼ -175.33%
- Current HPI
- 392.055
- Rent YoY
- ▲ 1.33%
- Metro
- Miami-Fort Lauderdale-Pompano Beach, FL
- State GDP YoY
- ▲ 3.28%
- F500 in state
- 36
Industry mix (Fortune 500 HQ in FL)
| Industry | F500 HQs | Revenue |
|---|---|---|
| Industrial Technology | 2 | $29B |
|
||
| Insurance | 2 | $17B |
|
||
| Retail | 1 | $60B |
|
||
| Technology Distribution | 1 | $58B |
|
||
| Homebuilding | 1 | $35B |
|
||
| Technology Manufacturing | 1 | $35B |
|
||
Price history
+106.3% since first listed5 events — show timeline
- 2026-06-08 Listed $159,900 Beaches MLS
- 2004-02-17 Sold (Public Records) $74,900 Public Records
- 2004-02-13 Sold (MLS) $74,900 Beaches MLS
- 2004-01-09 Listing Removed — Beaches MLS
- 2003-08-10 Listed $77,500 Beaches MLS
Property tax history
+3.4%/yrLatest (2025): $544 · +5.9% YoY. Source: county tax records.
Cash-flow waterfall
monthlySold comps — $/sqft
last 12 mo · ≤1 miLoading sold comps…