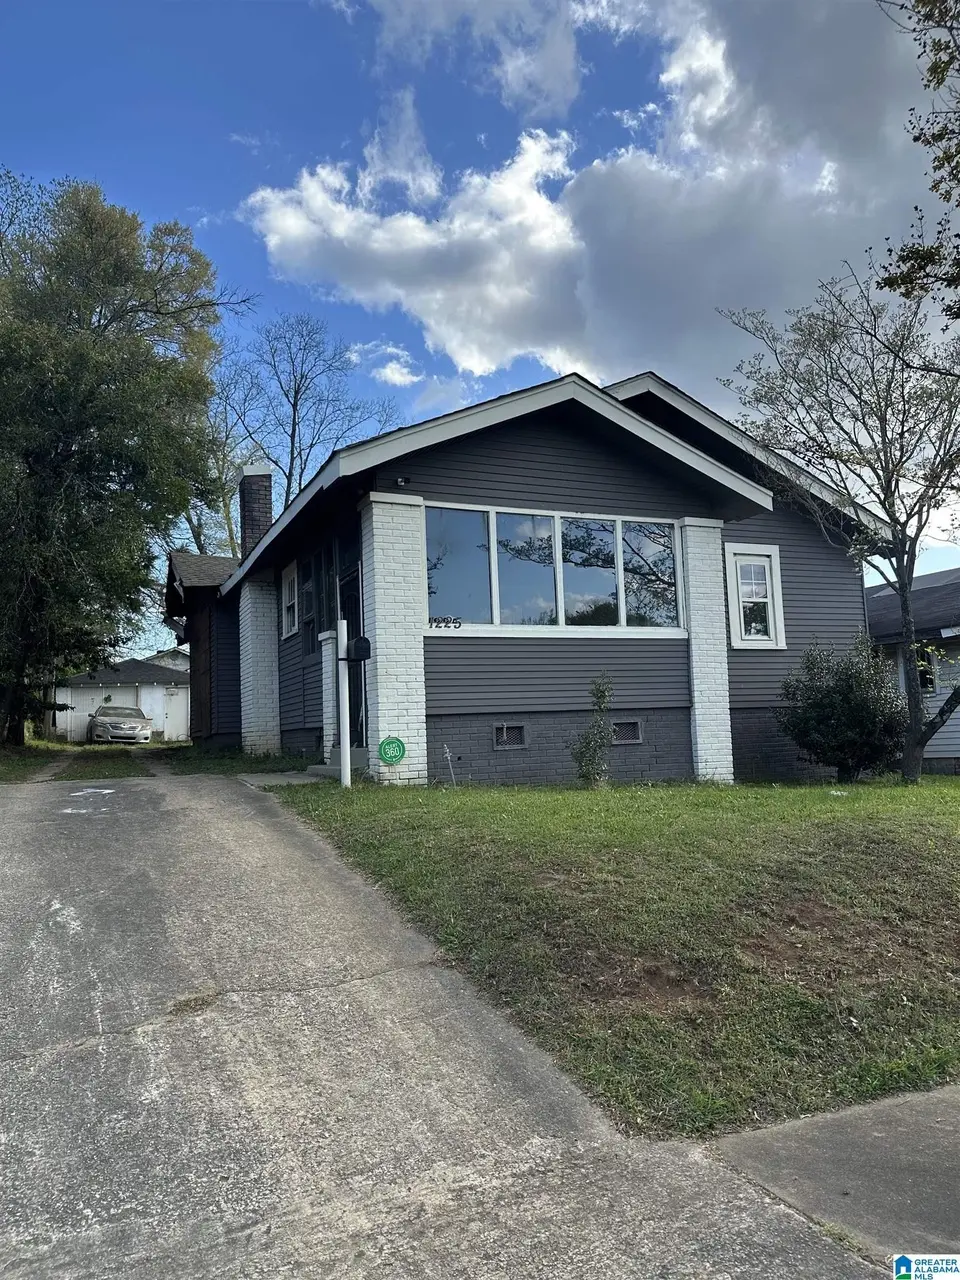
1225 Park Ave · Tarrant, AL
Flood risk 1/10 · Minimal
- FEMA flood zone
- X (unshaded)
- Chance of flooding over 30 yrs
- 0.0%
- Est. flood insurance / yr
- $507 – $1,088
Fire risk 4/10 · Minor
- Est. fire insurance / yr
- $916 – $1,700
Heat risk 6/10 · Moderate
- Hot days now (above 106°F)
- 7 days/yr
- Hot days in 30 yrs
- 21 days/yr
Wind risk 6/10 · Moderate
- Chance of severe wind over 30 yrs
- 27.0%
Air-quality risk 5/10 · Moderate
- Unhealthy air days now
- 9 days/yr
- Unhealthy air days in 30 yrs
- 10 days/yr
Risk factors via First Street. Map © Google.
Why this score? — see what drove the D grade
The composite is a weighted blend of 9 inputs, each scored 0–100. Each bar is that input's sub-score; the figure is the points it added to the 100-point composite (weight × sub-score).
- Cash flow +15.0/30.0
- ARV discount +7.5/15.0
- 1% rule +5.0/10.0
- DSCR +5.0/10.0
- Rent growth +3.4/5.0
- Livability +2.6/5.0
- Condition / age +2.5/5.0
- Schools +0.8/10.0
- Appreciation +0.0/10.0
$23,000
🖨 Deal sheet 📄 Offer letter ✓ Due diligence
Listing remarks MLS
This home has 3 bed 2bath and farm living within a 10 minute proximity to downtown Birmingham. Quiet Neighborhood. NEW ROOF! and new HVAC Please call your agent to setup your showing today!
Key facts
- 6,098 sq ft lot
- Built 1930
- Listed 22 days
Neighborhood map
What this means for you Summary
Snapshot
- This is a 3-bed/2.0-bath single-family listed at $23k.
Deal economics
- At list price, monthly cash flow is $782 ($9k/yr) — positive.
- The deal already cash-flows at list — no discount required.
- Meets the 1% rule at list price ($1k rent vs $23k).
- Recommended offer: $23k (1.5% below list) — sets the bar for market timing.
- Cap rate 47.1% vs local median 11.0% in Tarrant — top-decile yield for the area; either an underpriced asset or a hidden risk that comps aren't pricing in. Stress-test before assuming the spread holds.
Location & tenants
- Location reads 51/100 on livability (#507 in AL) — a working-class tenant base; expect higher turnover. Strengths: cost of living A+, housing A+; Watch: crime C-, amenities F, commute F.
- Tarrant City (suburban): math 4% / reading 17% proficiency, ranked #121 of 129 in AL (top 94%) — low school quality limits family demand, transient renter base, plan for 1-2y turnover; 89% free/reduced lunch — lower-income household profile, screen leases tightly.
- Zoned schools: Tarrant Elementary School (310 students, 85% FRL); Tarrant High School (math 3% / reading 16%, grade F, #258 of 305 statewide, top 85%, 559 students, 84% FRL) — zoned schools at 85% FRL track the district average.
- Market conditions: Rents rising (+3.6%/yr); 94 active listings in the ZIP; 40 comparable units currently listed for rent nearby; rentals lingering (median 44d on market — plan ~5-8 weeks vacancy on turnover, expect pricing pressure); 55% of comp listings sitting > 30 days — soft ceiling on asking rent; lower-income renter base — watch delinquency; 2,114 units permitted in Jefferson County in 2024 (556 in 5+ unit buildings).
- This rent runs 35% of the median local income ($40k/yr) — at the standard rent-burdened threshold; future hikes will face affordability resistance.
Forward outlook
- Local home prices are declining (-3.0%/yr); year-one equity from $159 of loan paydown is wiped out by about $690 of value loss. Plan a longer hold.
- Jefferson County population projected to shrink 4% by 2050 — rents likely to lag national; underwrite the cash flow, not the appreciation.
- At projected returns (-3.0% appreciation + 3.6% rent growth), your $6k cash investment doubles in ~1 year — after that, you're playing with house money.
Negotiation context
- It's been on market 22 days — a 2% lower offer ($23k) is reasonable based on typical stale-listing flexibility.
- 5 sale attempts since 5y ago; this cycle's ask has dropped $5k (18%) from the opening price — seller is motivated, your offer sets the floor, not the list.
Risks & watch-outs
- Watch-outs: built in 1930 — expect roof / HVAC / electrical / plumbing capex.
- Climate carrying-cost: major wind risk, 27% chance of damaging wind over 30y; extreme-heat days projected 7→21/yr by 2055 (HVAC capex compounding) — expect insurance premiums to compound above CPI over the hold.
Questions for the listing agent
- Built in 1930 — when were the roof, HVAC, electrical panel, plumbing, and water heater last replaced?
- Is there a deadline driving the sale (1031 exchange, divorce, estate, relocation)? That informs how much negotiation room exists.
- Schools are F-rated, which usually means shorter tenancies and higher turnover. Who's the typical renter profile here, and what's been the actual vacancy rate?
- The area grade is low — what's the realistic commute time and amenity access for the typical tenant pool here? Any planned neighborhood developments (good or bad) we should know about?
- What's the average days-on-market for RENTAL listings here right now (not sales)? A rising rental-DOM trend means longer vacancies and softer asking-rent achievability than the comps imply.
- What's the recent tenant-quality profile in this submarket — average credit score on applications, eviction rate, late-payment / NSF rate, and stable-employment percentage? A property-management company in the area should have these aggregated.
- How much new for-sale + rental construction is in the pipeline within 1–3 miles? Heavy new supply typically softens prices + rents 12–24 months out; constrained supply supports both.
Investment metrics
- 1% rule
- 5.10% ✓
- Cap rate
- 47.12%
- Cash-on-cash
- 145.80%
- DSCR
- 7.49
- GRM
- 1.6
CMA / ARV
- ARV (on-the-fly)
- $92,592
- Comps found
- 12
Show comp detail 12 sales within ~0.75 mi
| Address | Dist | Beds/Ba | Sqft | Sold | Price | $/sf | Match |
|---|---|---|---|---|---|---|---|
| 732 Fulton Ave | 0.25mi | 4/2.0 (+1) | 1,320 (+3%) | 4mo | $95,000 | $72 | 76 |
| 4318 49th Ct N | 0.42mi | 3/2.0 | 1,266 (-2%) | 11mo | $95,800 | $76 | 69 |
| 1269 Elm Ave | 0.28mi | 4/1.0 (+1) | 1,308 (+2%) | 10mo | $125,000 | $96 | 67 |
| 1360 Prosch Ave | 0.38mi | 3/2.0 | 1,344 (+4%) | 11mo | $84,000 | $63 | 65 |
| 1249 Park Ave | 0.06mi | 3/2.0 | 1,456 (+13%) | 12mo | $108,000 | $74 | 65 |
| 1104 Jackson Blvd | 0.19mi | 3/2.0 | 1,128 (-12%) | 13mo | $116,000 | $103 | 60 |
| 1112 Elm Ave | 0.36mi | 2/2.0 (-1) | 1,219 (-5%) | 13mo | $60,000 | $49 | 59 |
| 725 Fulton Ave | 0.27mi | 3/1.0 | 1,110 (-14%) | 5mo | $80,050 | $72 | 56 |
| 4338 49th Ct | 0.48mi | 3/1.0 | 1,205 (-6%) | 10mo | $87,500 | $73 | 55 |
| 4208 50th Ave N | 0.28mi | 3/1.0 | 1,104 (-14%) | 7mo | $67,500 | $61 | 53 |
| 1433 Ford Ave | 0.72mi | 3/2.0 | 1,372 (+7%) | 10mo | $90,000 | $66 | 48 |
| 4421 43rd St N | 0.74mi | 3/1.0 | 1,200 (-7%) | 4mo | $42,000 | $35 | 47 |
Match score weights: distance 35% · size 25% · config 20% · recency 20%. Top-matched comps best support the ARV.
Projected returns pro-forma
-3.0% appreciation · 3.58% rent growth · sell at horizon
- IRR
- —
- Equity multiple
- 8.27×
- Total profit
- $46,806
- Equity at exit
- $3,429
- IRR
- —
- Equity multiple
- 17.74×
- Total profit
- $107,822
- Equity at exit
- $1,989
Cash invested: $6,440 (down + closing). Projections, not guarantees.
Landlord ↔ Tenant lean methodology
- Overall (STATE)
- 90 Strongly Landlord-Friendly
- State Alabama
- 90 Strongly Landlord-Friendly · R+15
- County
- — inherits STATE
- City
- — inherits STATE
ZIP-level market 35217
- Rents YoY
- 3.6%
- Active inventory
- 94
- Price-to-rent
- 1.6×
Monthly cashflow live
- Estimated rent
- $1,173 high interval (Pro) →
- Mortgage (P&I)
- −$121
- Tax from tax record
- −$14 /mo · $166/yr
- Insurance
- −$10
- HOA
- −$0
- Vacancy / Maint / Mgmt
- −$246
- Net cashflow
- $782
Break-even live
UW: 25.0% down · 7.5% · 30yr · 1.5% tax · 5.0% vac · 8.0% maint · 8.0% mgmt
Financing live
Cash to close
- Down payment
- $5,750
- Closing costs
- $690
- Reserves months
- —
- Total cash needed
- —
Loan-product check · same deal, 3 products live
Conventional
25% down · 7.5% · 30yr
- Down + closing
- —
- Monthly P&I
- —
- Monthly cashflow
- —
- DSCR
- —
- Eligible?
- —
Personal DTI + credit; lowest rate.
DSCR
20% down · 8.5% · 30yr
- Down + closing
- —
- Monthly P&I
- —
- Monthly cashflow
- —
- DSCR
- —
- Eligible?
- —
No personal income docs; deal must DSCR.
Hard money
10% down · 12.0% · 12mo
- Down + closing
- —
- Monthly P&I
- —
- Monthly cashflow
- —
- DSCR
- —
- Eligible?
- —
Short-term bridge; refi at stabilization.
Rent comps 40 comps
| Address | Beds | Baths | Sqft | Rent | $/sqft | DOM | Units | Dist |
|---|---|---|---|---|---|---|---|---|
| 1043 Jackson Blvd Birmingham, AL | 4.0 | 2.0 | 1300 | $1,095 | $0.84 | 14d | 1 | 0.07mi |
| 1237 Elm Ave Birmingham, AL | 2.0 | 1.5 | 1312 | $1,150 | $0.88 | 43d | 1 | 0.22mi |
| 1120 Hall St Birmingham, AL | 2.0 | 1.0 | 887 | $775 | $0.87 | 43d | 1 | 0.23mi |
| 1116 Hall St Birmingham, AL | 2.0 | 1.0 | 887 | $775 | $0.87 | 43d | 1 | 0.24mi |
| 1108 Hall St Birmingham, AL | 2.0 | 1.0 | 1680 | $850 | $0.51 | 43d | 1 | 0.25mi |
| 732 Fulton Ave Birmingham, AL | 4.0 | 2.0 | 1320 | $1,450 | $1.10 | 43d | 1 | 0.28mi |
| 4208 50th Ave N Birmingham, AL | 3.0 | 1.0 | 1104 | $1,200 | $1.09 | 43d | 1 | 0.31mi |
| 4212 50th Ave N Birmingham, AL | 4.0 | 2.0 | 1517 | $1,595 | $1.05 | 1d | 1 | 0.31mi |
| 5015 42nd Pl N Birmingham, AL | 3.0 | 2.0 | 1500 | $1,200 | $0.80 | 43d | 1 | 0.32mi |
| 5025 43rd Pl N Birmingham, AL | 4.0 | 2.0 | 1017 | $1,300 | $1.28 | 43d | 1 | 0.41mi |
| 619 Bell Ave Birmingham, AL | 3.0 | 1.0 | 1550 | $1,075 | $0.69 | 43d | 1 | 0.43mi |
| 4329 Harmon St Birmingham, AL | 3.0 | 1.0 | 1227 | $950 | $0.77 | 3d | 1 | 0.45mi |
| 4329 Harmon St Birmingham, AL | 3.0 | 1.0 | 1227 | $950 | $0.77 | 43d | 1 | 0.45mi |
| 1316 Spring St Birmingham, AL | 2.0 | 1.0 | 920 | $1,195 | $1.30 | 3d | 1 | 0.48mi |
| 4329 Pulaski St Birmingham, AL | 3.0 | 2.0 | 1240 | $1,353 | $1.09 | 23d | 1 | 0.50mi |
| 4344 Pulaski St Birmingham, AL | 3.0 | 1.0 | 1268 | $1,050 | $0.83 | 43d | 1 | 0.51mi |
| 1249 Waverly St Birmingham, AL | 3.0 | 1.0 | 1260 | $1,000 | $0.79 | 43d | 1 | 0.51mi |
| 4925 43rd Way N Birmingham, AL | 3.0 | 2.0 | 1232 | $1,461 | $1.19 | 1d | 1 | 0.54mi |
| 1434 Thomason Ave Birmingham, AL | 4.0 | 2.0 | 1644 | $1,100 | $0.67 | 43d | 1 | 0.55mi |
| 1045 Waverly St Birmingham, AL | 3.0 | 1.0 | 1014 | $1,000 | $0.99 | 43d | 1 | 0.55mi |
| 1401 Wharton Ave Birmingham, AL | 2.0 | 1.0 | 1104 | $950 | $0.86 | 19d | 1 | 0.56mi |
| 1439 Sloan Ave Birmingham, AL | 3.0 | 1.0 | 936 | $900 | $0.96 | 43d | 1 | 0.58mi |
| 4301 Greenwood St Birmingham, AL | 3.0 | 1.0 | 1140 | $1,025 | $0.90 | 2d | 1 | 0.59mi |
| 1303 Main St Birmingham, AL | 4.0 | 2.0 | 1432 | $1,300 | $0.91 | 43d | 1 | 0.73mi |
| 1225 Elizabeth Ave Birmingham, AL | 3.0 | 1.5 | 1697 | $1,100 | $0.65 | 19d | 1 | 0.75mi |
| 4418 43rd St N Birmingham, AL | 3.0 | 1.0 | 1710 | $925 | $0.54 | 23d | 1 | 0.76mi |
| 1076 Green St Birmingham, AL | 3.0 | 1.0 | 1172 | $1,050 | $0.90 | 15d | 1 | 0.79mi |
| 3823 43rd Ave N Birmingham, AL | 3.0 | 2.0 | 1500 | $1,200 | $0.80 | 43d | 1 | 0.81mi |
| 3823 43rd Ave N Birmingham, AL | 3.0 | 2.0 | 1500 | $1,200 | $0.80 | 23d | 1 | 0.81mi |
| 4316 Gadsden St Birmingham, AL | 2.0 | 1.0 | 1048 | $1,100 | $1.05 | 3d | 1 | 0.82mi |
| 4217 43rd Ave N Birmingham, AL | 3.0 | 1.0 | 1140 | $1,200 | $1.05 | 3d | 1 | 0.86mi |
| 4400 43rd St N Birmingham, AL | 3.0 | 1.0 | 1152 | $850 | $0.74 | 14d | 1 | 0.92mi |
| 4400 43rd St N Birmingham, AL | 3.0 | 1.0 | 1152 | $850 | $0.74 | 43d | 1 | 0.92mi |
| 1816 Damon Cir Birmingham, AL | 3.0 | 1.0 | 1401 | $1,153 | $0.82 | 15d | 1 | 0.92mi |
| 1731 Mountain Dr Birmingham, AL | 3.0 | 1.0 | 1160 | $975 | $0.84 | 43d | 1 | 0.96mi |
| 4028 40th Ave N Birmingham, AL | 3.0 | 1.0 | 1186 | $950 | $0.80 | 43d | 1 | 0.99mi |
| 4220 40th Ct N Birmingham, AL | 3.0 | 1.0 | 948 | $1,200 | $1.27 | 43d | 1 | 0.99mi |
| 3708 42nd Ave N Birmingham, AL | 3.0 | 1.0 | 876 | $950 | $1.08 | 43d | 1 | 1.04mi |
| 4231 40th Ave N Birmingham, AL | 3.0 | 1.0 | 1272 | $850 | $0.67 | 19d | 1 | 1.08mi |
| 4236 39th Ave N Birmingham, AL | 3.0 | 2.0 | 1000 | $1,195 | $1.20 | 23d | 1 | 1.13mi |
Listing history 16 events
-
2026-04-22status Pending
-
2026-04-15price $23,000
-
2026-03-31$28,000 Active
-
2022-05-03soldstatus $125,000
-
2022-05-02soldstatus $125,000 Sold 192-char remark
Show marketing remark (192 chars)
This home has 3 bed 2bath and farm living within a 10 minute proximity to downtown Birmingham. Quiet Neighborhood. NEW ROOF! and new HVAC Please call your agent to setup your showing today!
-
2022-03-31status Pending 192-char remark
Show marketing remark (192 chars)
This home has 3 bed 2bath and farm living within a 10 minute proximity to downtown Birmingham. Quiet Neighborhood. NEW ROOF! and new HVAC Please call your agent to setup your showing today!
-
2022-03-16price $125,500 192-char remark
Show marketing remark (192 chars)
This home has 3 bed 2bath and farm living within a 10 minute proximity to downtown Birmingham. Quiet Neighborhood. NEW ROOF! and new HVAC Please call your agent to setup your showing today!
-
2021-12-20status Active 192-char remark
Show marketing remark (192 chars)
This home has 3 bed 2bath and farm living within a 10 minute proximity to downtown Birmingham. Quiet Neighborhood. NEW ROOF! and new HVAC Please call your agent to setup your showing today!
-
2021-12-10historical 192-char remark
Show marketing remark (192 chars)
This home has 3 bed 2bath and farm living within a 10 minute proximity to downtown Birmingham. Quiet Neighborhood. NEW ROOF! and new HVAC Please call your agent to setup your showing today!
-
2021-11-25status Active 192-char remark
Show marketing remark (192 chars)
This home has 3 bed 2bath and farm living within a 10 minute proximity to downtown Birmingham. Quiet Neighborhood. NEW ROOF! and new HVAC Please call your agent to setup your showing today!
-
2021-11-09historical 192-char remark
Show marketing remark (192 chars)
This home has 3 bed 2bath and farm living within a 10 minute proximity to downtown Birmingham. Quiet Neighborhood. NEW ROOF! and new HVAC Please call your agent to setup your showing today!
-
2021-10-19$139,900 Active 192-char remark
Show marketing remark (192 chars)
This home has 3 bed 2bath and farm living within a 10 minute proximity to downtown Birmingham. Quiet Neighborhood. NEW ROOF! and new HVAC Please call your agent to setup your showing today!
-
2021-08-03soldstatus $35,000 Sold 99-char remark
Show marketing remark (99 chars)
Excellent investment opportunity. 3 Bed 2 bath home needs some work but not much. Sold -AS-IS House
-
2021-07-22historical 99-char remark
Show marketing remark (99 chars)
Excellent investment opportunity. 3 Bed 2 bath home needs some work but not much. Sold -AS-IS House
-
2021-07-08$39,900 Active 99-char remark
Show marketing remark (99 chars)
Excellent investment opportunity. 3 Bed 2 bath home needs some work but not much. Sold -AS-IS House
-
1998-06-02soldstatus $55,000
ⓘ Source: listings_history table (triggers on properties + properties_extension) + one-shot
backfill from property_details.listing_events for pre-trigger history.
Tax reassessment forecast AL · Resets to sale price
- Current annual tax
- $166 · $14/mo
- Projected year-2 tax
- $166 · $14/mo
- Expected delta
- $0/yr ($0/mo · 0.0%)
ⓘ Screening estimate from a state-policy table — verify with the county assessor before closing.
Climate risk First Street
- Flood 1/10 Low FEMA zone X (unshaded) · 0% chance over 30 yrs
- Wildfire 4/10 Moderate
- Heat 6/10 Major 7 d/yr ≥106°F today · 21 d/yr by 30 yrs out
- Wind 6/10 Major 27% chance of damaging wind over 30 yrs
- Air quality 5/10 Major 9 unhealthy d/yr today · 10 by 30 yrs out
Nearby sold comps map
Loading sold comps map…
Walkable amenities ~0.75 mi
Loading nearby amenities…
Taxation est. · year 1
- Rental income
- $14,073
- − Mortgage interest
- −$1,288
- − Property taxes
- −$166
- − Insurance
- −$115
- − Repairs & maintenance
- −$1,126
- − Management
- −$1,126
- − Depreciation
- −$669
- Taxable income
- $9,583
- Est. tax owed @ 24.0%
- −$2,300
- After-tax cash flow
- $7,090/yr
For passive investors: Depreciation is non-cash, so a rental often shows a tax loss while cash-flowing — sheltering income. Rental losses are passive: they offset passive income freely, and up to $25,000/yr can offset ordinary (W-2) income if you actively participate and your MAGI is under $100k (phasing out to $0 by $150k); unused losses carry forward. On sale, claimed depreciation is recaptured at up to 25%, and gains may owe capital-gains tax (a 1031 exchange can defer both). Figures are a year-1 estimate at your 24.0% rate — not tax advice; consult a CPA.
Schools (NCES district)
- District
- Tarrant City
- NCES district ID
- 0103270
- Math proficiency
- 4% ▼ -14.00%
- Reading proficiency
- 17% ▼ -2.00%
- Median HH income
- $29,256
- Composite
- 8.0/100
- National rank
- #9924
- State rank
- #121 of 129 in AL
Livability — Tarrant
- Score
- 51/100
- State rank
- #507
- US rank
- #25136
Category grades
Schools grade is shown separately in the Schools card above.
Census & demographics
- Census place
- Tarrant, AL
- County
- Jefferson County · 527,445 people
- City population
- 12,240
- Metro
- Birmingham-Hoover, AL
- Population (ZIP)
- 12,240
- Household income
- $40,486
- Rent vs Own
- Severe rent burden
- 594.0
Population outlook (Jefferson County) Hauer SSP2
- Today (2025)
- 669,185 people
- By 2030
- 669,694 · +0.1%
- By 2040
- 661,388 · -1.2%
- By 2050
- 643,086 · -3.9%
- By 2075
- 577,267 · -13.7%
- By 2100
- 474,758 · -29.1%
Race, ethnicity, and origin ACS 2023
- Neighborhood character
- Diverse neighborhood (Simpson 0.58)
- Race & ethnicity
- Black 57% White 27% Hispanic / Latino 14% Two or more races 6%
- Hispanic origin (detail)
- Mexican 9%
- Common ancestry
- Slovak 3% Italian 1%
- Foreign-born
- 7% · Canada, Guatemala
- Languages at home
- 86% English-only · Spanish 13%
Political lean MEDSL · Jefferson
- 2024 margin
- D (+10.4) · D 54.6% · R 44.2% · Other 1.2%
- 2008→2024 swing
- +5.4pp toward D · 2008: 5.1pp · 2024: 10.4pp
- All cycles
- 2024: D+10.4 2020: D+13.2 2016: D+7.2 2012: D+6.0 2008: D+5.1
Not yet ingested
- Civics
- —
Market trends
- HPI YoY
- ▼ -74.54%
- Current HPI
- 117.416
- Rent YoY
- ▲ 3.58%
- Metro
- Birmingham-Hoover, AL
- State GDP YoY
- ▲ 2.94%
- F500 in state
- 4
Industry mix (Fortune 500 HQ in AL)
| Industry | F500 HQs | Revenue |
|---|---|---|
| Financial Services | 1 | $8B |
|
||
| Healthcare | 1 | $5B |
|
||
Price history
-58.2% since first listed16 events — show timeline
- 2026-04-22 Pending — Greater Alabama MLS
- 2026-04-15 Price Changed $23,000 Greater Alabama MLS
- 2026-03-31 Listed $28,000 Greater Alabama MLS
- 2022-05-03 Sold (Public Records) $125,000 Public Records
- 2022-05-02 Sold (MLS) $125,000 Greater Alabama MLS
- 2022-03-31 Pending — Greater Alabama MLS
- 2022-03-16 Price Changed $125,500 Greater Alabama MLS
- 2021-12-20 Relisted — Greater Alabama MLS
- 2021-12-10 Delisted — Greater Alabama MLS
- 2021-11-25 Relisted — Greater Alabama MLS
- 2021-11-09 Delisted — Greater Alabama MLS
- 2021-10-19 Listed $139,900 Greater Alabama MLS
- 2021-08-03 Sold (MLS) $35,000 Greater Alabama MLS
- 2021-07-22 Delisted — Greater Alabama MLS
- 2021-07-08 Listed $39,900 Greater Alabama MLS
- 1998-06-02 Sold (Public Records) $55,000 Public Records
Property tax history
-7.6%/yrLatest (2025): $166 · -73.9% YoY. Source: county tax records.
Cash-flow waterfall
monthlySold comps — $/sqft
last 12 mo · ≤1 miLoading sold comps…