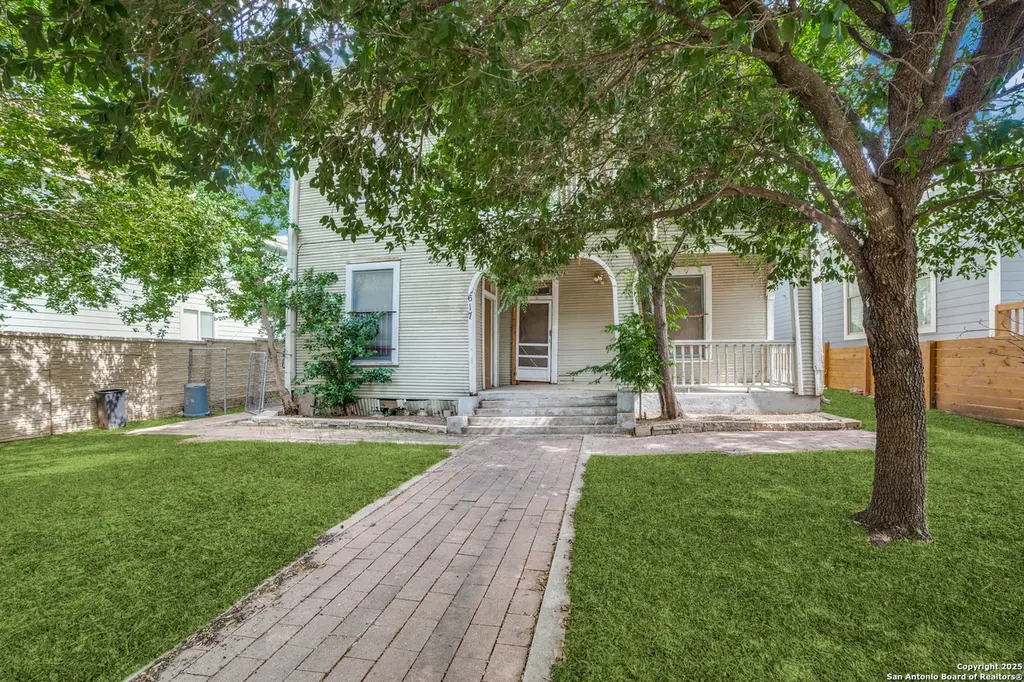
617 Dawson · San Antonio, TX
Flood risk 1/10 · Minimal
- FEMA flood zone
- X (unshaded)
- Chance of flooding over 30 yrs
- 0.0%
- Est. flood insurance / yr
- $507 – $1,088
Fire risk 1/10 · Minimal
- Est. fire insurance / yr
- $1,222 – $2,270
Heat risk 8/10 · Major
- Hot days now (above 108°F)
- 7 days/yr
- Hot days in 30 yrs
- 22 days/yr
Wind risk 8/10 · Major
- Chance of severe wind over 30 yrs
- 80.0%
Air-quality risk 2/10 · Minimal
- Unhealthy air days now
- 1 days/yr
- Unhealthy air days in 30 yrs
- 2 days/yr
Risk factors via First Street. Map © Google.
Why this score? — see what drove the C- grade
The composite is a weighted blend of 9 inputs, each scored 0–100. Each bar is that input's sub-score; the figure is the points it added to the 100-point composite (weight × sub-score).
- ARV discount +15.0/15.0
- Appreciation +10.0/10.0
- Cash flow +8.4/30.0
- Rent growth +4.5/5.0
- 1% rule +4.2/10.0
- Livability +4.0/5.0
- Condition / age +2.5/5.0
- DSCR +2.3/10.0
- Schools +1.4/10.0
$250,000
🖨 Deal sheet 📄 Offer letter ✓ Due diligence
Listing remarks MLS
Multi-family opportunity in historic Dignowity Hill-just one block from Dignowity/Lockwood Park. Zoned RM-4, this property is currently configured as a 4-plex (two units up, two down) but has undergone previous renovations that created a communal kitchen setup, making it less traditionally laid out as private residences. It's in poor condition and will require a full renovation, but it offers strong potential for those looking to restore or reimagine a classic structure in one of San Antonio's most established neighborhoods. Easy access via Booker Alley creates more flexible development opportunities. Just around the corner from Dignowity/Lockwood Park with a basketball pavilion and walking trails, 0.6 miles to Fairchild Park with tennis and pickleball courts, a pool, and a playground, and 0.5 miles to the brand-new Dawson Park with a skate park and more.
Key facts
- Basketball pavilion
- Zoned rm-4
- Walking trails
Tags
Neighborhood map
What this means for you Summary
Snapshot
- This is a 3-bed/2.0-bath single-family listed at $250k.
Deal economics
- At list price, monthly cash flow is $-222 ($-3k/yr) — negative.
- To cash-flow at today's rent, offer at most $211k (15.7% below list).
- To meet the 1% rule (rent ≥ 1% of price), the offer needs to be $229k (8.2% below list).
- Recommended offer: $211k (15.7% below list) — sets the bar for cash-flow.
- Cap rate 5.2% vs local median 3.8% in San Antonio — top-decile yield for the area; either an underpriced asset or a hidden risk that comps aren't pricing in. Stress-test before assuming the spread holds.
Location & tenants
- Location reads 80/100 on livability (#31 in TX, #1,616 nationally) — a professional / high-income tenant draw. Strengths: amenities A+, commute A+, cost of living A+; Watch: schools C-, crime F.
- San Antonio ISD (urban): math 12% / reading 22% proficiency, ranked #805 of 826 in TX (top 98%) — low school quality limits family demand, transient renter base, plan for 1-2y turnover; 80% free/reduced lunch — lower-income household profile, screen leases tightly.
- Market conditions: Rents rising fast (+8.2%/yr); 196 active listings in the ZIP; 40 comparable units currently listed for rent nearby; rentals at typical pace (median 24d on market — plan ~3-4 weeks tenant-placement turnaround); 40% of comp listings sitting > 30 days — soft ceiling on asking rent; 8,308 units permitted in Bexar County in 2024 (2,506 in 5+ unit buildings).
- At $2,294/mo this rent would consume 58% of the median local household income ($47k/yr) (locally 543% of renters already pay >50% of income on rent) — very limited rent-growth headroom before tenants either downsize or default.
Forward outlook
- In year one you build about $27k of equity ($2k loan paydown + $25k appreciation (10.0% local appreciation)).
- Bexar County population projected at +50% by 2050 — long-run rental-demand tailwind backs the buy-and-hold thesis.
- By year 2, paydown + projected appreciation supports a ~$43k cash-out refi (75% LTV) — recoverable capital for the next deal without selling this one.
Negotiation context
- It's been on market 328 days — a 12% lower offer ($220k) is reasonable based on typical stale-listing flexibility.
- 3 sale attempts since 3y ago with the ask held roughly flat each time — persistent listings suggest the price (not the market) is what's stuck; bring a comps-based counter.
Risks & watch-outs
- Watch-outs: property tax is 3.0% of price; built in 1930 — expect roof / HVAC / electrical / plumbing capex.
- Climate carrying-cost: severe wind risk, 80% chance of damaging wind over 30y; extreme-heat days projected 7→22/yr by 2055 (HVAC capex compounding) — expect insurance premiums to compound above CPI over the hold.
Questions for the listing agent
- What do current leases actually rent for vs. the listed asking? Can we see a recent rent roll and the last 12 months of T-12 income?
- It's been on market 328 days. Have you received any prior offers? Is the seller open to a 16% concession, seller financing, or rate buy-down credit?
- Built in 1930 — when were the roof, HVAC, electrical panel, plumbing, and water heater last replaced?
- Property tax is high relative to price — has the assessment been appealed recently, and will the sale trigger a re-assessment?
- Why hasn't it sold? Are there any deal-killer items the seller is aware of (foundation, flood, title, zoning, code violations)?
- Is there a deadline driving the sale (1031 exchange, divorce, estate, relocation)? That informs how much negotiation room exists.
- Crime grade is F in this area — have there been break-ins, vandalism, or insurance claims at this property in the last 3 years? What carrier currently insures it and at what premium?
- What's the average days-on-market for RENTAL listings here right now (not sales)? A rising rental-DOM trend means longer vacancies and softer asking-rent achievability than the comps imply.
- What's the recent tenant-quality profile in this submarket — average credit score on applications, eviction rate, late-payment / NSF rate, and stable-employment percentage? A property-management company in the area should have these aggregated.
- How much new for-sale + rental construction is in the pipeline within 1–3 miles? Heavy new supply typically softens prices + rents 12–24 months out; constrained supply supports both.
Investment metrics
- 1% rule
- 0.92% ✗
- Cap rate
- 5.23%
- Cash-on-cash
- -3.80%
- DSCR
- 0.83
- GRM
- 9.1
CMA / ARV
- ARV (median comp)
- $388,213
- List price
- $250,000
- Delta
- -35.60%
- Verdict
- UNDERPRICED
- Comps
- 12 within 1.0 mi
Show comp detail 7 sales within ~0.75 mi
| Address | Dist | Beds/Ba | Sqft | Sold | Price | $/sf | Match |
|---|---|---|---|---|---|---|---|
| 126 Potomac | 0.32mi | 3/2.5 | 2,350 (-2%) | 22mo | $579,000 | $246 | 61 |
| 1002 Lamar St | 0.61mi | 3/3.5 | 2,461 (+3%) | 13mo | $499,500 | $203 | 50 |
| 1018 Wyoming | 0.67mi | 3/2.5 | 2,112 (-12%) | 1mo | $420,000 | $199 | 46 |
| 222 S Olive St #2102 | 0.62mi | 3/3.5 | 2,073 (-14%) | 12mo | $740,000 | $357 | 32 |
| 222 S Olive St #2101 | 0.62mi | 3/3.5 | 2,073 (-14%) | 16mo | $735,000 | $355 | 29 |
| 1118 Wyoming St | 0.68mi | 3/3.0 | 2,040 (-15%) | 12mo | $269,900 | $132 | 29 |
| 222 S Olive St #1102 | 0.62mi | 3/3.5 | 2,073 (-14%) | 17mo | $725,000 | $350 | 28 |
Match score weights: distance 35% · size 25% · config 20% · recency 20%. Top-matched comps best support the ARV.
Projected returns pro-forma
10.0% appreciation · 8.0% rent growth · sell at horizon
- IRR
- 23.4%
- Equity multiple
- 2.92×
- Total profit
- $134,368
- Equity at exit
- $225,220
- IRR
- 22.4%
- Equity multiple
- 7.25×
- Total profit
- $437,281
- Equity at exit
- $485,695
Cash invested: $70,000 (down + closing). Projections, not guarantees.
Landlord ↔ Tenant lean methodology
- Overall (STATE)
- 87 Strongly Landlord-Friendly
- State Texas
- 87 Strongly Landlord-Friendly · R+5
- County
- — inherits STATE
- City
- — inherits STATE
ZIP-level market 78202
- Home prices YoY
- 27.0%
- Rents YoY
- 8.2%
- Active inventory
- 196
- Price-to-rent
- 9.1×
Monthly cashflow live
- Estimated rent
- $2,294 high interval (Pro) →
- Mortgage (P&I)
- −$1,311
- Tax from tax record
- −$619 /mo · $7,427/yr
- Insurance
- −$104
- HOA
- −$0
- Vacancy / Maint / Mgmt
- −$482
- Net cashflow
- $-222
Break-even live
UW: 25.0% down · 7.5% · 30yr · 1.5% tax · 5.0% vac · 8.0% maint · 8.0% mgmt
Financing live
Cash to close
- Down payment
- $62,500
- Closing costs
- $7,500
- Reserves months
- —
- Total cash needed
- —
Loan-product check · same deal, 3 products live
Conventional
25% down · 7.5% · 30yr
- Down + closing
- —
- Monthly P&I
- —
- Monthly cashflow
- —
- DSCR
- —
- Eligible?
- —
Personal DTI + credit; lowest rate.
DSCR
20% down · 8.5% · 30yr
- Down + closing
- —
- Monthly P&I
- —
- Monthly cashflow
- —
- DSCR
- —
- Eligible?
- —
No personal income docs; deal must DSCR.
Hard money
10% down · 12.0% · 12mo
- Down + closing
- —
- Monthly P&I
- —
- Monthly cashflow
- —
- DSCR
- —
- Eligible?
- —
Short-term bridge; refi at stabilization.
Rent comps 40 comps
| Address | Beds | Baths | Sqft | Rent | $/sqft | DOM | Units | Dist |
|---|---|---|---|---|---|---|---|---|
| 423 N Mesquite St San Antonio, TX | 3.0 | 2.5 | 1925 | $1,750 | $0.91 | 12d | 1 | 0.09mi |
| 515 Nolan St San Antonio, TX | 4.0 | 2.0 | 1928 | $3,500 | $1.82 | 44d | 1 | 0.11mi |
| 1018 N Olive St San Antonio, TX | 3.0 | 2.0 | 1600 | $1,495 | $0.93 | 44d | 1 | 0.36mi |
| 1010 Burnet St San Antonio, TX | 3.0 | 2.5 | 1886 | $1,995 | $1.06 | 4d | 1 | 0.37mi |
| 204 S Hackberry St Unit 204-A S Hackberry San Antonio, TX | 4.0 | 2.0 | 2658 | $1,550 | $0.58 | 44d | 1 | 0.55mi |
| 115 Saint Charles San Antonio, TX | 3.0 | 2.0 | 1680 | $2,050 | $1.22 | 11d | 1 | 0.56mi |
| 222 S Olive St San Antonio, TX | 3.0 | 3.5 | 2073 | $2,500 | $1.21 | 44d | 1 | 0.65mi |
| 222 S Olive St #1102 San Antonio, TX | 3.0 | 3.5 | 2073 | $2,500 | $1.21 | 44d | 1 | 0.65mi |
| 218 S Olive St #2101 San Antonio, TX | 3.0 | 3.5 | 1800 | $3,199 | $1.78 | 44d | 1 | 0.66mi |
| 1223 Hays St San Antonio, TX | 3.0 | 2.5 | 1810 | $2,495 | $1.38 | 24d | 1 | 0.70mi |
| 631 Potomac San Antonio, TX | 3.0 | 2.5 | 1844 | $1,797 | $0.97 | 24d | 1 | 0.73mi |
| 222 Losoya St Unit 202 San Antonio, TX | 2.0 | 2.0 | 2000 | $3,500 | $1.75 | 44d | 1 | 0.87mi |
| 222 Losoya St Unit 201 San Antonio, TX | 2.0 | 2.0 | 1750 | $2,500 | $1.43 | 44d | 1 | 0.87mi |
| 1607 N Pine St San Antonio, TX | 4.0 | 3.0 | 2034 | $2,995 | $1.47 | 44d | 1 | 0.87mi |
| 2306 E Houston St Unit 1328945P San Antonio, TX | 3.0–4.0 | 2.0 | 4095 | $2,417 | $0.59 | 4d | 2 | 0.94mi |
| 422 Gulf San Antonio, TX | 2.0 | 1.0 | 3196 | $1,075 | $0.34 | 24d | 1 | 0.96mi |
| 1707 Dawson St Unit 1101 San Antonio, TX | 2.0 | 1.5 | 1884 | $1,000 | $0.53 | 44d | 1 | 0.98mi |
| 1723 E Crockett St San Antonio, TX | 3.0 | 3.0 | 1819 | $1,800 | $0.99 | 24d | 1 | 0.99mi |
| 2332 E Houston St San Antonio, TX | 3.0 | 2.0 | 1652 | $1,550 | $0.94 | 24d | 1 | 0.99mi |
| 330 E Carson St Apt 2301 San Antonio, TX | 4.0 | 3.0 | 2087 | $2,835 | $1.36 | 24d | 1 | 0.99mi |
| 1727 E Crockett St San Antonio, TX | 3.0 | 3.0 | 1819 | $1,725 | $0.95 | 20d | 1 | 0.99mi |
| 1414 Burleson San Antonio, TX | 4.0 | 2.0 | 1769 | $2,000 | $1.13 | 44d | 1 | 1.00mi |
| 222 E Houston St San Antonio, TX | 1.0–2.0 | 1.0–2.0 | 1187 | $2,350 | $1.98 | 20d | 1 | 1.01mi |
| 326 Cactus St San Antonio, TX | 3.0 | 2.5 | 2059 | $2,500 | $1.21 | 24d | 1 | 1.01mi |
| 114 Gravel St San Antonio, TX | 4.0 | 3.5 | 1936 | $2,095 | $1.08 | 4d | 1 | 1.02mi |
| 507 S Palmetto San Antonio, TX | 3.0 | 2.5 | 2720 | $1,230 | $0.45 | 3d | 1 | 1.02mi |
| 201 E Carson St Unit 1 San Antonio, TX | 2.0 | 2.0 | 1854 | $2,250 | $1.21 | 24d | 1 | 1.02mi |
| 707 S Olive St Unit B San Antonio, TX | 3.0 | 2.0 | 2054 | $1,500 | $0.73 | 44d | 1 | 1.06mi |
| 1800 Broadway St San Antonio, TX | 2.0 | 1.0–2.5 | 1100 | $2,734 | $2.49 | 2d | 41 | 1.08mi |
| 143 E Commerce St San Antonio, TX | 1.0–3.0 | 1.0–3.5 | 1442 | $10,245 | $7.10 | 2d | 15 | 1.10mi |
| 630 E Carson St San Antonio, TX | 4.0 | 4.0 | 3092 | $3,695 | $1.20 | 4d | 1 | 1.11mi |
| 610 Virginia Blvd Unit 2 San Antonio, TX | 3.0 | 1.0 | 1722 | $1,150 | $0.67 | 4d | 1 | 1.14mi |
| 808 E Carson St #101 San Antonio, TX | 3.0 | 2.5 | 1790 | $2,850 | $1.59 | 44d | 1 | 1.15mi |
| 808 E Carson #102 San Antonio, TX | 3.0 | 2.5 | 1883 | $2,900 | $1.54 | 44d | 1 | 1.15mi |
| 1618 Dakota St Unit 102 San Antonio, TX | 3.0 | 2.5 | 1768 | $1,925 | $1.09 | 16d | 1 | 1.18mi |
| 300 N Main Ave San Antonio, TX | 3.0 | 1.0–2.5 | 1153 | $10,437 | $9.05 | 2d | 101 | 1.19mi |
| 1136 E Euclid Ave San Antonio, TX | 3.0 | 2.5 | 1635 | $3,200 | $1.96 | 4d | 1 | 1.23mi |
| 104 Shenandoah San Antonio, TX | 3.0 | 2.5 | 1580 | $1,925 | $1.22 | 18d | 1 | 1.24mi |
| 612 Leigh St San Antonio, TX | 4.0 | 3.0 | 2357 | $4,000 | $1.70 | 44d | 1 | 1.25mi |
| 1817 N Saint Marys St #102 San Antonio, TX | 3.0 | 2.5 | 1865 | $2,850 | $1.53 | 44d | 1 | 1.26mi |
Listing history 18 events
-
2026-06-15days on market $250,000 Active 328 DOM
-
2026-06-13days on market $250,000 Active 326 DOM
-
2026-06-09days on market $250,000 Active 322 DOM
-
2026-06-08days on market $250,000 Active 321 DOM
-
2026-06-07days on market $250,000 Active 320 DOM
-
2026-06-04days on market $250,000 Active 317 DOM
-
2026-06-03days on market $250,000 Active 316 DOM
-
2026-06-02days on market $250,000 Active 315 DOM
-
2026-06-01days on market $250,000 Active 314 DOM
-
2026-05-31days on market $250,000 Active 313 DOM
-
2025-07-22$250,000 New 867-char remark
Show marketing remark (867 chars)
Multi-family opportunity in historic Dignowity Hill-just one block from Dignowity/Lockwood Park. Zoned RM-4, this property is currently configured as a 4-plex (two units up, two down) but has undergone previous renovations that created a communal kitchen setup, making it less traditionally laid out as private residences. It's in poor condition and will require a full renovation, but it offers strong potential for those looking to restore or reimagine a classic structure in one of San Antonio's most established neighborhoods. Easy access via Booker Alley creates more flexible development opportunities. Just around the corner from Dignowity/Lockwood Park with a basketball pavilion and walking trails, 0.6 miles to Fairchild Park with tennis and pickleball courts, a pool, and a playground, and 0.5 miles to the brand-new Dawson Park with a skate park and more.
-
2025-07-22historical
Show marketing remark (867 chars)
Multi-family opportunity in historic Dignowity Hill-just one block from Dignowity/Lockwood Park. Zoned RM-4, this property is currently configured as a 4-plex (two units up, two down) but has undergone previous renovations that created a communal kitchen setup, making it less traditionally laid out as private residences. It's in poor condition and will require a full renovation, but it offers strong potential for those looking to restore or reimagine a classic structure in one of San Antonio's most established neighborhoods. Easy access via Booker Alley creates more flexible development opportunities. Just around the corner from Dignowity/Lockwood Park with a basketball pavilion and walking trails, 0.6 miles to Fairchild Park with tennis and pickleball courts, a pool, and a playground, and 0.5 miles to the brand-new Dawson Park with a skate park and more.
-
2024-07-17$350,000 New
-
2023-12-15soldstatus Sold
-
2023-12-15soldstatus
-
2023-11-22status Pending
-
2023-11-08historical Active Option
-
2023-05-18$299,900 New
ⓘ Source: listings_history table (triggers on properties + properties_extension) + one-shot
backfill from property_details.listing_events for pre-trigger history.
Tax reassessment forecast TX · Resets to sale price
- Current annual tax
- $7,427 · $619/mo
- Projected year-2 tax
- $7,427 · $619/mo
- Expected delta
- $0/yr ($0/mo · 0.0%)
ⓘ Screening estimate from a state-policy table — verify with the county assessor before closing.
Climate risk First Street
- Flood 1/10 Low FEMA zone X (unshaded) · 0% chance over 30 yrs
- Wildfire 1/10 Low
- Heat 8/10 Severe 7 d/yr ≥108°F today · 22 d/yr by 30 yrs out
- Wind 8/10 Severe 80% chance of damaging wind over 30 yrs
- Air quality 2/10 Low 1 unhealthy d/yr today · 2 by 30 yrs out
Nearby sold comps map
Loading sold comps map…
Walkable amenities ~0.75 mi
Loading nearby amenities…
Taxation est. · year 1
- Rental income
- $27,527
- − Mortgage interest
- −$14,004
- − Property taxes
- −$7,427
- − Insurance
- −$1,250
- − Repairs & maintenance
- −$2,202
- − Management
- −$2,202
- − Depreciation
- −$7,273
- Taxable loss
- −$6,831
- Est. tax savings @ 24.0%
- +$1,639
- After-tax cash flow
- $-1,024/yr
For passive investors: Depreciation is non-cash, so a rental often shows a tax loss while cash-flowing — sheltering income. Rental losses are passive: they offset passive income freely, and up to $25,000/yr can offset ordinary (W-2) income if you actively participate and your MAGI is under $100k (phasing out to $0 by $150k); unused losses carry forward. On sale, claimed depreciation is recaptured at up to 25%, and gains may owe capital-gains tax (a 1031 exchange can defer both). Figures are a year-1 estimate at your 24.0% rate — not tax advice; consult a CPA.
Schools (NCES district)
- District
- San Antonio ISD
- NCES district ID
- 4838730
- Math proficiency
- 12% ▼ -21.00%
- Reading proficiency
- 22% ▼ -7.00%
- Median HH income
- $30,952
- Composite
- 13.57/100
- National rank
- #9512
- State rank
- #805 of 826 in TX
Livability — San Antonio
- Score
- 80/100
- State rank
- #31
- US rank
- #1616
Category grades
Schools grade is shown separately in the Schools card above.
Census & demographics
- Census place
- San Antonio, TX
- County
- Bexar County · 1,990,555 people
- City population
- 1,806,925
- Metro
- San Antonio-New Braunfels, TX
- Population (ZIP)
- 10,224
- Household income
- $47,478
- Rent vs Own
- Severe rent burden
- 543.0
Population outlook (Bexar County) Hauer SSP2
- Today (2025)
- 2,336,851 people
- By 2030
- 2,560,728 · +9.6%
- By 2040
- 3,020,569 · +29.3%
- By 2050
- 3,493,522 · +49.5%
- By 2075
- 4,668,459 · +99.8%
- By 2100
- 5,533,242 · +136.8%
Race, ethnicity, and origin ACS 2023
- Neighborhood character
- Predominantly Hispanic (66%)
- Race & ethnicity
- Hispanic / Latino 66% Two or more races 28% White 17% Black 16% Native American 1%
- Hispanic origin (detail)
- Mexican 57% Puerto Rican 1% Cuban 1%
- Common ancestry
- Italian 2% Slovak 1%
- Foreign-born
- 14% · Canada
- Languages at home
- 59% English-only · Spanish 41%
Political lean MEDSL · Bexar
- 2024 margin
- Lean D (+9.8) · D 54.3% · R 44.6% · Other 1.1%
- 2008→2024 swing
- +4.2pp toward D · 2008: 5.6pp · 2024: 9.8pp
- All cycles
- 2024: D+9.8 2020: D+18.2 2016: D+13.5 2012: D+4.6 2008: D+5.6
Not yet ingested
- Civics
- —
Market trends
- HPI YoY
- ▲ 53.82%
- Current HPI
- 253.3196
- Rent YoY
- ▲ 8.20%
- Metro
- San Antonio-New Braunfels, TX
- State GDP YoY
- ▲ 3.95%
- F500 in state
- 110
Industry mix (Fortune 500 HQ in TX)
| Industry | F500 HQs | Revenue |
|---|---|---|
| Energy | 16 | $1,198B |
|
||
| Technology | 5 | $198B |
|
||
| Engineering / Construction | 4 | $72B |
|
||
| Energy Services | 3 | $60B |
|
||
| Utilities | 3 | $41B |
|
||
| Healthcare | 2 | $330B |
|
||
Price history
-16.6% since first listed8 events — show timeline
- 2025-07-22 Listing Removed — LERA
- 2025-07-22 Listed $250,000 LERA
- 2024-07-17 Listed $350,000 LERA
- 2023-12-15 Sold (MLS) — LERA
- 2023-12-15 Sold (Public Records) — Public Records
- 2023-11-22 Pending — LERA
- 2023-11-08 Contingent — LERA
- 2023-05-18 Listed $299,900 LERA
Property tax history
+14.0%/yrLatest (2025): $7,427 · -3.4% YoY. Source: county tax records.
Cash-flow waterfall
monthlySold comps — $/sqft
last 12 mo · ≤1 miLoading sold comps…