 Duplex
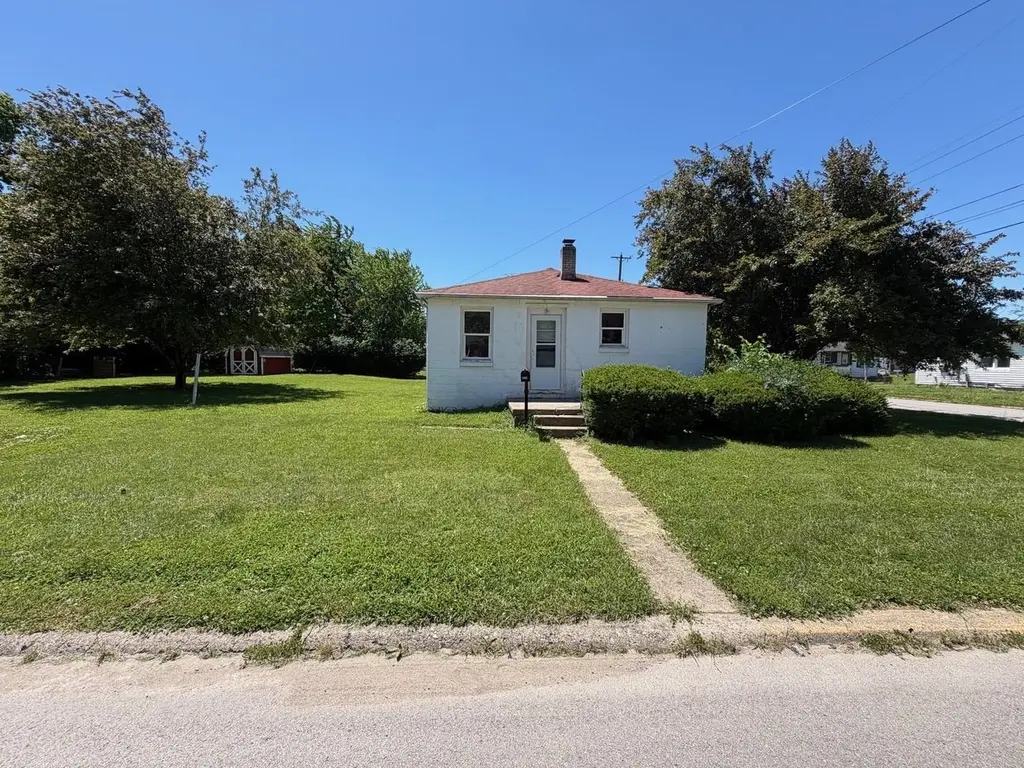
103 34th St · Connersville, IN
Flood risk 1/10 · Minimal
- FEMA flood zone
- X (unshaded)
- Chance of flooding over 30 yrs
- 0.0%
- Est. flood insurance / yr
- $507 – $1,088
Fire risk 1/10 · Minimal
- Est. fire insurance / yr
- $717 – $1,331
Heat risk 3/10 · Minor
- Hot days now (above 100°F)
- 7 days/yr
- Hot days in 30 yrs
- 19 days/yr
Wind risk 2/10 · Minimal
- Chance of severe wind over 30 yrs
- 1.0%
Air-quality risk 2/10 · Minimal
- Unhealthy air days now
- 0 days/yr
- Unhealthy air days in 30 yrs
- 1 days/yr
Risk factors via First Street. Map © Google.
Why this score? — see what drove the B+ grade
The composite is a weighted blend of 9 inputs, each scored 0–100. Each bar is that input's sub-score; the figure is the points it added to the 100-point composite (weight × sub-score).
- Cash flow +30.0/30.0
- ARV discount +15.0/15.0
- 1% rule +10.0/10.0
- DSCR +10.0/10.0
- Livability +3.2/5.0
- Schools +2.9/10.0
- Rent growth +2.5/5.0
- Condition / age +2.5/5.0
- Appreciation +2.3/10.0
$85,000
🖨 Deal sheet 📄 Offer letter ✓ Due diligence
Multi-family units
County records classify this as Multi-Family (2-4 Unit). Listing-text estimate: 2 units. confirmed
Listing remarks
Investment Opportunity – Move-In Ready Duplex! Looking to grow your rental portfolio? This move-in ready duplex is a fantastic opportunity in a desirable location! Each unit features 1 bedroom and 1 bathroom, offering comfortable living spaces that are ideal for tenants. Whether you're a seasoned investor or just getting started, this property has the potential to provide steady rental income and long-term value. Conveniently located near local amenities, shopping, dining, and everyday conveniences, this duplex is positioned for strong rental appeal. Add this income-producing property to your portfolio and start building wealth through real estate. For more information or to schedule
Key facts
- Move in ready duplex
- Strong rental appeal
- 0.24 acre lot
Tags
Property features AI
Finance
- Financial info: Annual property tax noted
Exterior
- Utilities: Public water; Public sewer
- Home design: Duplex (residential income property)
- Construction: Property type: Residential Income
- Exterior features: Lot zoned for multi-family residential
Interior
- Bathrooms: 1 full bathroom
- Interior features: One full bathroom
Neighborhood map
What this means for you Summary
Snapshot
- This is a 2 × 1.0-bed/1.0-bath units multifamily listed at $85k.
Deal economics
- At list price, monthly cash flow is $720 ($9k/yr) — positive. Per door: $360/mo.
- The deal already cash-flows at list — no discount required.
- Meets the 1% rule at list price ($2k rent vs $85k).
- Cap rate 16.5% vs local median 4.9% in Connersville — top-decile yield for the area; either an underpriced asset or a hidden risk that comps aren't pricing in. Stress-test before assuming the spread holds.
Location & tenants
- Location reads 65/100 on livability (#313 in IN) — a middle-class / working-renter tenant base. Strengths: cost of living A+, housing A+; Watch: health & safety C-, crime D+, amenities F.
- Fayette County School Corporation (town): math 29% / reading 40% proficiency, ranked #206 of 301 in IN (top 68%) — families likely to look elsewhere, expect single-tenant / working-renter base with shorter leases.
- Zoned schools: Grandview Elementary School (math 27% / reading 37%, grade F, #652 of 994 statewide, top 68%, 539 students, 71% FRL).
- Market conditions: 171 active listings in the ZIP; 20 units permitted in Fayette County in 2024 (0 in 5+ unit buildings).
Forward outlook
- Local home prices are declining (-3.0%/yr); year-one equity from $588 of loan paydown is wiped out by about $3k of value loss. Plan a longer hold.
- Fayette County population projected at -26% by 2050 — secular population decline; favor cash flow + early exit over multi-decade hold.
- At projected returns (-3.0% appreciation + 3.0% rent growth), your $24k cash investment doubles in ~4 years — after that, you're playing with house money.
Negotiation context
- Only 1 days on market — expect competitive offers; lowballing is unlikely to land.
- 3 sale attempts since 9y ago with the ask held roughly flat each time — persistent listings suggest the price (not the market) is what's stuck; bring a comps-based counter.
- Current owner paid $28k; list at $85k implies a 206% gain — meaningful room to come down on a strong offer.
Risks & watch-outs
- Watch-outs: built in 1941 — expect roof / HVAC / electrical / plumbing capex.
Questions for the listing agent
- Can we see the unit-by-unit rent roll, current vacancy, and any below-market leases? What's the average tenancy length?
- What capital expenditures (roof, boiler, parking lot, exteriors) have been made in the last 5 years, and what's planned in the next 2?
- Built in 1941 — when were the roof, HVAC, electrical panel, plumbing, and water heater last replaced?
- Is there a deadline driving the sale (1031 exchange, divorce, estate, relocation)? That informs how much negotiation room exists.
- Schools are D-rated, which usually means shorter tenancies and higher turnover. Who's the typical renter profile here, and what's been the actual vacancy rate?
- Crime grade is D in this area — have there been break-ins, vandalism, or insurance claims at this property in the last 3 years? What carrier currently insures it and at what premium?
- What's the average days-on-market for RENTAL listings here right now (not sales)? A rising rental-DOM trend means longer vacancies and softer asking-rent achievability than the comps imply.
- What's the recent tenant-quality profile in this submarket — average credit score on applications, eviction rate, late-payment / NSF rate, and stable-employment percentage? A property-management company in the area should have these aggregated.
- How much new apartment / multifamily construction is in the pipeline within 1–3 miles? Heavy new supply (>2% of stock underway) typically softens rents 12–24 months out; light construction supports rent growth.
Investment metrics
- 1% rule
- 1.90% ✓
- Cap rate
- 16.45%
- Cash-on-cash
- 36.28%
- DSCR
- 2.61
- GRM
- 4.4
CMA / ARV
- ARV (on-the-fly)
- $160,000
- Comps found
- 1
Show comp detail 1 sale within ~0.75 mi
| Address | Dist | Beds/Ba | Sqft | Sold | Price | $/sf | Match |
|---|---|---|---|---|---|---|---|
| 103 34th St | 0.00mi | 3/1.0 (+1) | 1,250 (0%) | 0mo | $160,000 | $128 | 91 |
Match score weights: distance 35% · size 25% · config 20% · recency 20%. Top-matched comps best support the ARV.
Projected returns pro-forma
-3.0% appreciation · 3.0% rent growth · sell at horizon
- IRR
- 32.0%
- Equity multiple
- 2.35×
- Total profit
- $32,060
- Equity at exit
- $12,674
- IRR
- 39.1%
- Equity multiple
- 4.65×
- Total profit
- $86,949
- Equity at exit
- $7,349
Cash invested: $23,800 (down + closing). Projections, not guarantees.
Landlord ↔ Tenant lean methodology
- Overall (STATE)
- 90 Strongly Landlord-Friendly
- State Indiana
- 90 Strongly Landlord-Friendly · R+11
- County
- — inherits STATE
- City
- — inherits STATE
ZIP-level market 47331
- Home prices YoY
- -2.1%
- Active inventory
- 171
- Price-to-rent
- 8.8×
Monthly cashflow live
- Estimated rent
- $1,614 medium interval (Pro) →
- Mortgage (P&I)
- −$446
- Tax from tax record
- −$74 /mo · $892/yr
- Insurance
- −$35
- HOA
- −$0
- Vacancy / Maint / Mgmt
- −$339
- Net cashflow
- $720
Break-even live
2-unit breakdown (identical units grouped — click to expand)
| Units | Beds | Baths | Est. rent |
|---|---|---|---|
| 2× units | 1.0 | 1 | $1,614 |
| #1 | 1.0 | 1 | $807 |
| #2 | 1.0 | 1 | $807 |
| Total (2 units) | $1,614 | ||
UW: 25.0% down · 7.5% · 30yr · 1.5% tax · 5.0% vac · 8.0% maint · 8.0% mgmt
Financing live
Cash to close
- Down payment
- $21,250
- Closing costs
- $2,550
- Reserves months
- —
- Total cash needed
- —
Loan-product check · same deal, 3 products live
Conventional
25% down · 7.5% · 30yr
- Down + closing
- —
- Monthly P&I
- —
- Monthly cashflow
- —
- DSCR
- —
- Eligible?
- —
Personal DTI + credit; lowest rate.
DSCR
20% down · 8.5% · 30yr
- Down + closing
- —
- Monthly P&I
- —
- Monthly cashflow
- —
- DSCR
- —
- Eligible?
- —
No personal income docs; deal must DSCR.
Hard money
10% down · 12.0% · 12mo
- Down + closing
- —
- Monthly P&I
- —
- Monthly cashflow
- —
- DSCR
- —
- Eligible?
- —
Short-term bridge; refi at stabilization.
Listing history 2 events
-
2026-06-09remarks 693-char remark
-
2026-06-09$85,000 Pending 1 DOM
ⓘ Source: listings_history table (triggers on properties + properties_extension) + one-shot
backfill from property_details.listing_events for pre-trigger history.
Tax reassessment forecast IN · Partial reset (capped growth)
- Current annual tax
- $892 · $74/mo
- Projected year-2 tax
- $892 · $74/mo
- Expected delta
- $0/yr ($0/mo · 0.0%)
ⓘ Screening estimate from a state-policy table — verify with the county assessor before closing.
Climate risk First Street
- Flood 1/10 Low FEMA zone X (unshaded) · 0% chance over 30 yrs
- Wildfire 1/10 Low
- Heat 3/10 Moderate 7 d/yr ≥100°F today · 19 d/yr by 30 yrs out
- Wind 2/10 Low 100% chance of damaging wind over 30 yrs
- Air quality 2/10 Low 0 unhealthy d/yr today · 1 by 30 yrs out
Nearby sold comps map
Loading sold comps map…
Walkable amenities ~0.75 mi
Loading nearby amenities…
Taxation est. · year 1
- Rental income
- $19,368
- − Mortgage interest
- −$4,761
- − Property taxes
- −$892
- − Insurance
- −$425
- − Repairs & maintenance
- −$1,549
- − Management
- −$1,549
- − Depreciation
- −$2,473
- Taxable income
- $7,718
- Est. tax owed @ 24.0%
- −$1,852
- After-tax cash flow
- $6,782/yr
For passive investors: Depreciation is non-cash, so a rental often shows a tax loss while cash-flowing — sheltering income. Rental losses are passive: they offset passive income freely, and up to $25,000/yr can offset ordinary (W-2) income if you actively participate and your MAGI is under $100k (phasing out to $0 by $150k); unused losses carry forward. On sale, claimed depreciation is recaptured at up to 25%, and gains may owe capital-gains tax (a 1031 exchange can defer both). Figures are a year-1 estimate at your 24.0% rate — not tax advice; consult a CPA.
Schools (NCES district)
- District
- Fayette County School Corporation
- NCES district ID
- 1803510
- Math proficiency
- 29% ▼ -11.00%
- Reading proficiency
- 40% ▼ -8.00%
- Median HH income
- $38,669
- Composite
- 28.81/100
- National rank
- #6659
- State rank
- #206 of 301 in IN
Livability — Connersville
- Score
- 65/100
- State rank
- #313
- US rank
- #12417
Category grades
Schools grade is shown separately in the Schools card above.
Census & demographics
- Census place
- Connersville, IN
- Population (ZIP)
- 22,769
Population outlook (Fayette County) Hauer SSP2
- Today (2025)
- 21,758 people
- By 2030
- 20,673 · -5.0%
- By 2040
- 18,335 · -15.7%
- By 2050
- 16,056 · -26.2%
- By 2075
- 11,030 · -49.3%
- By 2100
- 6,800 · -68.7%
Race, ethnicity, and origin ACS 2023
- Neighborhood character
- Predominantly White (94%)
- Race & ethnicity
- White 94% Two or more races 4% Hispanic / Latino 1% Black 1%
- Common ancestry
- Italian 2% Slovak 1% Lithuanian 1%
- Foreign-born
- 1% · Canada
- Languages at home
- 98% English-only · Spanish 1%
Political lean MEDSL · Fayette
- 2024 margin
- Solid R (+56.3) · D 21.2% · R 77.5% · Other 1.3%
- 2008→2024 swing
- -50.8pp toward R · 2008: -5.6pp · 2024: -56.3pp
- All cycles
- 2024: R+56.3 2020: R+54.4 2016: R+48.1 2012: R+16.9 2008: R+5.6
Not yet ingested
- Civics
- —
Market trends
- HPI YoY
- ▼ -5.33%
- Current HPI
- 252.3898
- Rent YoY
- —
- Metro
- —
- State GDP YoY
- ▲ 2.90%
- F500 in state
- 18
Industry mix (Fortune 500 HQ in IN)
| Industry | F500 HQs | Revenue |
|---|---|---|
| Industrial Machinery | 2 | $37B |
|
||
| Healthcare | 1 | $177B |
|
||
| Pharmaceuticals | 1 | $45B |
|
||
| Metals / Steel | 1 | $18B |
|
||
| Agriculture | 1 | $17B |
|
||
| Packaging | 1 | $12B |
|
||
Price history
+161.5% since first listed6 events — show timeline
- 2026-06-08 Pending — ECIAOR
- 2026-06-08 Listed $85,000 ECIAOR
- 2018-03-29 Sold (MLS) $27,779 RRELMS
- 2018-03-29 Sold (MLS) $27,775 ECIAOR
- 2017-06-21 Listed $32,500 RRELMS
- 2017-06-21 Listed $32,500 ECIAOR
Property tax history
-1.6%/yrLatest (2024): $892 · +0.0% YoY. Source: county tax records.
Cash-flow waterfall
monthlySold comps — $/sqft
last 12 mo · ≤1 miLoading sold comps…