 🏷️ Likely Rental
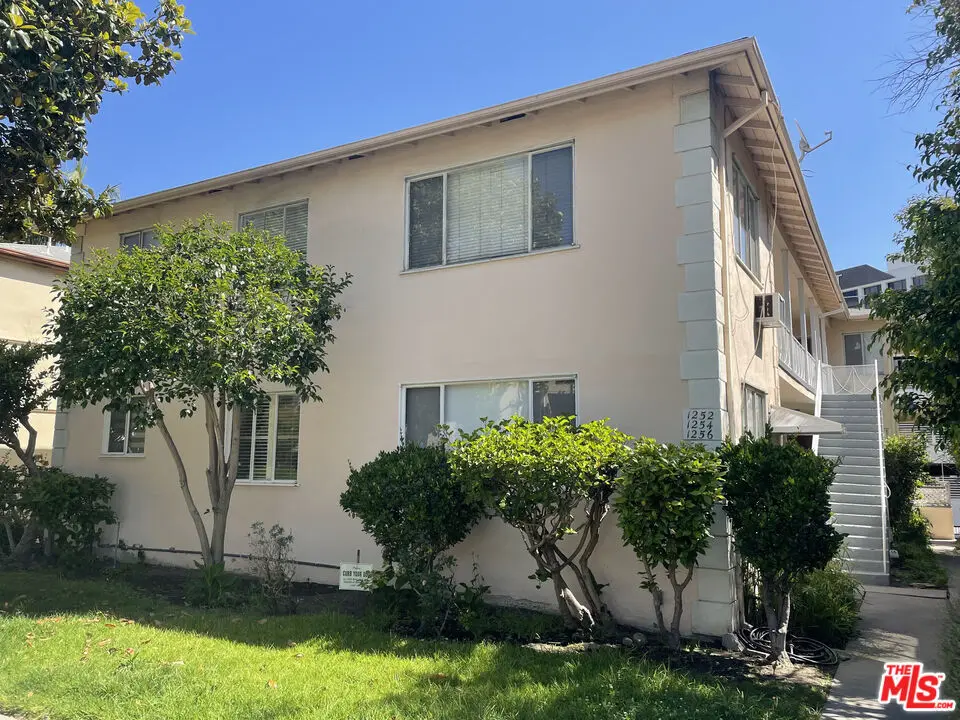
1252 Smithwood Dr · Los Angeles, CA
Flood risk 1/10 · Minimal
- FEMA flood zone
- X (unshaded)
- Chance of flooding over 30 yrs
- 0.0%
- Est. flood insurance / yr
- $507 – $1,088
Fire risk 1/10 · Minimal
- Est. fire insurance / yr
- $659 – $1,223
Heat risk 6/10 · Moderate
- Hot days now (above 86°F)
- 7 days/yr
- Hot days in 30 yrs
- 21 days/yr
Wind risk 1/10 · Minimal
- Chance of severe wind over 30 yrs
- —
Air-quality risk 5/10 · Moderate
- Unhealthy air days now
- 7 days/yr
- Unhealthy air days in 30 yrs
- 7 days/yr
Risk factors via First Street. Map © Google.
Why this score? — see what drove the C- grade
The composite is a weighted blend of 9 inputs, each scored 0–100. Each bar is that input's sub-score; the figure is the points it added to the 100-point composite (weight × sub-score).
- ARV discount +15.0/15.0
- Cash flow +12.2/30.0
- Appreciation +6.4/10.0
- DSCR +3.6/10.0
- Schools +3.6/10.0
- 1% rule +3.5/10.0
- Livability +3.4/5.0
- Condition / age +2.5/5.0
- Rent growth +2.1/5.0
$2,300,000
🖨 Deal sheet (PDF) 📄 Offer letter ✓ Due diligence
Multi-family units
County records classify this as Multi-Family (5+ Unit). Listing-text estimate: 6 units. confirmed
5+ unit building — per-unit beds/baths from public records are typically unavailable; the breakdown below (if shown) is an estimate from the listing text.
Listing remarks
Amazing & rare opportunity to acquire a Six Unit building located in highly desirable Pico-Robertson neighborhood just blocks to Beverly Hills (off Beverly Drive) on a gorgeous tree-lined street. Long term ownership, thoughtfully maintained & first time on the market in many decades. Property features 2: two bedrooms/one-bathroom units (top with balcony) and 4: one bedroom/one-bathroom units. Includes Carport with six parking spaces is detached from the main building. Tenant community laundry on-site. Property strategically & conveniently located nearby Century City, Culver City, West LA, Westwood, The Grove entertainment, restaurants & shopping.
Key facts
- 6,600 sq ft lot
- 6 parking spots
- Built 1952
Property features AI
Finance
- Other: Possession subject to tenant rights at close of escrow; Property sold As-Is (trust/conservatorship disclosure)
- Financial info: Actual annual gross rent reported; Unit-level rents and counts: four 1-bed/1-bath units and two 2-bed/2-bath units; Six refrigerators and six ranges provided for the units; Laundry equipment is owner-owned; Tenants pay cable TV and electric; owner pays water and gardener
- HOA & community: Six units in the complex
Exterior
- Parking: Six covered carport spaces (detached carport with built-in storage); Total of six parking spaces
- Utilities: Water service to the street; Sewer to the street; Electric paid by tenants; water and gardener paid by owner
- Home design: Residential income property; Two-level building (two stories); Single building on site
- Construction: No additional exterior structures; Property configured as apartments
- Exterior features: Balcony; Sidewalks; Alley access
Interior
- Kitchen: Free-standing gas ranges in units; Refrigerators provided (six total across property)
- Bedrooms: Units include 1-bed and 2-bed layouts (see unit breakdown)
- Flooring: Mixed flooring: hardwood, carpet, linoleum, and laminate
- Bathrooms: Shower over tub configuration in bathrooms
- Heating & cooling: Wall heating; No central cooling; Central water heater
- Interior features: Jalousie/louvered windows and multiple blind types (vertical, mini, window blinds)
- Laundry & utility: On-site laundry available (units have laundry in closet and outdoor laundry options); Washer and dryer present
Neighborhood map
What this means for you Summary
Snapshot
- This is a 2×2bd/1ba + 4×1bd/1ba units multifamily listed at $2.30M.
Deal economics
- At list price, monthly cash flow is $-459 ($-6k/yr) — negative. Per door: $-76/mo.
- To cash-flow at today's rent, offer at most $2.23M (2.9% below list).
- To meet the 1% rule (rent ≥ 1% of price), the offer needs to be $1.95M (15.0% below list).
- Recommended offer: $1.95M (15.0% below list) — sets the bar for 1% rule.
- Cap rate 6.1% vs local median 2.1% in Los Angeles — top-decile yield for the area; either an underpriced asset or a hidden risk that comps aren't pricing in. Stress-test before assuming the spread holds.
Location & tenants
- Location reads 68/100 on livability (#273 in CA) — a middle-class / working-renter tenant base. Strengths: amenities A+, commute A+, employment B; Watch: health & safety C-, crime F, cost of living F.
- Los Angeles Unified (urban): math 29% / reading 54% proficiency, ranked #223 of 517 in CA (top 43%) — families likely to look elsewhere, expect single-tenant / working-renter base with shorter leases; 67% free/reduced lunch — lower-income household profile, screen leases tightly.
- Zoned schools: Canfield Avenue Elementary (334 students, 28% FRL); Palms Middle (1,244 students, 66% FRL); Alexander Hamilton Senior High (math 31% / reading 65%, grade D, #380 of 1,170 statewide, top 33%, 2,259 students, 74% FRL).
- Market conditions: Rents soft (-1.6%/yr); 108 active listings in the ZIP; 4 comparable units currently listed for rent nearby; rentals leasing fast (median 9d on market — plan ~1-2 weeks tenant-placement turnaround); solid renter incomes; 19,697 units permitted in Los Angeles County in 2024 (9,426 in 5+ unit buildings).
- At $19,539/mo this rent would consume 223% of the median local household income ($105k/yr) (locally 2317% of renters already pay >50% of income on rent) — very limited rent-growth headroom before tenants either downsize or default.
Forward outlook
- In year one you build about $78k of equity ($16k loan paydown + $62k appreciation (2.7% local appreciation)).
- Los Angeles County population projected at +9% by 2050 — modest demand growth; plan on rents tracking national, not racing it.
- By year 3, paydown + projected appreciation supports a ~$196k cash-out refi (75% LTV) — recoverable capital for the next deal without selling this one.
Negotiation context
- It's been on market 54 days — a 3% lower offer ($2.23M) is reasonable based on typical stale-listing flexibility.
Risks & watch-outs
- Watch-outs: built in 1952 — expect roof / HVAC / electrical / plumbing capex.
- Climate carrying-cost: extreme-heat days projected 7→21/yr by 2055 (HVAC capex compounding) — expect insurance premiums to compound above CPI over the hold.
Questions for the listing agent
- What do current leases actually rent for vs. the listed asking? Can we see a recent rent roll and the last 12 months of T-12 income?
- It's been on market 54 days. Have you received any prior offers? Is the seller open to a 15% concession, seller financing, or rate buy-down credit?
- Can we see the unit-by-unit rent roll, current vacancy, and any below-market leases? What's the average tenancy length?
- What capital expenditures (roof, boiler, parking lot, exteriors) have been made in the last 5 years, and what's planned in the next 2?
- Built in 1952 — when were the roof, HVAC, electrical panel, plumbing, and water heater last replaced?
- Is there a deadline driving the sale (1031 exchange, divorce, estate, relocation)? That informs how much negotiation room exists.
- Schools are D-rated, which usually means shorter tenancies and higher turnover. Who's the typical renter profile here, and what's been the actual vacancy rate?
- Crime grade is F in this area — have there been break-ins, vandalism, or insurance claims at this property in the last 3 years? What carrier currently insures it and at what premium?
- What's the average days-on-market for RENTAL listings here right now (not sales)? A rising rental-DOM trend means longer vacancies and softer asking-rent achievability than the comps imply.
- What's the recent tenant-quality profile in this submarket — average credit score on applications, eviction rate, late-payment / NSF rate, and stable-employment percentage? A property-management company in the area should have these aggregated.
- How much new apartment / multifamily construction is in the pipeline within 1–3 miles? Heavy new supply (>2% of stock underway) typically softens rents 12–24 months out; light construction supports rent growth.
Investment metrics
- 1% rule
- 0.85% ✗
- Cap rate
- 6.05%
- Cash-on-cash
- -0.86%
- DSCR
- 0.96
- GRM
- 9.8
CMA / ARV
- ARV (median comp)
- $2,917,196
- List price
- $2,300,000
- Delta
- -18.59%
- Verdict
- UNDERPRICED
- Comps
- 20 within 1.0 mi
Show comp detail 6 sales within ~0.75 mi
| Address | Dist | Beds/Ba | Sqft | Sold | Price | $/sf | Match |
|---|---|---|---|---|---|---|---|
| 419 S Rexford Dr | 0.25mi | 8/8.0 | 5,511 (+14%) | 3mo | $3,995,000 | $725 | 55 |
| 1437 Cardiff Ave | 0.28mi | 8/9.0 | 4,982 (+3%) | 21mo | $3,500,000 | $703 | 53 |
| 1449 S Durango Ave | 0.49mi | 8/7.0 | 4,255 (-12%) | 4mo | $2,510,170 | $590 | 49 |
| 148 S Maple Dr | 0.70mi | 8/8.0 | 4,977 (+3%) | 18mo | $2,650,000 | $532 | 40 |
| 120 S Elm Dr | 0.73mi | 8/4.0 | 4,976 (+2%) | 20mo | $2,200,000 | $442 | 37 |
| 151 S Rexford Dr | 0.67mi | 9/8.0 (+1) | 5,508 (+14%) | 10mo | $3,000,000 | $545 | 24 |
Match score weights: distance 35% · size 25% · config 20% · recency 20%. Top-matched comps best support the ARV.
Projected returns pro-forma
2.72% appreciation · 0.0% rent growth · sell at horizon
- IRR
- 4.4%
- Equity multiple
- 1.24×
- Total profit
- $156,627
- Equity at exit
- $997,751
- IRR
- 6.3%
- Equity multiple
- 1.89×
- Total profit
- $575,049
- Equity at exit
- $1,509,909
Cash invested: $644,000 (down + closing). Projections, not guarantees.
Landlord ↔ Tenant lean methodology
- Overall (CITY)
- 0 Strongly Tenant-Friendly
- State California
- 18 Strongly Tenant-Friendly · D+13
- County
- — inherits STATE
- City Los Angeles
- 0 Strongly Tenant-Friendly · D+22
ZIP-level market 90035
- Home prices YoY
- 0.7%
- Rents YoY
- -1.6%
- Active inventory
- 108
- Price-to-rent
- 56.3×
Monthly cashflow live
- Estimated rent
- $19,539 high interval (Pro) →
- Mortgage (P&I)
- −$12,061
- Tax est. 1.5%
- −$2,875 /mo · $34,500/yr
- Insurance
- −$958
- HOA
- −$0
- Vacancy / Maint / Mgmt
- −$4,103
- Net cashflow
- $-459
Break-even live
Sensitivity live
| Price | -10% $1,131 | -5% $336 | +0% $-459 | +5% $-1,254 | +10% $-2,048 |
|---|---|---|---|---|---|
| Rent | -10% $-2,003 | -5% $-1,231 | +0% $-459 | +5% $313 | +10% $1,085 |
| Rate | -1.0pp $699 | -0.5pp $126 | base $-459 | +0.5pp $-1,055 | +1.0pp $-1,661 |
6-unit breakdown (identical units grouped — click to expand)
| Units | Beds | Baths | Est. rent |
|---|---|---|---|
| 2× units | 2 | 1 | $6,806 |
| #1 | 2 | 1 | $3,403 |
| #2 | 2 | 1 | $3,403 |
| 4× units | 1 | 1 | $12,732 |
| #3 | 1 | 1 | $3,183 |
| #4 | 1 | 1 | $3,183 |
| #5 | 1 | 1 | $3,183 |
| #6 | 1 | 1 | $3,183 |
| Total (6 units) | $19,539 | ||
UW: 25.0% down · 7.5% · 30yr · 1.5% tax · 5.0% vac · 8.0% maint · 8.0% mgmt
Financing live
Cash to close
- Down payment
- $575,000
- Closing costs
- $69,000
- Reserves months
- —
- Total cash needed
- —
Loan-product check · same deal, 3 products live
Conventional
25% down · 7.5% · 30yr
- Down + closing
- —
- Monthly P&I
- —
- Monthly cashflow
- —
- DSCR
- —
- Eligible?
- —
Personal DTI + credit; lowest rate.
DSCR
20% down · 8.5% · 30yr
- Down + closing
- —
- Monthly P&I
- —
- Monthly cashflow
- —
- DSCR
- —
- Eligible?
- —
No personal income docs; deal must DSCR.
Hard money
10% down · 12.0% · 12mo
- Down + closing
- —
- Monthly P&I
- —
- Monthly cashflow
- —
- DSCR
- —
- Eligible?
- —
Short-term bridge; refi at stabilization.
Rent comps 4 comps
| Address | Beds | Baths | Sqft | Rent | $/sqft | DOM | Units | Dist |
|---|---|---|---|---|---|---|---|---|
| 1510 Cardiff Ave Los Angeles, CA | 7.0 | 5.5 | 4747 | $19,000 | $4.00 | 9d | 1 | 0.40mi |
| 9500 Sawyer St Los Angeles, CA | 7.0 | 4.5 | 3554 | $17,500 | $4.92 | 2d | 1 | 0.70mi |
| 517 N Elm Dr Beverly Hills, CA | 7.0 | 6.0 | 5158 | $30,000 | $5.82 | 9d | 1 | 1.47mi |
| 9041 Cattaraugus Ave Los Angeles, CA | 8.0 | 8.0 | 5689 | $15,500 | $2.72 | 45d | 1 | 1.48mi |
Listing history 15 events
-
2026-06-21pricedays on market $2,300,000 Active 54 DOM
-
2026-06-18days on market $2,375,000 Active 51 DOM
-
2026-06-17days on market $2,375,000 Active 50 DOM
-
2026-06-16days on market $2,375,000 Active 49 DOM
-
2026-06-15days on market $2,375,000 Active 48 DOM
-
2026-06-13days on market $2,375,000 Active 46 DOM
-
2026-06-09days on market $2,375,000 Active 42 DOM
-
2026-06-08days on market $2,375,000 Active 41 DOM
-
2026-06-07days on market $2,375,000 Active 40 DOM
-
2026-06-04days on market $2,375,000 Active 37 DOM
-
2026-06-03days on market $2,375,000 Active 36 DOM
-
2026-06-02days on market $2,375,000 Active 35 DOM
-
2026-06-01days on market $2,375,000 Active 34 DOM
-
2026-05-31days on market $2,375,000 Active 33 DOM
-
2026-04-25$2,375,000 Active 678-char remark
ⓘ Source: listings_history table (triggers on properties + properties_extension) + one-shot
backfill from property_details.listing_events for pre-trigger history.
Climate risk First Street
- Flood 1/10 Low FEMA zone X (unshaded) · 0% chance over 30 yrs
- Wildfire 1/10 Low
- Heat 6/10 Major 7 d/yr ≥86°F today · 21 d/yr by 30 yrs out
- Wind 1/10 Low
- Air quality 5/10 Major 7 unhealthy d/yr today · 7 by 30 yrs out
Nearby sold comps map
Loading sold comps map…
Walkable amenities ~0.75 mi
Loading nearby amenities…
Taxation est. · year 1
- Rental income
- $234,468
- − Mortgage interest
- −$128,836
- − Property taxes
- −$34,500
- − Insurance
- −$11,500
- − Repairs & maintenance
- −$18,757
- − Management
- −$18,757
- − Depreciation
- −$66,909
- Taxable loss
- −$44,792
- Est. tax savings @ 24.0%
- +$10,750
- After-tax cash flow
- $5,242/yr
For passive investors: Depreciation is non-cash, so a rental often shows a tax loss while cash-flowing — sheltering income. Rental losses are passive: they offset passive income freely, and up to $25,000/yr can offset ordinary (W-2) income if you actively participate and your MAGI is under $100k (phasing out to $0 by $150k); unused losses carry forward. On sale, claimed depreciation is recaptured at up to 25%, and gains may owe capital-gains tax (a 1031 exchange can defer both). Figures are a year-1 estimate at your 24.0% rate — not tax advice; consult a CPA.
Schools (NCES district)
- District
- Los Angeles Unified
- NCES district ID
- 0622710
- Math proficiency
- 29% ▼ -4.00%
- Reading proficiency
- 54% ▲ 10.00%
- Median HH income
- $50,403
- Composite
- 35.67/100
- National rank
- #4875
- State rank
- #223 of 517 in CA
Livability — Los Angeles
- Score
- 68/100
- State rank
- #273
- US rank
- #9237
Category grades
Schools grade is shown separately in the Schools card above.
Census & demographics
- Census place
- Los Angeles, CA
- County
- Los Angeles County · 9,444,647 people
- City population
- 3,838,149
- Metro
- Los Angeles-Long Beach-Anaheim, CA
- Population (ZIP)
- 29,000
- Household income
- $105,013
- Rent vs Own
- Severe rent burden
- 2317.0
Population outlook (Los Angeles County) Hauer SSP2
- Today (2025)
- 10,940,515 people
- By 2030
- 11,256,481 · +2.9%
- By 2040
- 11,729,929 · +7.2%
- By 2050
- 11,948,407 · +9.2%
- By 2075
- 11,818,114 · +8.0%
- By 2100
- 10,842,928 · -0.9%
Race, ethnicity, and origin ACS 2023
- Neighborhood character
- Diverse neighborhood (Simpson 0.57)
- Race & ethnicity
- White 64% Hispanic / Latino 14% Two or more races 11% Asian 7% Black 7%
- Hispanic origin (detail)
- Mexican 7% Cuban 1%
- Common ancestry
- Scotch-Irish 4% Italian 3% Romanian 3%
- Foreign-born
- 21% · Canada, China, South Korea
- Languages at home
- 72% English-only · Other Indo-European 8% Spanish 7% Russian/Polish/Slavic 1%
Political lean MEDSL · Los Angeles
- 2024 margin
- Solid D (+32.9) · D 64.8% · R 31.9% · Other 3.3%
- 2008→2024 swing
- -7.4pp toward R · 2008: 40.4pp · 2024: 32.9pp
- All cycles
- 2024: D+32.9 2020: D+44.2 2016: D+48.0 2012: D+40.0 2008: D+40.4
Not yet ingested
- Civics
- —
Market trends
- HPI YoY
- ▲ 2.72%
- Current HPI
- 394.903
- Rent YoY
- ▼ -1.60%
- Metro
- Los Angeles-Long Beach-Anaheim, CA
- State GDP YoY
- ▲ 3.21%
- F500 in state
- 116
Industry mix (Fortune 500 HQ in CA)
| Industry | F500 HQs | Revenue |
|---|---|---|
| Technology | 27 | $1,492B |
|
||
| Financial Services | 3 | $174B |
|
||
| Retail | 3 | $44B |
|
||
| Insurance | 3 | $26B |
|
||
| Media / Entertainment | 2 | $115B |
|
||
| Pharmaceuticals / Biotech | 2 | $62B |
|
||
Price history
-3.2% since first listed2 events — show timeline
- 2026-06-20 Price Changed $2,300,000 TheMLS
- 2026-04-25 Listed $2,375,000 TheMLS
Property tax history
+1.9%/yrLatest (2025): $3,863 · +2.3% YoY. Source: county tax records.
Cash-flow waterfall
monthlySold comps — $/sqft
last 12 mo · ≤1 miLoading sold comps…