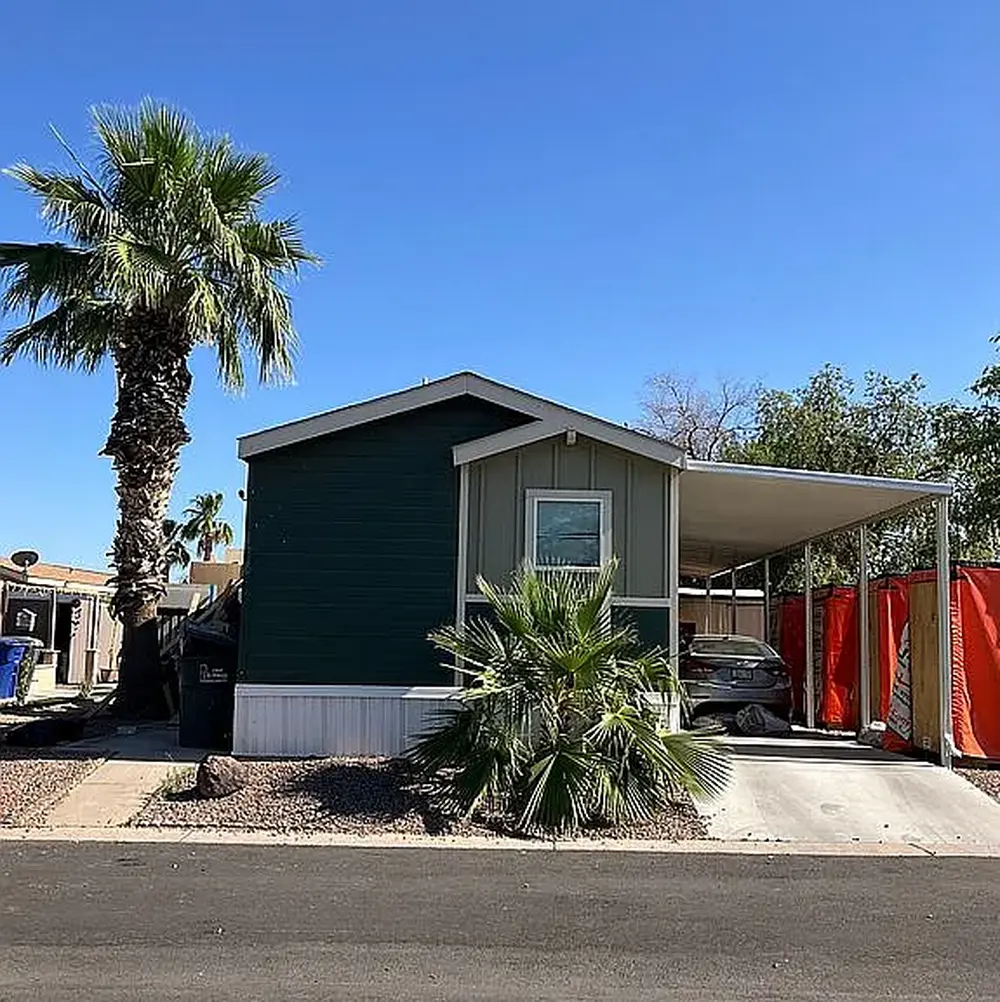
12721 W Greenway Rd · El Mirage, AZ
Flood risk 1/10 · Minimal
- FEMA flood zone
- X (shaded)
- Chance of flooding over 30 yrs
- 0.0%
- Est. flood insurance / yr
- $507 – $1,088
Fire risk 4/10 · Minor
- Est. fire insurance / yr
- $610 – $1,132
Heat risk 9/10 · Severe
- Hot days now (above 114°F)
- 7 days/yr
- Hot days in 30 yrs
- 18 days/yr
Wind risk 1/10 · Minimal
- Chance of severe wind over 30 yrs
- —
Air-quality risk 2/10 · Minimal
- Unhealthy air days now
- 1 days/yr
- Unhealthy air days in 30 yrs
- 1 days/yr
Risk factors via First Street. Map © Google.
Why this score? — see what drove the B- grade
The composite is a weighted blend of 9 inputs, each scored 0–100. Each bar is that input's sub-score; the figure is the points it added to the 100-point composite (weight × sub-score).
- Cash flow +30.0/30.0
- 1% rule +10.0/10.0
- DSCR +10.0/10.0
- ARV discount +7.5/15.0
- Schools +3.3/10.0
- Livability +3.2/5.0
- Rent growth +2.5/5.0
- Condition / age +2.5/5.0
- Appreciation +0.0/10.0
$65,000
🖨 Deal sheet 📄 Offer letter ✓ Due diligence
Listing remarks MLS
This 3 bedroom, 2 bath home is located in Rosewood Estates, a gated community! Home is only 10 years old and move-in-ready! Great for first-time homebuyers, families, or an investment opportunity! Call or text to set up a time to see this wonderful home in El Mirage! Things we love: Large bathtub in master bath, 3 bedrooms, all-electric kitchen appliances, shed in yard, hardwood floor in main area of the house, two large porches, covered carport.
Key facts
- Gated community
- Shed in yard
- Covered carport
Tags
Neighborhood map
What this means for you Summary
Snapshot
- This is a 3-bed/2.0-bath land listed at $65k.
Deal economics
- At list price, monthly cash flow is $1k ($15k/yr) — positive.
- The deal already cash-flows at list — no discount required.
- Meets the 1% rule at list price ($2k rent vs $65k).
- Recommended offer: $57k (12.0% below list) — sets the bar for market timing.
- Cap rate 29.6% vs local median 4.5% in El Mirage — top-decile yield for the area; either an underpriced asset or a hidden risk that comps aren't pricing in. Stress-test before assuming the spread holds.
Location & tenants
- Location reads 63/100 on livability (#112 in AZ) — a middle-class / working-renter tenant base. Strengths: housing A+, cost of living A; Watch: schools D-, amenities F, commute F.
- Dysart Unified District (4243) (suburban): math 34% / reading 40% proficiency, ranked #73 of 249 in AZ (top 29%) — families likely to look elsewhere, expect single-tenant / working-renter base with shorter leases.
- Market conditions: Rents flat; 132 active listings in the ZIP; 38 comparable units currently listed for rent nearby; rentals leasing fast (median 5d on market — plan ~1-2 weeks tenant-placement turnaround); solid renter incomes; 36,011 units permitted in Maricopa County in 2024 (12,801 in 5+ unit buildings).
- This rent runs 33% of the median local income ($78k/yr) — at the standard rent-burdened threshold; future hikes will face affordability resistance.
Forward outlook
- Local home prices are declining (-3.0%/yr); year-one equity from $449 of loan paydown is wiped out by about $2k of value loss. Plan a longer hold.
- Maricopa County population projected at +38% by 2050 — long-run rental-demand tailwind backs the buy-and-hold thesis.
- At projected returns (-3.0% appreciation + 0.1% rent growth), your $18k cash investment doubles in ~2 years — after that, you're playing with house money.
Negotiation context
- It's been on market 248 days — a 12% lower offer ($57k) is reasonable based on typical stale-listing flexibility.
- 4 sale attempts since 25y ago; this cycle's ask has dropped $30k (32%) from the opening price — seller is motivated, your offer sets the floor, not the list.
Risks & watch-outs
- Climate carrying-cost: extreme-heat days projected 7→18/yr by 2055 (HVAC capex compounding) — expect insurance premiums to compound above CPI over the hold.
Questions for the listing agent
- It's been on market 248 days. Have you received any prior offers? Is the seller open to a 12% concession, seller financing, or rate buy-down credit?
- Why hasn't it sold? Are there any deal-killer items the seller is aware of (foundation, flood, title, zoning, code violations)?
- Is there a deadline driving the sale (1031 exchange, divorce, estate, relocation)? That informs how much negotiation room exists.
- Schools are D-rated, which usually means shorter tenancies and higher turnover. Who's the typical renter profile here, and what's been the actual vacancy rate?
- What's the average days-on-market for RENTAL listings here right now (not sales)? A rising rental-DOM trend means longer vacancies and softer asking-rent achievability than the comps imply.
- What's the recent tenant-quality profile in this submarket — average credit score on applications, eviction rate, late-payment / NSF rate, and stable-employment percentage? A property-management company in the area should have these aggregated.
- How much new for-sale + rental construction is in the pipeline within 1–3 miles? Heavy new supply typically softens prices + rents 12–24 months out; constrained supply supports both.
Investment metrics
- 1% rule
- 3.33% ✓
- Cap rate
- 29.59%
- Cash-on-cash
- 83.21%
- DSCR
- 4.70
- GRM
- 2.5
CMA / ARV
- ARV (median comp)
- $349,821
- List price
- $65,000
- Delta
- -81.42%
- Verdict
- UNDERPRICED
- Comps
- 20 within 1.0 mi
Projected returns pro-forma
-3.0% appreciation · 0.08% rent growth · sell at horizon
- IRR
- 80.2%
- Equity multiple
- 4.50×
- Total profit
- $63,698
- Equity at exit
- $9,692
- IRR
- 82.9%
- Equity multiple
- 8.43×
- Total profit
- $135,168
- Equity at exit
- $5,620
Cash invested: $18,200 (down + closing). Projections, not guarantees.
Landlord ↔ Tenant lean methodology
- Overall (STATE)
- 87 Strongly Landlord-Friendly
- State Arizona
- 87 Strongly Landlord-Friendly · R+3
- County
- — inherits STATE
- City
- — inherits STATE
ZIP-level market 85335
- Home prices YoY
- -13.3%
- Rents YoY
- 0.1%
- Active inventory
- 132
- Price-to-rent
- 2.5×
Monthly cashflow live
- Estimated rent
- $2,166 high interval (Pro) →
- Mortgage (P&I)
- −$341
- Tax est. 1.5%
- −$81 /mo · $975/yr
- Insurance
- −$27
- HOA
- −$0
- Vacancy / Maint / Mgmt
- −$455
- Net cashflow
- $1,262
Break-even live
UW: 25.0% down · 7.5% · 30yr · 1.5% tax · 5.0% vac · 8.0% maint · 8.0% mgmt
Financing live
Cash to close
- Down payment
- $16,250
- Closing costs
- $1,950
- Reserves months
- —
- Total cash needed
- —
Loan-product check · same deal, 3 products live
Conventional
25% down · 7.5% · 30yr
- Down + closing
- —
- Monthly P&I
- —
- Monthly cashflow
- —
- DSCR
- —
- Eligible?
- —
Personal DTI + credit; lowest rate.
DSCR
20% down · 8.5% · 30yr
- Down + closing
- —
- Monthly P&I
- —
- Monthly cashflow
- —
- DSCR
- —
- Eligible?
- —
No personal income docs; deal must DSCR.
Hard money
10% down · 12.0% · 12mo
- Down + closing
- —
- Monthly P&I
- —
- Monthly cashflow
- —
- DSCR
- —
- Eligible?
- —
Short-term bridge; refi at stabilization.
Rent comps 38 comps
| Address | Beds | Baths | Sqft | Rent | $/sqft | DOM | Units | Dist |
|---|---|---|---|---|---|---|---|---|
| 13029 W Lisbon Ln El Mirage, AZ | 4.0 | 2.5 | 1949 | $1,860 | $0.95 | 1d | 1 | 0.39mi |
| 13007 W Mandalay Ln El Mirage, AZ | 4.0 | 2.5 | 2178 | $2,095 | $0.96 | 24d | 1 | 0.42mi |
| 12537 W Redfield Rd El Mirage, AZ | 3.0 | 2.0 | 1600 | $1,795 | $1.12 | 24d | 1 | 0.42mi |
| 12830 W Via Camille El Mirage, AZ | 4.0 | 2.5 | 2179 | $2,145 | $0.98 | 1d | 1 | 0.56mi |
| 13217 W Mauna Loa Ln Surprise, AZ | 3.0 | 2.0 | 1672 | $1,900 | $1.14 | 1d | 1 | 0.59mi |
| 13186 W Gelding Cir Surprise, AZ | 3.0 | 2.5 | 1691 | $1,899 | $1.12 | 2d | 1 | 0.67mi |
| 12731 W Tasha Dr #1 Surprise, AZ | 2.0 | 1.0 | 3010 | $1,395 | $0.46 | 18d | 1 | 0.74mi |
| 12817 W Cottonwood St Surprise, AZ | 2.0 | 1.0 | 1795 | $1,300 | $0.72 | 3d | 1 | 0.79mi |
| 12204 W Ocotillo Ln El Mirage, AZ | 4.0 | 3.0 | 2117 | $1,949 | $0.92 | 23d | 1 | 0.79mi |
| 12128 W Tara Ln El Mirage, AZ | 4.0 | 3.0 | 2117 | $2,145 | $1.01 | 18d | 1 | 0.83mi |
| 12128 W Tara Ln El Mirage, AZ | 4.0 | 3.0 | 2117 | $2,145 | $1.01 | 1d | 1 | 0.83mi |
| 12134 W Ironwood St El Mirage, AZ | 3.0 | 2.0 | 1680 | $1,950 | $1.16 | 24d | 1 | 0.85mi |
| 12121 W Ironwood St El Mirage, AZ | 3.0 | 2.0 | 1680 | $1,999 | $1.19 | 24d | 1 | 0.86mi |
| 14973 N 135th Dr Unit 1546409P Surprise, AZ | 3.0 | 2.0 | 1797 | $3,122 | $1.74 | 12d | 1 | 0.92mi |
| 13440 W Gelding Dr Surprise, AZ | 4.0 | 2.5 | 2102 | $2,235 | $1.06 | 5d | 1 | 0.92mi |
| 13391 W Crocus Dr Surprise, AZ | 4.0 | 2.5 | 2102 | $2,195 | $1.04 | 5d | 1 | 0.93mi |
| 15109 N Verbena St El Mirage, AZ | 4.0 | 2.0 | 1642 | $1,869 | $1.14 | 43d | 1 | 0.95mi |
| 12530 W Willow Ave El Mirage, AZ | 4.0 | 2.0 | 1615 | $2,075 | $1.28 | 24d | 1 | 0.97mi |
| 12530 W Willow Ave El Mirage, AZ | 4.0 | 2.0 | 1615 | $1,830 | $1.13 | 5d | 1 | 0.97mi |
| 13402 W Fargo Dr Surprise, AZ | 3.0 | 2.0 | 1987 | $2,595 | $1.31 | 24d | 1 | 0.98mi |
| 13402 W Fargo Dr Surprise, AZ | 3.0 | 2.0 | 1987 | $4,000 | $2.01 | 43d | 1 | 0.98mi |
| 15204 N El Frio Ct El Mirage, AZ | 4.0 | 2.5 | 1978 | $2,019 | $1.02 | 2d | 1 | 0.99mi |
| 13034 W Ash St El Mirage, AZ | 4.0 | 3.0 | 2108 | $2,281 | $1.08 | 2d | 1 | 1.03mi |
| 13409 N 127th Dr El Mirage, AZ | 4.0 | 2.5 | 1691 | $2,249 | $1.33 | 5d | 1 | 1.04mi |
| 14948 N 136th Ln Surprise, AZ | 4.0 | 2.0 | 2120 | $2,224 | $1.05 | 44d | 1 | 1.10mi |
| 14809 N El Frio Cir El Mirage, AZ | 4.0 | 2.0 | 1700 | $2,300 | $1.35 | 24d | 1 | 1.10mi |
| 12410 W Pershing St El Mirage, AZ | 3.0 | 2.5 | 1776 | $1,700 | $0.96 | 5d | 1 | 1.19mi |
| 12541 W Myer Ln El Mirage, AZ | 3.0 | 2.5 | 1794 | $1,885 | $1.05 | 5d | 1 | 1.22mi |
| 14815 N Tonya Cir El Mirage, AZ | 4.0 | 2.0 | 1642 | $2,040 | $1.24 | 43d | 1 | 1.22mi |
| 13658 W Fargo Dr Surprise, AZ | 4.0 | 2.0 | 1935 | $2,100 | $1.09 | 5d | 1 | 1.24mi |
| 13709 W Cottonwood St Surprise, AZ | 4.0 | 2.0 | 1883 | $2,150 | $1.14 | 43d | 1 | 1.30mi |
| 13709 W Cottonwood St Surprise, AZ | 4.0 | 2.0 | 1883 | $2,200 | $1.17 | 5d | 1 | 1.30mi |
| 13005 N 129th Dr El Mirage, AZ | 4.0 | 2.0 | 1785 | $1,999 | $1.12 | 1d | 1 | 1.31mi |
| 12901 N 127th Ln El Mirage, AZ | 3.0 | 2.0 | 1615 | $1,815 | $1.12 | 5d | 1 | 1.40mi |
| 16198 N 137th Dr Surprise, AZ | 4.0 | 2.0 | 1883 | $2,100 | $1.12 | 5d | 1 | 1.40mi |
| 16206 N 137th Dr Surprise, AZ | 3.0 | 2.0 | 1883 | $2,045 | $1.09 | 5d | 1 | 1.41mi |
| 13857 W Ironwood St Surprise, AZ | 3.0 | 2.0 | 1627 | $1,900 | $1.17 | 24d | 1 | 1.41mi |
| 16112 N 138th Dr Surprise, AZ | 4.0 | 2.0 | 1883 | $1,950 | $1.04 | 18d | 1 | 1.48mi |
Listing history 27 events
-
2026-06-18days on market $65,000 Active 248 DOM
-
2026-06-17days on market $65,000 Active 247 DOM
-
2026-06-16days on market $65,000 Active 246 DOM
-
2026-06-15days on market $65,000 Active 245 DOM
-
2026-06-13days on market $65,000 Active 243 DOM
-
2026-06-09days on market $65,000 Active 239 DOM
-
2026-06-08days on market $65,000 Active 238 DOM
-
2026-06-07days on market $65,000 Active 237 DOM
-
2026-06-04pricedays on market $65,000 Active 234 DOM
-
2026-06-03days on market $75,000 Active 233 DOM
-
2026-06-02days on market $75,000 Active 232 DOM
-
2026-06-01days on market $75,000 Active 231 DOM
-
2026-05-31days on market $75,000 Active 230 DOM
-
2025-11-29price $75,000 451-char remark
Show marketing remark (451 chars)
This 3 bedroom, 2 bath home is located in Rosewood Estates, a gated community! Home is only 10 years old and move-in-ready! Great for first-time homebuyers, families, or an investment opportunity! Call or text to set up a time to see this wonderful home in El Mirage! Things we love: Large bathtub in master bath, 3 bedrooms, all-electric kitchen appliances, shed in yard, hardwood floor in main area of the house, two large porches, covered carport.
-
2025-10-13$95,000 Active 451-char remark
Show marketing remark (451 chars)
This 3 bedroom, 2 bath home is located in Rosewood Estates, a gated community! Home is only 10 years old and move-in-ready! Great for first-time homebuyers, families, or an investment opportunity! Call or text to set up a time to see this wonderful home in El Mirage! Things we love: Large bathtub in master bath, 3 bedrooms, all-electric kitchen appliances, shed in yard, hardwood floor in main area of the house, two large porches, covered carport.
-
2008-08-20historical
-
2008-06-25$39,900
-
2001-11-01historical
-
2001-08-23historical
-
2001-07-21$60,000
-
2001-07-21$60,000
-
1996-02-14soldstatus $1,815,000
-
1993-10-15soldstatus $600,000
-
1992-03-30soldstatus $1,097,250
-
1992-01-02soldstatus $1,525,000
-
1985-10-01soldstatus $300,000
-
1985-10-01soldstatus $300,000
ⓘ Source: listings_history table (triggers on properties + properties_extension) + one-shot
backfill from property_details.listing_events for pre-trigger history.
Climate risk First Street
- Flood 1/10 Low FEMA zone X (shaded) · 0% chance over 30 yrs
- Wildfire 4/10 Moderate
- Heat 9/10 Extreme 7 d/yr ≥114°F today · 18 d/yr by 30 yrs out
- Wind 1/10 Low
- Air quality 2/10 Low 1 unhealthy d/yr today · 1 by 30 yrs out
Nearby sold comps map
Loading sold comps map…
Walkable amenities ~0.75 mi
Loading nearby amenities…
Taxation est. · year 1
- Rental income
- $25,994
- − Mortgage interest
- −$3,641
- − Property taxes
- −$975
- − Insurance
- −$325
- − Repairs & maintenance
- −$2,080
- − Management
- −$2,080
- − Depreciation
- −$1,891
- Taxable income
- $15,003
- Est. tax owed @ 24.0%
- −$3,601
- After-tax cash flow
- $11,544/yr
For passive investors: Depreciation is non-cash, so a rental often shows a tax loss while cash-flowing — sheltering income. Rental losses are passive: they offset passive income freely, and up to $25,000/yr can offset ordinary (W-2) income if you actively participate and your MAGI is under $100k (phasing out to $0 by $150k); unused losses carry forward. On sale, claimed depreciation is recaptured at up to 25%, and gains may owe capital-gains tax (a 1031 exchange can defer both). Figures are a year-1 estimate at your 24.0% rate — not tax advice; consult a CPA.
Schools (NCES district)
- District
- Dysart Unified District (4243)
- NCES district ID
- 0402690
- Math proficiency
- 34% ▼ -10.00%
- Reading proficiency
- 40% ▼ -5.00%
- Median HH income
- $58,033
- Composite
- 32.76/100
- National rank
- #5634
- State rank
- #73 of 249 in AZ
Livability — El Mirage
- Score
- 63/100
- State rank
- #112
- US rank
- #15164
Category grades
Schools grade is shown separately in the Schools card above.
Census & demographics
- Census place
- El Mirage, AZ
- County
- Maricopa County · 4,537,380 people
- City population
- 36,088
- Metro
- Phoenix-Mesa-Chandler, AZ
- Population (ZIP)
- 36,088
- Household income
- $78,050
- Rent vs Own
- Severe rent burden
- 669.0
Population outlook (Maricopa County) Hauer SSP2
- Today (2025)
- 4,979,203 people
- By 2030
- 5,378,229 · +8.0%
- By 2040
- 6,156,598 · +23.6%
- By 2050
- 6,872,376 · +38.0%
- By 2075
- 8,401,270 · +68.7%
- By 2100
- 9,247,439 · +85.7%
Race, ethnicity, and origin ACS 2023
- Neighborhood character
- Diverse neighborhood (Simpson 0.62)
- Race & ethnicity
- Hispanic / Latino 50% White 35% Two or more races 28% Black 6% Native American 1% Pacific Islander 1%
- Hispanic origin (detail)
- Mexican 37%
- Common ancestry
- Lithuanian 2% Romanian 1% Iranian 1%
- Foreign-born
- 15% · Canada
- Languages at home
- 66% English-only · Spanish 30% Other Indo-European 1% Other Asian/Pacific 1%
Political lean MEDSL · Maricopa
- 2024 margin
- Toss-up / Even · D 47.7% · R 51.2% · Other 1.1%
- 2008→2024 swing
- +7.1pp toward D · 2008: -10.6pp · 2024: -3.5pp
- All cycles
- 2024: R+3.5 2020: D+2.2 2016: R+3.5 2012: R+12.0 2008: R+10.6
Not yet ingested
- Civics
- —
Market trends
- HPI YoY
- ▼ -52.81%
- Current HPI
- 342.6503
- Rent YoY
- ▲ 0.08%
- Metro
- Phoenix-Mesa-Chandler, AZ
- State GDP YoY
- ▲ 4.54%
- F500 in state
- 20
Industry mix (Fortune 500 HQ in AZ)
| Industry | F500 HQs | Revenue |
|---|---|---|
| Technology | 2 | $13B |
|
||
| Mining / Metals | 1 | $23B |
|
||
| Environmental Services | 1 | $16B |
|
||
| Metals / Steel | 1 | $14B |
|
||
| Technology Distribution | 1 | $9B |
|
||
| Homebuilding | 1 | $8B |
|
||
Price history
-75.0% since first listed14 events — show timeline
- 2025-11-29 Price Changed $75,000 ForSaleByOwner.com
- 2025-10-13 Listed $95,000 ForSaleByOwner.com
- 2008-08-20 Listing Removed — ARMLS
- 2008-06-25 Listed $39,900 ARMLS
- 2001-11-01 Listing Removed — ARMLS
- 2001-08-23 Listing Removed — ARMLS
- 2001-07-21 Listed $60,000 ARMLS
- 2001-07-21 Listed $60,000 ARMLS
- 1996-02-14 Sold (Public Records) $1,815,000 Public Records
- 1993-10-15 Sold (Public Records) $600,000 Public Records
- 1992-03-30 Sold (Public Records) $1,097,250 Public Records
- 1992-01-02 Sold (Public Records) $1,525,000 Public Records
- 1985-10-01 Sold (Public Records) $300,000 Public Records
- 1985-10-01 Sold (Public Records) $300,000 Public Records
Property tax history
-0.5%/yrLatest (2025): $34,164 · -0.2% YoY. Source: county tax records.
Cash-flow waterfall
monthlySold comps — $/sqft
last 12 mo · ≤1 miLoading sold comps…