527 NE 6th #A St · Blue Springs, MO
Flood risk 1/10 · Minimal
- FEMA flood zone
- X (unshaded)
- Chance of flooding over 30 yrs
- 0.0%
- Est. flood insurance / yr
- $507 – $1,088
Fire risk 2/10 · Minimal
- Est. fire insurance / yr
- $1,054 – $1,958
Heat risk 4/10 · Minor
- Hot days now (above 108°F)
- 7 days/yr
- Hot days in 30 yrs
- 16 days/yr
Wind risk 2/10 · Minimal
- Chance of severe wind over 30 yrs
- —
Air-quality risk 4/10 · Minor
- Unhealthy air days now
- 5 days/yr
- Unhealthy air days in 30 yrs
- 5 days/yr
Risk factors via First Street. Map © Google.
Why this score? — see what drove the D- grade
The composite is a weighted blend of 9 inputs, each scored 0–100. Each bar is that input's sub-score; the figure is the points it added to the 100-point composite (weight × sub-score).
- Cash flow +11.2/30.0
- ARV discount +5.9/15.0
- Schools +5.1/10.0
- 1% rule +4.2/10.0
- Livability +4.1/5.0
- Rent growth +3.8/5.0
- DSCR +3.3/10.0
- Condition / age +1.0/5.0
- Appreciation +0.0/10.0
$182,500
🖨 Deal sheet (PDF) 📄 Offer letter ✓ Due diligence
Listing remarks MLS
Lot of updates- New- In kitchen. Nice two story with laundry room upstairs. Family room/ kitchen combo with fireplace and a little desk room area. Great floor plan and good location. Shows good.
Key facts
- $128 HOA
- Garage
- Built 1992
Property features AI
Finance
- HOA & community: Monthly HOA fee of $128 covering lawn service and snow removal; Maintenance provided by association
Exterior
- Parking: Attached garage with garage door opener (garage faces front); 1 garage space
- Utilities: Public water; Public sewer; Cable available
- Home design: Residential condominium; Attached property; 2-story floor plan; North-facing
- Construction: Board & batten siding and shingle siding; Shake roof; Slab foundation; Approximately 31–40 years old
- Exterior features: Patio; Zero lot line; Paved public road access
Interior
- Kitchen: Dishwasher; Disposal; Microwave; Refrigerator; Electric range; Kitchen and dining combo
- Bedrooms: 2 bedrooms (both on second level unless noted otherwise); Bedroom-level laundry access
- Flooring: Carpet; Vinyl (in select rooms)
- Bathrooms: 1 full bathroom with separate shower and tub; 1 half bathroom
- Heating & cooling: Heat pump for heating and cooling
- Interior features: Ceiling fans; Vaulted ceilings; Walk-in closet(s); Window coverings; Thermal windows; Storm door(s); Fireplace screen
- Laundry & utility: Washer; Dryer; Laundry closet
Neighborhood map
What this means for you Summary
Snapshot
- This is a 2-bed/1.5-bath condo listed at $182k. Condition is rated poor.
Deal economics
- At list price, monthly cash flow is $-69 ($-824/yr) — negative.
- To cash-flow at today's rent, offer at most $173k (5.4% below list).
- To meet the 1% rule (rent ≥ 1% of price), the offer needs to be $167k (8.4% below list).
- Recommended offer: $167k (8.4% below list) — sets the bar for 1% rule.
- Cap rate 5.8% vs local median 3.2% in Blue Springs — top-decile yield for the area; either an underpriced asset or a hidden risk that comps aren't pricing in. Stress-test before assuming the spread holds.
Location & tenants
- Location reads 82/100 on livability (#11 in MO, #1,297 nationally) — a professional / high-income tenant draw. Strengths: cost of living A+, housing A+, health & safety A+; Watch: commute F.
- Blue Springs R-IV (suburban): math 55% / reading 60% proficiency, ranked #17 of 324 in MO (top 5%) — acceptable for families but not a draw, mixed tenant base, ~2y average lease.
- Zoned schools: James Walker Elem. (math 66% / reading 61%, grade B, #88 of 1,115 statewide, top 8%, 447 students, 47% FRL); Blue Springs High (math 50% / reading 65%, grade C, #49 of 521 statewide, top 9%, 2,383 students, 28% FRL).
- Market conditions: Rents rising fast (+5.1%/yr); 239 active listings in the ZIP; 13 comparable units currently listed for rent nearby; rentals leasing fast (median 11d on market — plan ~1-2 weeks tenant-placement turnaround); solid renter incomes; 4,002 units permitted in Jackson County in 2024 (2,271 in 5+ unit buildings).
Forward outlook
- Local home prices are declining (-3.0%/yr); year-one equity from $1k of loan paydown is wiped out by about $5k of value loss. Plan a longer hold.
- Jackson County population projected at +4% by 2050 — modest demand growth; plan on rents tracking national, not racing it.
Negotiation context
- It's been on market 23 days — a 2% lower offer ($180k) is reasonable based on typical stale-listing flexibility.
- 4 sale attempts since 22y ago with the ask held roughly flat each time — persistent listings suggest the price (not the market) is what's stuck; bring a comps-based counter.
Questions for the listing agent
- What do current leases actually rent for vs. the listed asking? Can we see a recent rent roll and the last 12 months of T-12 income?
- Have any recent inspections been done? Can we get a copy of the seller's disclosures and any deferred-maintenance estimates?
- What does the HOA fee cover, when was the last increase, and are there any pending special assessments or reserve-fund shortfalls?
- Any open or pending special assessments — roof, HVAC, plumbing, elevator, façade? What's the per-unit balance and payoff schedule, and is the seller paying it off at close or rolling it to the buyer?
- Is there a deadline driving the sale (1031 exchange, divorce, estate, relocation)? That informs how much negotiation room exists.
- Schools are A-rated — typically a magnet for longer-tenancy family renters. What's the average tenant stay here, and is there a school-zone premium baked into asking?
- The area grade is low — what's the realistic commute time and amenity access for the typical tenant pool here? Any planned neighborhood developments (good or bad) we should know about?
- What's the average days-on-market for RENTAL listings here right now (not sales)? A rising rental-DOM trend means longer vacancies and softer asking-rent achievability than the comps imply.
- What's the recent tenant-quality profile in this submarket — average credit score on applications, eviction rate, late-payment / NSF rate, and stable-employment percentage? A property-management company in the area should have these aggregated.
- How much new apartment / multifamily construction is in the pipeline within 1–3 miles? Heavy new supply (>2% of stock underway) typically softens rents 12–24 months out; light construction supports rent growth.
Investment metrics
- 1% rule
- 0.92% ✗
- Cap rate
- 5.84%
- Cash-on-cash
- -1.61%
- DSCR
- 0.93
- GRM
- 9.1
CMA / ARV
- ARV (median comp)
- $176,233
- List price
- $182,500
- Delta
- 3.56%
- Verdict
- FAIR
- Comps
- 20 within 1.0 mi
Projected returns pro-forma
-3.0% appreciation · 5.12% rent growth · sell at horizon
- IRR
- -16.3%
- Equity multiple
- 0.41×
- Total profit
- $-30,202
- Equity at exit
- $27,211
- IRR
- -4.3%
- Equity multiple
- 0.69×
- Total profit
- $-15,906
- Equity at exit
- $15,779
Cash invested: $51,100 (down + closing). Projections, not guarantees.
Landlord ↔ Tenant lean methodology
- Overall (STATE)
- 81 Strongly Landlord-Friendly
- State Missouri
- 81 Strongly Landlord-Friendly · R+10
- County
- — inherits STATE
- City
- — inherits STATE
ZIP-level market 64014
- Rents YoY
- 5.1%
- Active inventory
- 239
- Price-to-rent
- 9.1×
Monthly cashflow live
- Estimated rent
- $1,672 high interval (Pro) →
- Mortgage (P&I)
- −$957
- Tax est. 1.5%
- −$228 /mo · $2,738/yr
- Insurance
- −$76
- HOA
- −$128
- Vacancy / Maint / Mgmt
- −$351
- Net cashflow
- $-69
Break-even live
Sensitivity live
| Price | -10% $57 | -5% $-6 | +0% $-69 | +5% $-132 | +10% $-195 |
|---|---|---|---|---|---|
| Rent | -10% $-201 | -5% $-135 | +0% $-69 | +5% $-3 | +10% $63 |
| Rate | -1.0pp $23 | -0.5pp $-22 | base $-69 | +0.5pp $-116 | +1.0pp $-164 |
UW: 25.0% down · 7.5% · 30yr · 1.5% tax · 5.0% vac · 8.0% maint · 8.0% mgmt
Financing live
Cash to close
- Down payment
- $45,625
- Closing costs
- $5,475
- Reserves months
- —
- Total cash needed
- —
Loan-product check · same deal, 3 products live
Conventional
25% down · 7.5% · 30yr
- Down + closing
- —
- Monthly P&I
- —
- Monthly cashflow
- —
- DSCR
- —
- Eligible?
- —
Personal DTI + credit; lowest rate.
DSCR
20% down · 8.5% · 30yr
- Down + closing
- —
- Monthly P&I
- —
- Monthly cashflow
- —
- DSCR
- —
- Eligible?
- —
No personal income docs; deal must DSCR.
Hard money
10% down · 12.0% · 12mo
- Down + closing
- —
- Monthly P&I
- —
- Monthly cashflow
- —
- DSCR
- —
- Eligible?
- —
Short-term bridge; refi at stabilization.
Rent comps 13 comps
| Address | Beds | Baths | Sqft | Rent | $/sqft | DOM | Units | Dist |
|---|---|---|---|---|---|---|---|---|
| 573 NW Valleybrook Rd Blue Springs, MO | 2.0 | 2.5 | 1350 | $1,750 | $1.30 | 21d | 1 | 0.51mi |
| 128 N 1st St Blue Springs, MO | 3.0 | 2.0 | 1100 | $1,706 | $1.55 | 8d | 1 | 0.53mi |
| 101 NW Mock Ave Blue Springs, MO | 1.0–2.0 | 1.0–2.0 | 937 | $1,550 | $1.65 | 2d | 5 | 0.66mi |
| 1120 NE 9th St Blue Springs, MO | 3.0 | 2.0 | 1450 | $1,800 | $1.24 | 24d | 1 | 0.68mi |
| 503 SW 4th St Blue Springs, MO | 3.0 | 2.0 | 1400 | $1,395 | $1.00 | 44d | 1 | 0.89mi |
| 509 SW 5th St Blue Springs, MO | 3.0 | 2.5 | 1370 | $1,475 | $1.08 | 8d | 1 | 0.95mi |
| 402 SW 6 St Unit 402 Blue Springs, MO | 2.0 | 1.0 | 900 | $1,135 | $1.26 | 3d | 1 | 0.97mi |
| 900 SE Tequesta Ln Blue Springs, MO | 3.0 | 2.5–3.5 | 1647 | $2,128 | $1.29 | 2d | 11 | 1.00mi |
| 804 NW Hearnes Ave Blue Springs, MO | 3.0 | 1.5 | 1150 | $1,671 | $1.45 | 44d | 1 | 1.05mi |
| 132 SW 8th St Unit 132 8th Blue Springs, MO | 3.0 | 2.5 | 1350 | $1,795 | $1.33 | 44d | 1 | 1.06mi |
| 409 NE Duncan Rd Blue Springs, MO | 3.0 | 3.0 | 1750 | $2,400 | $1.37 | 11d | 1 | 1.10mi |
| 110 SW 10th St Unit 4 Blue Springs, MO | 1.0 | 1.0 | 1000 | $820 | $0.82 | 3d | 1 | 1.19mi |
| 1003 NW 12 St Blue Springs, MO | 3.0 | 2.0 | 1014 | $1,495 | $1.47 | 16d | 1 | 1.41mi |
HOA detail condo
- Monthly dues
- $128 · $1,536/yr
- Assessments
- None detected in remarks — confirm with the listing agent.
Listing history 17 events
-
2026-06-13statusdays on market $182,500 Pending 23 DOM
-
2026-06-09days on market $182,500 Active Under Contract 20 DOM
-
2026-06-08days on market $182,500 Active Under Contract 19 DOM
-
2026-06-07statusdays on market $182,500 Active Under Contract 18 DOM
-
2026-06-05days on market $182,500 Active 15 DOM
-
2026-06-03days on market $182,500 Active 14 DOM
-
2026-06-02days on market $182,500 Active 13 DOM
-
2026-06-01days on market $182,500 Active 12 DOM
-
2026-05-31remarks 280-char remark
-
2026-05-31days on market $182,500 Active 11 DOM
-
2026-05-05historical $182,500
-
2013-07-15soldstatus 194-char remark
Show marketing remark (194 chars)
Lot of updates- New- In kitchen. Nice two story with laundry room upstairs. Family room/ kitchen combo with fireplace and a little desk room area. Great floor plan and good location. Shows good.
-
2013-06-10$50,000 194-char remark
Show marketing remark (194 chars)
Lot of updates- New- In kitchen. Nice two story with laundry room upstairs. Family room/ kitchen combo with fireplace and a little desk room area. Great floor plan and good location. Shows good.
-
2005-05-02soldstatus
Show marketing remark (103 chars)
All new carpet, interior paint, tile in Kitchen/Den, entry, both baths. New garage door. Move-in ready.
-
2005-02-21$87,500
Show marketing remark (103 chars)
All new carpet, interior paint, tile in Kitchen/Den, entry, both baths. New garage door. Move-in ready.
-
2004-04-30soldstatus
-
2004-01-12$82,500
ⓘ Source: listings_history table (triggers on properties + properties_extension) + one-shot
backfill from property_details.listing_events for pre-trigger history.
Climate risk First Street
- Flood 1/10 Low FEMA zone X (unshaded) · 0% chance over 30 yrs
- Wildfire 2/10 Low
- Heat 4/10 Moderate 7 d/yr ≥108°F today · 16 d/yr by 30 yrs out
- Wind 2/10 Low
- Air quality 4/10 Moderate 5 unhealthy d/yr today · 5 by 30 yrs out
Nearby sold comps map
Loading sold comps map…
Walkable amenities ~0.75 mi
Loading nearby amenities…
Taxation est. · year 1
- Rental income
- $20,059
- − Mortgage interest
- −$10,223
- − Property taxes
- −$2,738
- − Insurance
- −$912
- − Repairs & maintenance
- −$1,605
- − Management
- −$1,605
- − HOA
- −$1,536
- − Depreciation
- −$5,309
- Taxable loss
- −$3,868
- Est. tax savings @ 24.0%
- +$928
- After-tax cash flow
- $104/yr
For passive investors: Depreciation is non-cash, so a rental often shows a tax loss while cash-flowing — sheltering income. Rental losses are passive: they offset passive income freely, and up to $25,000/yr can offset ordinary (W-2) income if you actively participate and your MAGI is under $100k (phasing out to $0 by $150k); unused losses carry forward. On sale, claimed depreciation is recaptured at up to 25%, and gains may owe capital-gains tax (a 1031 exchange can defer both). Figures are a year-1 estimate at your 24.0% rate — not tax advice; consult a CPA.
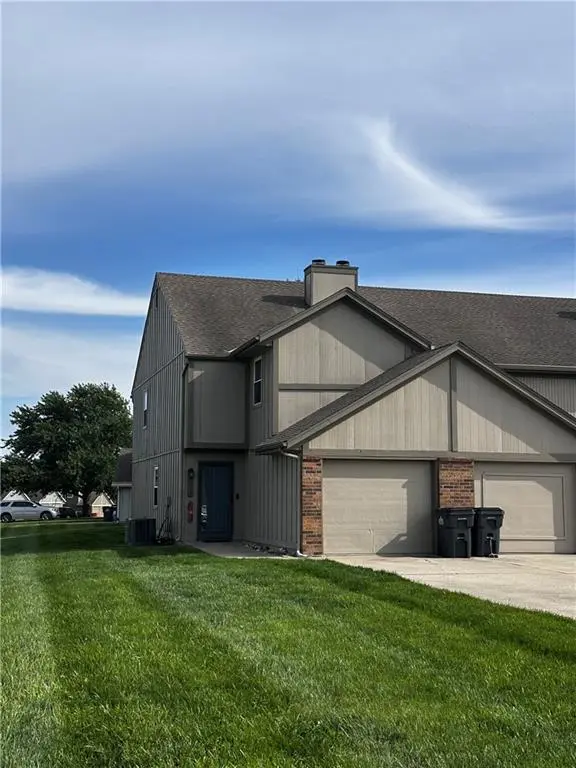
Condition & rehab AI · 1 photo
This property requires extensive repairs and updates across all systems and areas, significantly impacting its current condition and value. Immediate action is needed to address the poor condition and improve the home's resale and rental value.
Repairs flagged
- Major Kitchen — No photos of the kitchen show any condition.
- Major Bathrooms — No photos of the bathrooms show any condition.
- Major Roof — No photos of the roof show any condition.
- Major Exterior — No photos of the exterior show any condition.
- Major Flooring — No photos of the flooring show any condition.
- Major Interior walls/paint — No photos of the interior walls/paint show any condition.
- Major Windows — No photos of the windows show any condition.
- Major Foundation/structure — No photos of the foundation/structure show any condition.
- Major HVAC/mechanicals — No photos of the HVAC/mechanicals show any condition.
- Major Landscaping/curb appeal — No photos of the landscaping/curb appeal show any condition.
Value-add opportunities
- Both New carpet and interior painting — These updates are already completed and will enhance the home's appearance and appeal to potential buyers/renters.
- Both Landscaping and curb appeal — A well-maintained and attractive exterior will increase the home's curb appeal and attract more potential buyers/renters.
- Both Kitchen and bathroom updates — Updating these areas will improve the home's functionality and appeal to potential buyers/renters.
- Both Roof and exterior repairs — These repairs will address safety concerns and improve the home's overall appearance and value.
- Both HVAC and mechanical updates — Upgrading these systems will improve the home's comfort and energy efficiency, attracting more potential buyers/renters.
- Both Foundation and structural repairs — These repairs will ensure the home's structural integrity and attract more potential buyers/renters.
- Both Windows and glass replacement — New windows will improve energy efficiency, reduce heating and cooling costs, and enhance the home's curb appeal and value.
- Both Landscaping and curb appeal — A well-maintained and attractive exterior will increase the home's curb appeal and attract more potential buyers/renters.
Renovation cost estimate screening
| Repair item | Severity | Est. cost |
|---|---|---|
| Kitchen · No photos of the kitchen show any condition. | Major | $15,000–50,000 |
| Bathrooms · No photos of the bathrooms show any condition. | Major | $15,000–50,000 |
| Roof · No photos of the roof show any condition. | Major | $15,000–50,000 |
| Exterior · No photos of the exterior show any condition. | Major | $15,000–50,000 |
| Flooring · No photos of the flooring show any condition. | Major | $15,000–50,000 |
| Interior walls/paint · No photos of the interior walls/paint show any condition. | Major | $15,000–50,000 |
| Windows · No photos of the windows show any condition. | Major | $15,000–50,000 |
| Foundation/structure · No photos of the foundation/structure show any condition. | Major | $15,000–50,000 |
| HVAC/mechanicals · No photos of the HVAC/mechanicals show any condition. | Major | $15,000–50,000 |
| Landscaping/curb appeal · No photos of the landscaping/curb appeal show any condition. | Major | $15,000–50,000 |
| Total estimated repair cost · 10 items | $150,000–500,000 |
Value-add ROI direction
- Both New carpet and interior painting — These updates are already completed and will enhance the home's appearance and appeal to potential buyers/renters. ↑
- Both Landscaping and curb appeal — A well-maintained and attractive exterior will increase the home's curb appeal and attract more potential buyers/renters. ↑
- Both Kitchen and bathroom updates — Updating these areas will improve the home's functionality and appeal to potential buyers/renters. ↑
- Both Roof and exterior repairs — These repairs will address safety concerns and improve the home's overall appearance and value. ↑
- Both HVAC and mechanical updates — Upgrading these systems will improve the home's comfort and energy efficiency, attracting more potential buyers/renters. ↑
- Both Foundation and structural repairs — These repairs will ensure the home's structural integrity and attract more potential buyers/renters. ↑
- Both Windows and glass replacement — New windows will improve energy efficiency, reduce heating and cooling costs, and enhance the home's curb appeal and value. ↑
- Both Landscaping and curb appeal — A well-maintained and attractive exterior will increase the home's curb appeal and attract more potential buyers/renters. ↑
ⓘ Cost ranges are severity-bucket heuristics (US national rule-of-thumb). Get contractor quotes + a written scope before underwriting a rehab budget.
Schools (NCES district)
- District
- Blue Springs R-IV
- NCES district ID
- 2905310
- Math proficiency
- 55% ▼ -10.00%
- Reading proficiency
- 60% ▼ -6.00%
- Median HH income
- $67,959
- Composite
- 50.71/100
- National rank
- #1819
- State rank
- #17 of 324 in MO
Livability — Blue Springs
- Score
- 82/100
- State rank
- #11
- US rank
- #1297
Category grades
Schools grade is shown separately in the Schools card above.
Census & demographics
- Census place
- Blue Springs, MO
- County
- Jackson County · 687,798 people
- City population
- 61,033
- Metro
- Kansas City, MO-KS
- Population (ZIP)
- 28,788
- Household income
- $90,337
- Rent vs Own
- Severe rent burden
- 888.0
Population outlook (Jackson County) Hauer SSP2
- Today (2025)
- 719,589 people
- By 2030
- 731,456 · +1.6%
- By 2040
- 746,689 · +3.8%
- By 2050
- 749,289 · +4.1%
- By 2075
- 736,227 · +2.3%
- By 2100
- 668,210 · -7.1%
Race, ethnicity, and origin ACS 2023
- Neighborhood character
- Predominantly White (76%)
- Race & ethnicity
- White 76% Hispanic / Latino 10% Two or more races 8% Black 8% Asian 1%
- Hispanic origin (detail)
- Mexican 7%
- Common ancestry
- Italian 10% Romanian 2% Lithuanian 2%
- Foreign-born
- 3% · Canada, South Korea
- Languages at home
- 94% English-only · Spanish 5%
Political lean MEDSL · Jackson
- 2024 margin
- D (+19.3) · D 58.9% · R 39.5% · Other 1.6%
- 2008→2024 swing
- -6.1pp toward R · 2008: 25.4pp · 2024: 19.3pp
- All cycles
- 2024: D+19.3 2020: D+22.0 2016: D+16.6 2012: D+19.0 2008: D+25.4
Not yet ingested
- Civics
- —
Market trends
- HPI YoY
- ▼ -187.52%
- Current HPI
- 236.8685
- Rent YoY
- ▲ 5.12%
- Metro
- Kansas City, MO-KS
- State GDP YoY
- ▲ 1.84%
- F500 in state
- 20
Industry mix (Fortune 500 HQ in MO)
| Industry | F500 HQs | Revenue |
|---|---|---|
| Healthcare | 1 | $163B |
|
||
| Insurance | 1 | $21B |
|
||
| Industrial Technology | 1 | $17B |
|
||
| Retail | 1 | $16B |
|
||
| Industrial Distribution | 1 | $10B |
|
||
| Utilities | 1 | $9B |
|
||
Price history
+121.2% since first listed10 events — show timeline
- 2026-06-12 Pending — Heartland MLS as Distributed by MLS Grid
- 2026-06-06 Contingent — Heartland MLS as Distributed by MLS Grid
- 2026-05-21 Listed $182,500 Heartland MLS as Distributed by MLS Grid
- 2026-05-05 Coming Soon $182,500 Heartland MLS as Distributed by MLS Grid
- 2013-07-15 Sold (MLS) — Heartland MLS as Distributed by MLS Grid
- 2013-06-10 Listed $50,000 Heartland MLS as Distributed by MLS Grid
- 2005-05-02 Sold (MLS) — Heartland MLS as Distributed by MLS Grid
- 2005-02-21 Listed $87,500 Heartland MLS as Distributed by MLS Grid
- 2004-04-30 Sold (MLS) — Heartland MLS as Distributed by MLS Grid
- 2004-01-12 Listed $82,500 Heartland MLS as Distributed by MLS Grid
Cash-flow waterfall
monthlySold comps — $/sqft
last 12 mo · ≤1 miLoading sold comps…