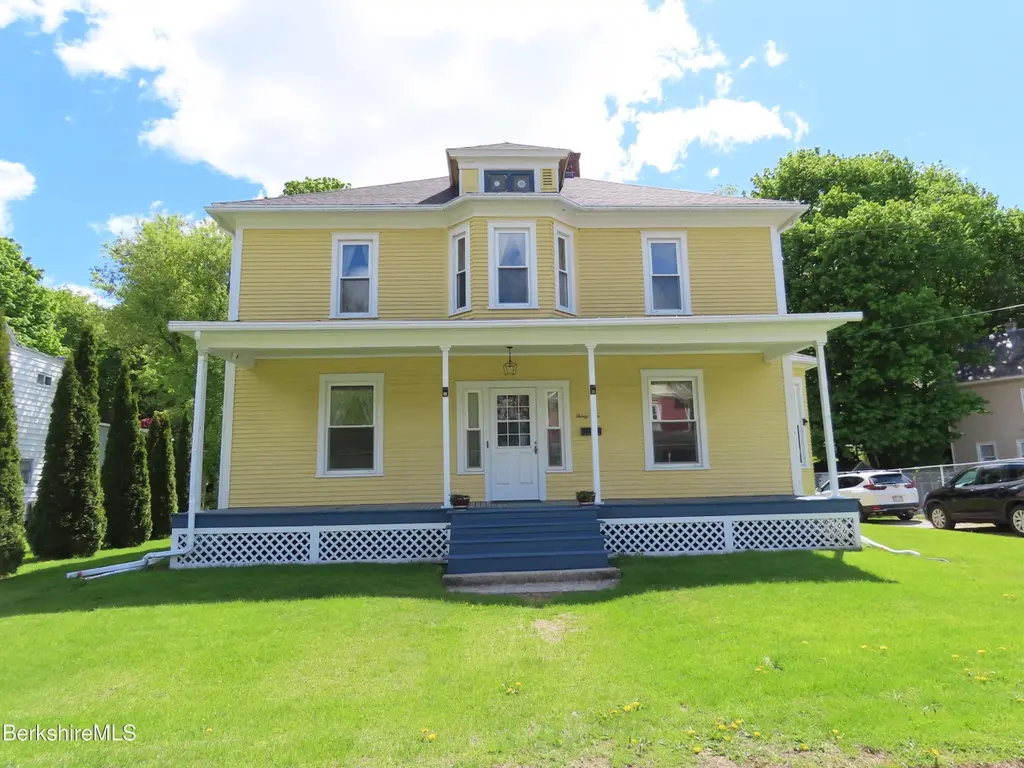
34 Goodrich St · North Adams, MA
Flood risk 5/10 · Moderate
- FEMA flood zone
- X
- Chance of flooding over 30 yrs
- 0.24%
- Est. flood insurance / yr
- $473 – $860
Fire risk 3/10 · Minor
- Est. fire insurance / yr
- $915 – $1,699
Heat risk 3/10 · Minor
- Hot days now (above 92°F)
- 9 days/yr
- Hot days in 30 yrs
- 21 days/yr
Wind risk 4/10 · Minor
- Chance of severe wind over 30 yrs
- 8.0%
Air-quality risk 2/10 · Minimal
- Unhealthy air days now
- 0 days/yr
- Unhealthy air days in 30 yrs
- 1 days/yr
Risk factors via First Street. Map © Google.
Why this score? — see what drove the C- grade
The composite is a weighted blend of 9 inputs, each scored 0–100. Each bar is that input's sub-score; the figure is the points it added to the 100-point composite (weight × sub-score).
- Cash flow +18.4/30.0
- ARV discount +14.4/15.0
- DSCR +5.8/10.0
- 1% rule +4.5/10.0
- Livability +2.8/5.0
- Rent growth +2.5/5.0
- Condition / age +2.5/5.0
- Appreciation +1.9/10.0
- Schools +1.8/10.0
$259,900
🖨 Deal sheet 📄 Offer letter ✓ Due diligence
Listing remarks
Priced to Sell! North Adams. Located between downtown North Adams and close to Williamstown this home boasts 4 large bedrooms with closets & 1-1/2 baths. Kitchen with pantry / laundry. Large formal dining room, living room and den. This well maintained home is turn-key and is ready for sale. Vinyl windows throughout. Full basement with walk out to back yard. Full attic super for storage. Roof only 3 years old and exterior painted about 1-1/2 years ago. Beautiful large yard with garden shed & 2-car garage. Plenty of off street parking. Fairly quiet neighborhood Come take a look for yourself!
Key facts
- Pantry
- Formal dining room
- Living room
Tags
Property features AI
Exterior
- Parking: Garage and off-street parking; 2-car garage
- Utilities: 60 Amp electric service with fuses; Public sewer
- Home design: Single property (building area approximately 2245 total)
- Exterior features: Porch; Outbuilding
Interior
- Kitchen: Dishwasher; Microwave
- Bedrooms: Total of 8 rooms (includes bedrooms and living spaces)
- Flooring: Wood
- Bathrooms: 1 full bathroom; 1 half bathroom
- Heating & cooling: Oil heating
- Interior features: Wood flooring; Porch; Outbuilding
- Laundry & utility: Washer; Dryer
Neighborhood map
What this means for you Summary
Snapshot
- This is a 4-bed/1.5-bath single-family listed at $260k.
Deal economics
- At list price, monthly cash flow is $243 ($3k/yr) — positive.
- The deal already cash-flows at list — no discount required.
- To meet the 1% rule (rent ≥ 1% of price), the offer needs to be $248k (4.8% below list).
- Recommended offer: $248k (4.8% below list) — sets the bar for 1% rule.
- Cap rate 7.4% vs local median 5.8% in North Adams — meaningfully above typical; check what's discounted (condition, days-on-market, listing class) to confirm the premium yield is real.
Location & tenants
- Location reads 55/100 on livability (#242 in MA) — a working-class tenant base; expect higher turnover. Strengths: housing A+, cost of living A-; Watch: employment C-, health & safety D, crime F.
- North Adams (town): math 14% / reading 29% proficiency, ranked #291 of 302 in MA (top 96%) — low school quality limits family demand, transient renter base, plan for 1-2y turnover.
- Zoned schools: Brayton (math 8% / reading 27%, grade F, #819 of 938 statewide, top 88%, 228 students, 0% FRL); Drury High (math 16% / reading 24%, grade F, #308 of 343 statewide, top 91%, 493 students, 0% FRL) — zoned schools average 0% FRL vs 53% district-wide (53 pts lower); this property's tenant base skews higher-income than the district average.
- Market conditions: 99 active listings in the ZIP; 1 comparable units currently listed for rent nearby; 130 units permitted in Berkshire County in 2024 (10 in 5+ unit buildings).
Forward outlook
- Local home prices are declining (-3.0%/yr); year-one equity from $2k of loan paydown is wiped out by about $8k of value loss. Plan a longer hold.
- Berkshire County population projected at -24% by 2050 — secular population decline; favor cash flow + early exit over multi-decade hold.
Negotiation context
- It's been on market 35 days — a 3% lower offer ($252k) is reasonable based on typical stale-listing flexibility.
- 2 sale attempts with the ask held roughly flat each time — persistent listings suggest the price (not the market) is what's stuck; bring a comps-based counter.
Risks & watch-outs
- Watch-outs: built in 1900 — expect roof / HVAC / electrical / plumbing capex.
- Climate carrying-cost: moderate flood risk — expect insurance premiums to compound above CPI over the hold.
Questions for the listing agent
- It's been on market 35 days. Have you received any prior offers? Is the seller open to a 5% concession, seller financing, or rate buy-down credit?
- Built in 1900 — when were the roof, HVAC, electrical panel, plumbing, and water heater last replaced?
- Is there a deadline driving the sale (1031 exchange, divorce, estate, relocation)? That informs how much negotiation room exists.
- Schools are F-rated, which usually means shorter tenancies and higher turnover. Who's the typical renter profile here, and what's been the actual vacancy rate?
- Crime grade is F in this area — have there been break-ins, vandalism, or insurance claims at this property in the last 3 years? What carrier currently insures it and at what premium?
- What's the average days-on-market for RENTAL listings here right now (not sales)? A rising rental-DOM trend means longer vacancies and softer asking-rent achievability than the comps imply.
- What's the recent tenant-quality profile in this submarket — average credit score on applications, eviction rate, late-payment / NSF rate, and stable-employment percentage? A property-management company in the area should have these aggregated.
- How much new for-sale + rental construction is in the pipeline within 1–3 miles? Heavy new supply typically softens prices + rents 12–24 months out; constrained supply supports both.
Investment metrics
- 1% rule
- 0.95% ✗
- Cap rate
- 7.42%
- Cash-on-cash
- 4.01%
- DSCR
- 1.18
- GRM
- 8.8
CMA / ARV
- ARV (median comp)
- $306,857
- List price
- $259,900
- Delta
- -15.30%
- Verdict
- UNDERPRICED
- Comps
- 20 within 1.0 mi
Show comp detail 5 sales within ~0.75 mi
| Address | Dist | Beds/Ba | Sqft | Sold | Price | $/sf | Match |
|---|---|---|---|---|---|---|---|
| 55 Marion | 0.21mi | 4/1.5 | 2,319 (+3%) | 22mo | $470,000 | $203 | 66 |
| 160 Marion Ave | 0.36mi | 4/2.0 | 2,075 (-8%) | 9mo | $459,000 | $221 | 61 |
| 145 Marion Ave | 0.36mi | 3/1.5 (-1) | 2,083 (-7%) | 8mo | $426,900 | $205 | 60 |
| 16 Woodlawn Ave | 0.69mi | 3/2.5 (-1) | 2,198 (-2%) | 9mo | $410,000 | $187 | 48 |
| 41 Biltmore Ave | 0.61mi | 3/1.0 (-1) | 2,534 (+13%) | 23mo | $350,000 | $138 | 24 |
Match score weights: distance 35% · size 25% · config 20% · recency 20%. Top-matched comps best support the ARV.
Projected returns pro-forma
-3.0% appreciation · 3.0% rent growth · sell at horizon
- IRR
- -10.0%
- Equity multiple
- 0.63×
- Total profit
- $-26,646
- Equity at exit
- $38,752
- IRR
- -0.7%
- Equity multiple
- 0.95×
- Total profit
- $-3,324
- Equity at exit
- $22,471
Cash invested: $72,772 (down + closing). Projections, not guarantees.
Landlord ↔ Tenant lean methodology
- Overall (STATE)
- 20 Strongly Tenant-Friendly
- State Massachusetts
- 20 Strongly Tenant-Friendly · D+15
- County
- — inherits STATE
- City
- — inherits STATE
ZIP-level market 01247
- Home prices YoY
- -2.0%
- Active inventory
- 99
- Price-to-rent
- 8.8×
Monthly cashflow live
- Estimated rent
- $2,475 medium interval (Pro) →
- Mortgage (P&I)
- −$1,363
- Tax from tax record
- −$241 /mo · $2,891/yr
- Insurance
- −$108
- HOA
- −$0
- Vacancy / Maint / Mgmt
- −$520
- Net cashflow
- $243
Break-even live
UW: 25.0% down · 7.5% · 30yr · 1.5% tax · 5.0% vac · 8.0% maint · 8.0% mgmt
Financing live
Cash to close
- Down payment
- $64,975
- Closing costs
- $7,797
- Reserves months
- —
- Total cash needed
- —
Loan-product check · same deal, 3 products live
Conventional
25% down · 7.5% · 30yr
- Down + closing
- —
- Monthly P&I
- —
- Monthly cashflow
- —
- DSCR
- —
- Eligible?
- —
Personal DTI + credit; lowest rate.
DSCR
20% down · 8.5% · 30yr
- Down + closing
- —
- Monthly P&I
- —
- Monthly cashflow
- —
- DSCR
- —
- Eligible?
- —
No personal income docs; deal must DSCR.
Hard money
10% down · 12.0% · 12mo
- Down + closing
- —
- Monthly P&I
- —
- Monthly cashflow
- —
- DSCR
- —
- Eligible?
- —
Short-term bridge; refi at stabilization.
Rent comps 1 comps
| Address | Beds | Baths | Sqft | Rent | $/sqft | DOM | Units | Dist |
|---|---|---|---|---|---|---|---|---|
| 40 Cady St North Adams, MA | 3.0 | 1.5 | 1467 | $2,475 | $1.69 | 43d | 1 | 0.77mi |
Listing history 20 events
-
2026-06-18days on market $259,900 Active 35 DOM
-
2026-06-17days on market $259,900 Active 34 DOM
-
2026-06-16days on market $259,900 Active 33 DOM
-
2026-06-15days on market $259,900 Active 32 DOM
-
2026-06-13days on market $259,900 Active 30 DOM
-
2026-06-12days on market $259,900 Active 29 DOM
-
2026-06-09days on market $259,900 Active 26 DOM
-
2026-06-08days on market $259,900 Active 25 DOM
-
2026-06-07days on market $259,900 Active 24 DOM
-
2026-06-07days on market $259,900 Active 23 DOM
-
2026-06-04days on market $259,900 Active 20 DOM
-
2026-06-02days on market $259,900 Active 19 DOM
-
2026-06-01days on market $259,900 Active 18 DOM
-
2026-05-31days on market $259,900 Active 17 DOM
-
2026-05-31days on market $259,900 Active 16 DOM
-
2026-05-12$259,900 Active 616-char remark
-
2026-05-06historical
-
2026-04-15price $339,900
-
2026-03-09price $364,900
-
2025-11-27$399,900 Active
ⓘ Source: listings_history table (triggers on properties + properties_extension) + one-shot
backfill from property_details.listing_events for pre-trigger history.
Tax reassessment forecast MA · Partial reset (capped growth)
- Current annual tax
- $2,891 · $241/mo
- Projected year-2 tax
- $3,044 · $254/mo
- Expected delta
- +$153/yr (+$13/mo · 5.3%)
ⓘ Screening estimate from a state-policy table — verify with the county assessor before closing.
Climate risk First Street
- Flood 5/10 Major FEMA zone X · 24% chance over 30 yrs
- Wildfire 3/10 Moderate
- Heat 3/10 Moderate 9 d/yr ≥92°F today · 21 d/yr by 30 yrs out
- Wind 4/10 Moderate 8% chance of damaging wind over 30 yrs
- Air quality 2/10 Low 0 unhealthy d/yr today · 1 by 30 yrs out
Nearby sold comps map
Loading sold comps map…
Walkable amenities ~0.75 mi
Loading nearby amenities…
Taxation est. · year 1
- Rental income
- $29,700
- − Mortgage interest
- −$14,558
- − Property taxes
- −$2,891
- − Insurance
- −$1,300
- − Repairs & maintenance
- −$2,376
- − Management
- −$2,376
- − Depreciation
- −$7,561
- Taxable loss
- −$1,362
- Est. tax savings @ 24.0%
- +$327
- After-tax cash flow
- $3,244/yr
For passive investors: Depreciation is non-cash, so a rental often shows a tax loss while cash-flowing — sheltering income. Rental losses are passive: they offset passive income freely, and up to $25,000/yr can offset ordinary (W-2) income if you actively participate and your MAGI is under $100k (phasing out to $0 by $150k); unused losses carry forward. On sale, claimed depreciation is recaptured at up to 25%, and gains may owe capital-gains tax (a 1031 exchange can defer both). Figures are a year-1 estimate at your 24.0% rate — not tax advice; consult a CPA.
Schools (NCES district)
- District
- North Adams
- NCES district ID
- 2508670
- Math proficiency
- 14% ▼ -13.00%
- Reading proficiency
- 29% ▼ -11.00%
- Median HH income
- $36,746
- Composite
- 17.83/100
- National rank
- #9006
- State rank
- #291 of 302 in MA
Livability — North Adams
- Score
- 55/100
- State rank
- #242
- US rank
- #23506
Category grades
Schools grade is shown separately in the Schools card above.
Census & demographics
- Census place
- North Adams, MA
- City population
- 14,967
- Population (ZIP)
- 14,967
Population outlook (Berkshire County) Hauer SSP2
- Today (2025)
- 119,723 people
- By 2030
- 114,608 · -4.3%
- By 2040
- 102,806 · -14.1%
- By 2050
- 91,305 · -23.7%
- By 2075
- 71,517 · -40.3%
- By 2100
- 57,988 · -51.6%
Race, ethnicity, and origin ACS 2023
- Neighborhood character
- Predominantly White (88%)
- Race & ethnicity
- White 88% Hispanic / Latino 5% Two or more races 4% Asian 3%
- Hispanic origin (detail)
- Puerto Rican 1%
- Common ancestry
- Lithuanian 15% Romanian 4% German 2%
- Foreign-born
- 5% · Canada
- Languages at home
- 95% English-only · Other Indo-European 2% Spanish 2% French/Haitian/Cajun 0%
Political lean MEDSL · Berkshire
- 2024 margin
- Solid D (+39.9) · D 68.9% · R 29.0% · Other 2.1%
- 2008→2024 swing
- -12.5pp toward R · 2008: 52.4pp · 2024: 39.9pp
- All cycles
- 2024: D+39.9 2020: D+47.1 2016: D+41.5 2012: D+53.7 2008: D+52.4
Not yet ingested
- Civics
- —
Market trends
- HPI YoY
- ▼ -6.22%
- Current HPI
- 298.8949
- Rent YoY
- —
- Metro
- —
- State GDP YoY
- ▲ 2.28%
- F500 in state
- 38
Industry mix (Fortune 500 HQ in MA)
| Industry | F500 HQs | Revenue |
|---|---|---|
| Technology | 3 | $17B |
|
||
| Insurance | 2 | $84B |
|
||
| Retail | 2 | $76B |
|
||
| Life Sciences | 1 | $43B |
|
||
| Energy Technology | 1 | $31B |
|
||
| Aerospace / Defense | 1 | $18B |
|
||
Price history
-35.0% since first listed5 events — show timeline
- 2026-05-12 Listed $259,900 BCMLS
- 2026-05-06 Listing Removed — BCMLS
- 2026-04-15 Price Changed $339,900 BCMLS
- 2026-03-09 Price Changed $364,900 BCMLS
- 2025-11-27 Listed $399,900 BCMLS
Property tax history
+5.3%/yrLatest (2023): $2,891 · +10.3% YoY. Source: county tax records.
Cash-flow waterfall
monthlySold comps — $/sqft
last 12 mo · ≤1 miLoading sold comps…