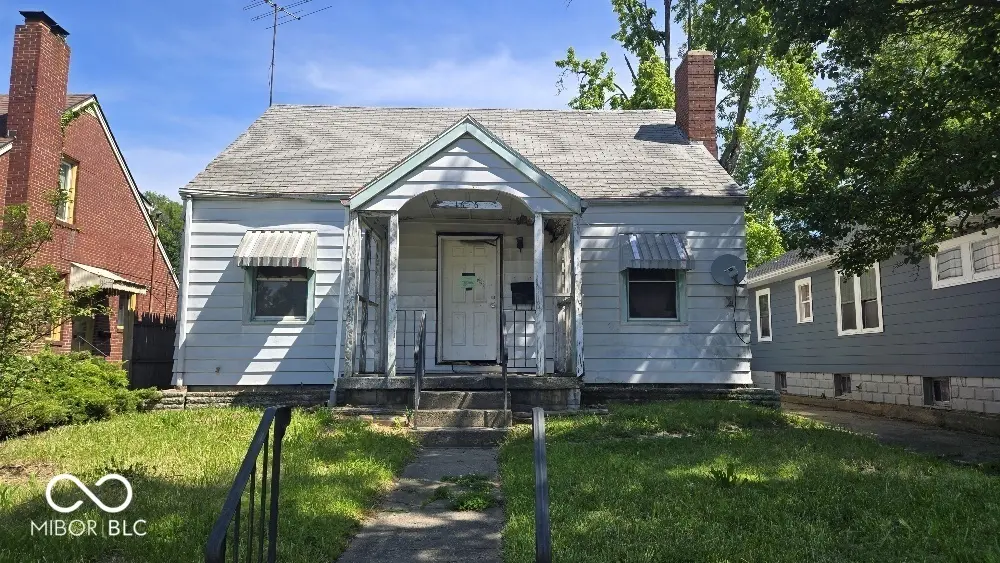
1626 W 8th St · Anderson, IN
Flood risk 1/10 · Minimal
- FEMA flood zone
- X (unshaded)
- Chance of flooding over 30 yrs
- 0.0%
- Est. flood insurance / yr
- $473 – $860
Fire risk 1/10 · Minimal
- Est. fire insurance / yr
- $717 – $1,331
Heat risk 3/10 · Minor
- Hot days now (above 100°F)
- 7 days/yr
- Hot days in 30 yrs
- 18 days/yr
Wind risk 2/10 · Minimal
- Chance of severe wind over 30 yrs
- —
Air-quality risk 3/10 · Minor
- Unhealthy air days now
- 2 days/yr
- Unhealthy air days in 30 yrs
- 3 days/yr
Risk factors via First Street. Map © Google.
Why this score? — see what drove the D grade
The composite is a weighted blend of 9 inputs, each scored 0–100. Each bar is that input's sub-score; the figure is the points it added to the 100-point composite (weight × sub-score).
- Cash flow +15.0/30.0
- ARV discount +7.5/15.0
- 1% rule +5.0/10.0
- DSCR +5.0/10.0
- Rent growth +4.5/5.0
- Livability +3.0/5.0
- Condition / age +2.5/5.0
- Schools +1.6/10.0
- Appreciation +0.0/10.0
$14,900
🖨 Deal sheet 📄 Offer letter ✓ Due diligence
Listing remarks MLS
NICE 1 1/2 STORY HOME WITH FIREPLACE IN LIVING ROOM, SOME NEWER CARPET, NEWER OAK CABINETS, HARDWOOD FLOORS UPSTAIRS, LARGE WALK-IN CLOSET UP, 2 CORNER CABINETS IN KITCHEN, CERAMIC TILE FLOOR IN BATH & KITCHEN.
Key facts
- 6,210 sq ft lot
- Garage
- Built 1941
Property features AI
Exterior
- Parking: No designated parking spaces; Garage area reported as 360 sq ft but zero garage spaces listed
- Utilities: Public water; Municipal sewer connected; Solid waste service available
- Home design: Single-family residence; Two levels
- Construction: Block foundation; Aluminum siding
- Exterior features: Lot approximately 0.14 acres (under 1/4 acre)
Interior
- Kitchen: No appliances listed
- Bedrooms: Three bedrooms total — two on the main level and one on the upper level
- Bathrooms: One full bathroom
- Heating & cooling: No heating provided; No cooling provided
- Interior features: 7 total rooms; Living room; Dining room; Loft; Has basement
- Laundry & utility: No laundry appliances listed
Neighborhood map
What this means for you Summary
Snapshot
- This is a 3-bed/2.0-bath single-family listed at $15k.
Deal economics
- At list price, monthly cash flow is $811 ($10k/yr) — positive.
- The deal already cash-flows at list — no discount required.
- Meets the 1% rule at list price ($1k rent vs $15k).
- Recommended offer: $15k (1.5% below list) — sets the bar for market timing.
- Cap rate 71.6% vs local median 6.5% in Anderson — top-decile yield for the area; either an underpriced asset or a hidden risk that comps aren't pricing in. Stress-test before assuming the spread holds.
Location & tenants
- Location reads 60/100 on livability (#521 in IN) — a middle-class / working-renter tenant base. Strengths: cost of living A+, housing A+; Watch: schools F, crime D-, amenities F.
- Anderson Community School Corporation (urban): math 15% / reading 23% proficiency, ranked #280 of 301 in IN (top 93%) — low school quality limits family demand, transient renter base, plan for 1-2y turnover; 70% free/reduced lunch — lower-income household profile, screen leases tightly.
- Market conditions: Rents rising fast (+7.9%/yr); 185 active listings in the ZIP; 15 comparable units currently listed for rent nearby; rentals at typical pace (median 24d on market — plan ~3-4 weeks tenant-placement turnaround); 47% of comp listings sitting > 30 days — soft ceiling on asking rent; lower-income renter base — watch delinquency; 184 units permitted in Madison County in 2024 (0 in 5+ unit buildings).
- This rent runs 39% of the median local income ($36k/yr) — at the standard rent-burdened threshold; future hikes will face affordability resistance.
Forward outlook
- Local home prices are declining (-3.0%/yr); year-one equity from $103 of loan paydown is wiped out by about $447 of value loss. Plan a longer hold.
- Madison County population projected at -14% by 2050 — secular population decline; favor cash flow + early exit over multi-decade hold.
- At projected returns (-3.0% appreciation + 7.9% rent growth), your $4k cash investment doubles in ~1 year — after that, you're playing with house money.
Negotiation context
- It's been on market 15 days — a 2% lower offer ($15k) is reasonable based on typical stale-listing flexibility.
- 2 sale attempts since 23y ago with the ask held roughly flat each time — persistent listings suggest the price (not the market) is what's stuck; bring a comps-based counter.
Risks & watch-outs
- Watch-outs: built in 1941 — expect roof / HVAC / electrical / plumbing capex.
Questions for the listing agent
- Built in 1941 — when were the roof, HVAC, electrical panel, plumbing, and water heater last replaced?
- Is there a deadline driving the sale (1031 exchange, divorce, estate, relocation)? That informs how much negotiation room exists.
- Schools are F-rated, which usually means shorter tenancies and higher turnover. Who's the typical renter profile here, and what's been the actual vacancy rate?
- Crime grade is D in this area — have there been break-ins, vandalism, or insurance claims at this property in the last 3 years? What carrier currently insures it and at what premium?
- The area grade is low — what's the realistic commute time and amenity access for the typical tenant pool here? Any planned neighborhood developments (good or bad) we should know about?
- What's the average days-on-market for RENTAL listings here right now (not sales)? A rising rental-DOM trend means longer vacancies and softer asking-rent achievability than the comps imply.
- What's the recent tenant-quality profile in this submarket — average credit score on applications, eviction rate, late-payment / NSF rate, and stable-employment percentage? A property-management company in the area should have these aggregated.
- How much new for-sale + rental construction is in the pipeline within 1–3 miles? Heavy new supply typically softens prices + rents 12–24 months out; constrained supply supports both.
Investment metrics
- 1% rule
- 7.77% ✓
- Cap rate
- 71.63%
- Cash-on-cash
- 233.35%
- DSCR
- 11.38
- GRM
- 1.1
CMA / ARV
- ARV (on-the-fly)
- $119,784
- Comps found
- 12
Show comp detail 12 sales within ~0.75 mi
| Address | Dist | Beds/Ba | Sqft | Sold | Price | $/sf | Match |
|---|---|---|---|---|---|---|---|
| 1329 W 3rd St | 0.36mi | 2/1.0 (-1) | 1,752 (+1%) | 2mo | $105,000 | $60 | 71 |
| 1120 W 9th St | 0.35mi | 3/1.0 | 1,824 (+5%) | 2mo | $125,000 | $69 | 70 |
| 1008 Malibu Dr | 0.55mi | 3/2.0 | 1,769 (+2%) | 2mo | $205,000 | $116 | 70 |
| 1019 W 9th St | 0.41mi | 3/2.0 | 1,830 (+5%) | 5mo | $95,000 | $52 | 68 |
| 1201 Arrow Ave | 0.31mi | 3/1.0 | 1,621 (-7%) | 10mo | $66,000 | $41 | 62 |
| 1217 W 6th St | 0.29mi | 3/1.0 | 1,848 (+6%) | 13mo | $149,900 | $81 | 61 |
| 1531 W 15th St | 0.52mi | 4/1.5 (+1) | 1,740 (+0%) | 10mo | $115,000 | $66 | 60 |
| 711 Madison Ave | 0.43mi | 3/2.0 | 1,506 (-13%) | 7mo | $135,000 | $90 | 52 |
| 904 W 6th St | 0.53mi | 3/1.0 | 1,556 (-10%) | 6mo | $102,000 | $66 | 49 |
| 1314 Arrow Ave | 0.41mi | 3/1.0 | 1,476 (-15%) | 12mo | $103,000 | $70 | 42 |
| 912 W 1st St | 0.67mi | 2/1.0 (-1) | 1,554 (-10%) | 4mo | $108,000 | $69 | 39 |
| 1702 Arrow Ave | 0.65mi | 3/1.0 | 1,983 (+14%) | 4mo | $59,900 | $30 | 38 |
Match score weights: distance 35% · size 25% · config 20% · recency 20%. Top-matched comps best support the ARV.
Projected returns pro-forma
-3.0% appreciation · 7.88% rent growth · sell at horizon
- IRR
- —
- Equity multiple
- 14.24×
- Total profit
- $55,236
- Equity at exit
- $2,222
- IRR
- —
- Equity multiple
- 34.98×
- Total profit
- $141,771
- Equity at exit
- $1,288
Cash invested: $4,172 (down + closing). Projections, not guarantees.
Landlord ↔ Tenant lean methodology
- Overall (STATE)
- 90 Strongly Landlord-Friendly
- State Indiana
- 90 Strongly Landlord-Friendly · R+11
- County
- — inherits STATE
- City
- — inherits STATE
ZIP-level market 46016
- Home prices YoY
- -3.5%
- Rents YoY
- 7.9%
- Active inventory
- 185
- Price-to-rent
- 1.1×
Monthly cashflow live
- Estimated rent
- $1,157 high interval (Pro) →
- Mortgage (P&I)
- −$78
- Tax est. 1.5%
- −$19 /mo · $224/yr
- Insurance
- −$6
- HOA
- −$0
- Vacancy / Maint / Mgmt
- −$243
- Net cashflow
- $811
Break-even live
UW: 25.0% down · 7.5% · 30yr · 1.5% tax · 5.0% vac · 8.0% maint · 8.0% mgmt
Financing live
Cash to close
- Down payment
- $3,725
- Closing costs
- $447
- Reserves months
- —
- Total cash needed
- —
Loan-product check · same deal, 3 products live
Conventional
25% down · 7.5% · 30yr
- Down + closing
- —
- Monthly P&I
- —
- Monthly cashflow
- —
- DSCR
- —
- Eligible?
- —
Personal DTI + credit; lowest rate.
DSCR
20% down · 8.5% · 30yr
- Down + closing
- —
- Monthly P&I
- —
- Monthly cashflow
- —
- DSCR
- —
- Eligible?
- —
No personal income docs; deal must DSCR.
Hard money
10% down · 12.0% · 12mo
- Down + closing
- —
- Monthly P&I
- —
- Monthly cashflow
- —
- DSCR
- —
- Eligible?
- —
Short-term bridge; refi at stabilization.
Rent comps 15 comps
| Address | Beds | Baths | Sqft | Rent | $/sqft | DOM | Units | Dist |
|---|---|---|---|---|---|---|---|---|
| 1121 Victory Ct Anderson, IN | 3.0 | 1.0 | 2053 | $1,295 | $0.63 | 22d | 1 | 0.28mi |
| 1212 W 5th St Anderson, IN | 3.0 | 1.0 | 1252 | $1,295 | $1.03 | 12d | 1 | 0.35mi |
| 1310 W 13th St Anderson, IN | 2.0 | 1.0 | 1178 | $895 | $0.76 | 2d | 1 | 0.40mi |
| 921 W 9th St Anderson, IN | 3.0 | 2.0 | 1611 | $1,375 | $0.85 | 23d | 1 | 0.48mi |
| 820 W 7th St Apt A Anderson, IN | 2.0 | 2.0 | 1400 | $1,200 | $0.86 | 23d | 1 | 0.56mi |
| 1404 Walton St Anderson, IN | 3.0 | 1.0 | 1090 | $995 | $0.91 | 43d | 1 | 0.57mi |
| 1502 Cedar St Anderson, IN | 2.0 | 1.0 | 1104 | $850 | $0.77 | 43d | 1 | 0.62mi |
| 1532 Walton St Anderson, IN | 3.0 | 1.0 | 1342 | $1,100 | $0.82 | 43d | 1 | 0.66mi |
| 510 W 5th St Anderson, IN | 3.0 | 1.5 | 1617 | $995 | $0.62 | 43d | 1 | 0.75mi |
| 120 W 10th St Anderson, IN | 1.0–3.0 | 1.0 | 1066 | $1,150 | $1.08 | 1d | 1 | 0.98mi |
| 229 W 19th St Anderson, IN | 3.0 | 1.0 | 1200 | $1,000 | $0.83 | 43d | 1 | 1.15mi |
| 2916 W 12th St Anderson, IN | 3.0 | 1.0 | 1271 | $1,295 | $1.02 | 43d | 1 | 1.16mi |
| 2233 Fairview St Anderson, IN | 3.0 | 1.5 | 1452 | $1,195 | $0.82 | 23d | 1 | 1.19mi |
| 2613 Louise St Anderson, IN | 2.0 | 1.0 | 1096 | $950 | $0.87 | 22d | 1 | 1.31mi |
| 2203 W 28th St Anderson, IN | 3.0 | 1.0 | 1068 | $1,000 | $0.94 | 43d | 1 | 1.45mi |
Listing history 12 events
-
2026-06-13statusdays on market $14,900 Pending 15 DOM
-
2026-06-09days on market $14,900 Active 11 DOM
-
2026-06-08days on market $14,900 Active 10 DOM
-
2026-06-07days on market $14,900 Active 9 DOM
-
2026-06-05days on market $14,900 Active 6 DOM
-
2026-06-03days on market $14,900 Active 5 DOM
-
2026-06-02days on market $14,900 Active 4 DOM
-
2026-06-01days on market $14,900 Active 3 DOM
-
2026-05-31days on market $14,900 Active 2 DOM
-
2026-05-28$14,900 Active
-
2003-10-24soldstatus $58,700 214-char remark
Show marketing remark (214 chars)
NICE 1 1/2 STORY HOME WITH FIREPLACE IN LIVING ROOM, SOME NEWER CARPET, NEWER OAK CABINETS, HARDWOOD FLOORS UPSTAIRS, LARGE WALK-IN CLOSET UP, 2 CORNER CABINETS IN KITCHEN, CERAMIC TILE FLOOR IN BATH & KITCHEN.
-
2003-07-25$59,900 214-char remark
Show marketing remark (214 chars)
NICE 1 1/2 STORY HOME WITH FIREPLACE IN LIVING ROOM, SOME NEWER CARPET, NEWER OAK CABINETS, HARDWOOD FLOORS UPSTAIRS, LARGE WALK-IN CLOSET UP, 2 CORNER CABINETS IN KITCHEN, CERAMIC TILE FLOOR IN BATH & KITCHEN.
ⓘ Source: listings_history table (triggers on properties + properties_extension) + one-shot
backfill from property_details.listing_events for pre-trigger history.
Climate risk First Street
- Flood 1/10 Low FEMA zone X (unshaded) · 0% chance over 30 yrs
- Wildfire 1/10 Low
- Heat 3/10 Moderate 7 d/yr ≥100°F today · 18 d/yr by 30 yrs out
- Wind 2/10 Low
- Air quality 3/10 Moderate 2 unhealthy d/yr today · 3 by 30 yrs out
Nearby sold comps map
Loading sold comps map…
Walkable amenities ~0.75 mi
Loading nearby amenities…
Taxation est. · year 1
- Rental income
- $13,887
- − Mortgage interest
- −$835
- − Property taxes
- −$224
- − Insurance
- −$74
- − Repairs & maintenance
- −$1,111
- − Management
- −$1,111
- − Depreciation
- −$433
- Taxable income
- $10,099
- Est. tax owed @ 24.0%
- −$2,424
- After-tax cash flow
- $7,312/yr
For passive investors: Depreciation is non-cash, so a rental often shows a tax loss while cash-flowing — sheltering income. Rental losses are passive: they offset passive income freely, and up to $25,000/yr can offset ordinary (W-2) income if you actively participate and your MAGI is under $100k (phasing out to $0 by $150k); unused losses carry forward. On sale, claimed depreciation is recaptured at up to 25%, and gains may owe capital-gains tax (a 1031 exchange can defer both). Figures are a year-1 estimate at your 24.0% rate — not tax advice; consult a CPA.
Schools (NCES district)
- District
- Anderson Community School Corporation
- NCES district ID
- 1800150
- Math proficiency
- 15% ▼ -14.00%
- Reading proficiency
- 23% ▼ -7.00%
- Median HH income
- $38,208
- Composite
- 15.93/100
- National rank
- #9250
- State rank
- #280 of 301 in IN
Livability — Anderson
- Score
- 60/100
- State rank
- #521
- US rank
- #18709
Category grades
Schools grade is shown separately in the Schools card above.
Census & demographics
- Census place
- Anderson, IN
- County
- Madison County · 69,445 people
- City population
- 57,762
- Metro
- Indianapolis-Carmel-Anderson, IN
- Population (ZIP)
- 17,834
- Household income
- $36,029
- Rent vs Own
- Severe rent burden
- 1193.0
Population outlook (Madison County) Hauer SSP2
- Today (2025)
- 125,800 people
- By 2030
- 122,640 · -2.5%
- By 2040
- 115,420 · -8.3%
- By 2050
- 108,148 · -14.0%
- By 2075
- 91,838 · -27.0%
- By 2100
- 75,670 · -39.8%
Race, ethnicity, and origin ACS 2023
- Neighborhood character
- Diverse neighborhood (Simpson 0.58)
- Race & ethnicity
- White 61% Black 18% Hispanic / Latino 13% Two or more races 11% Native American 1%
- Hispanic origin (detail)
- Mexican 10% Puerto Rican 1%
- Common ancestry
- Italian 2% Slovak 1% Iranian 1%
- Foreign-born
- 4% · Canada
- Languages at home
- 86% English-only · Spanish 12%
Political lean MEDSL · Madison
- 2024 margin
- Strong R (+26.9) · D 35.6% · R 62.5% · Other 1.9%
- 2008→2024 swing
- -33.5pp toward R · 2008: 6.5pp · 2024: -26.9pp
- All cycles
- 2024: R+26.9 2020: R+22.6 2016: R+25.7 2012: R+4.5 2008: D+6.5
Not yet ingested
- Civics
- —
Market trends
- HPI YoY
- ▼ -11.12%
- Current HPI
- 302.7437
- Rent YoY
- ▲ 7.88%
- Metro
- Indianapolis-Carmel-Anderson, IN
- State GDP YoY
- ▲ 2.90%
- F500 in state
- 18
Industry mix (Fortune 500 HQ in IN)
| Industry | F500 HQs | Revenue |
|---|---|---|
| Industrial Machinery | 2 | $37B |
|
||
| Healthcare | 1 | $177B |
|
||
| Pharmaceuticals | 1 | $45B |
|
||
| Metals / Steel | 1 | $18B |
|
||
| Agriculture | 1 | $17B |
|
||
| Packaging | 1 | $12B |
|
||
Price history
-75.1% since first listed3 events — show timeline
- 2026-05-28 Listed $14,900 MIBOR as Distributed by MLS Grid
- 2003-10-24 Sold (MLS) $58,700 MIBOR as Distributed by MLS Grid
- 2003-07-25 Listed $59,900 MIBOR as Distributed by MLS Grid
Property tax history
+3.8%/yrLatest (2024): $1,409 · +8.5% YoY. Source: county tax records.
Cash-flow waterfall
monthlySold comps — $/sqft
last 12 mo · ≤1 miLoading sold comps…