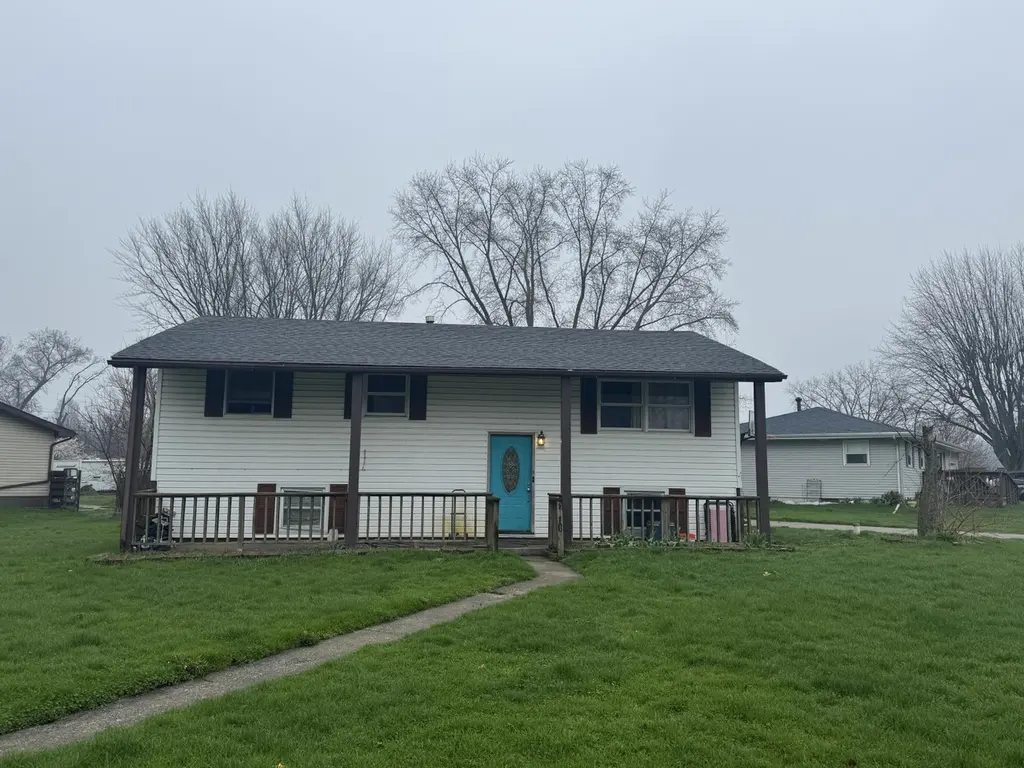
2541 Patricia St · Portage, IN
Flood risk 1/10 · Minimal
- FEMA flood zone
- X (unshaded)
- Chance of flooding over 30 yrs
- 0.0%
- Est. flood insurance / yr
- $507 – $1,088
Fire risk 3/10 · Minor
- Est. fire insurance / yr
- $717 – $1,331
Heat risk 2/10 · Minimal
- Hot days now (above 101°F)
- 7 days/yr
- Hot days in 30 yrs
- 15 days/yr
Wind risk 2/10 · Minimal
- Chance of severe wind over 30 yrs
- 1.0%
Air-quality risk 3/10 · Minor
- Unhealthy air days now
- 3 days/yr
- Unhealthy air days in 30 yrs
- 4 days/yr
Risk factors via First Street. Map © Google.
Why this score? — see what drove the D+ grade
The composite is a weighted blend of 9 inputs, each scored 0–100. Each bar is that input's sub-score; the figure is the points it added to the 100-point composite (weight × sub-score).
- ARV discount +15.0/15.0
- Cash flow +13.3/30.0
- DSCR +4.0/10.0
- Rent growth +3.6/5.0
- Livability +3.6/5.0
- 1% rule +3.2/10.0
- Schools +2.7/10.0
- Condition / age +2.5/5.0
- Appreciation +0.0/10.0
$229,900
🖨 Deal sheet 📄 Offer letter ✓ Due diligence
Listing remarks MLS
Corner lot 5 bedroom 2 bath Bi-level on a cul-de-sac. Kitchen/dining area with door to deck and above ground pool. Walking distance to grade school and Imagination Glen Park. Newer roof and sump pump, water softener rented. City sewer and well.
Key facts
- 1,001 sq ft lot
- Pool
- Built 1964
Neighborhood map
What this means for you Summary
Snapshot
- This is a 4-bed/2.0-bath single-family listed at $230k.
Deal economics
- At list price, monthly cash flow is $-1 ($-13/yr) — negative.
- To cash-flow at today's rent, offer at most $230k (0.1% below list).
- To meet the 1% rule (rent ≥ 1% of price), the offer needs to be $188k (18.1% below list).
- Recommended offer: $188k (18.1% below list) — sets the bar for 1% rule.
- Cap rate 6.3% vs local median 4.0% in Portage — top-decile yield for the area; either an underpriced asset or a hidden risk that comps aren't pricing in. Stress-test before assuming the spread holds.
Location & tenants
- Location reads 72/100 on livability (#111 in IN) — a middle-class / working-renter tenant base. Strengths: cost of living A+, housing A+, health & safety A; Watch: schools D, amenities F, commute F.
- Portage Township Schools (suburban): math 26% / reading 36% proficiency, ranked #221 of 301 in IN (top 73%) — families likely to look elsewhere, expect single-tenant / working-renter base with shorter leases.
- Market conditions: Rents rising fast (+4.3%/yr); 311 active listings in the ZIP; solid renter incomes; 542 units permitted in Porter County in 2024 (0 in 5+ unit buildings).
Forward outlook
- Local home prices are declining (-3.0%/yr); year-one equity from $2k of loan paydown is wiped out by about $7k of value loss. Plan a longer hold.
- Porter County population projected at +6% by 2050 — modest demand growth; plan on rents tracking national, not racing it.
Negotiation context
- It's been on market 69 days — a 6% lower offer ($216k) is reasonable based on typical stale-listing flexibility.
- 2 sale attempts since 11y ago; this cycle's ask has dropped $19k (8%) from the opening price — seller is motivated, your offer sets the floor, not the list.
- Current owner paid $120k; list at $230k implies a 92% gain — meaningful room to come down on a strong offer.
Questions for the listing agent
- What do current leases actually rent for vs. the listed asking? Can we see a recent rent roll and the last 12 months of T-12 income?
- It's been on market 69 days. Have you received any prior offers? Is the seller open to a 18% concession, seller financing, or rate buy-down credit?
- Built in 1964 — when were the roof, HVAC, electrical panel, plumbing, and water heater last replaced?
- Why hasn't it sold? Are there any deal-killer items the seller is aware of (foundation, flood, title, zoning, code violations)?
- Is there a deadline driving the sale (1031 exchange, divorce, estate, relocation)? That informs how much negotiation room exists.
- Schools are D-rated, which usually means shorter tenancies and higher turnover. Who's the typical renter profile here, and what's been the actual vacancy rate?
- The area grade is low — what's the realistic commute time and amenity access for the typical tenant pool here? Any planned neighborhood developments (good or bad) we should know about?
- What's the average days-on-market for RENTAL listings here right now (not sales)? A rising rental-DOM trend means longer vacancies and softer asking-rent achievability than the comps imply.
- What's the recent tenant-quality profile in this submarket — average credit score on applications, eviction rate, late-payment / NSF rate, and stable-employment percentage? A property-management company in the area should have these aggregated.
- How much new for-sale + rental construction is in the pipeline within 1–3 miles? Heavy new supply typically softens prices + rents 12–24 months out; constrained supply supports both.
Investment metrics
- 1% rule
- 0.82% ✗
- Cap rate
- 6.29%
- Cash-on-cash
- -0.02%
- DSCR
- 1.00
- GRM
- 10.2
CMA / ARV
- ARV (median comp)
- $330,100
- List price
- $229,900
- Delta
- -30.35%
- Verdict
- UNDERPRICED
- Comps
- 20 within 1.0 mi
Show comp detail 8 sales within ~0.75 mi
| Address | Dist | Beds/Ba | Sqft | Sold | Price | $/sf | Match |
|---|---|---|---|---|---|---|---|
| 6950 Prairie Run Ave | 0.16mi | 3/3.5 (-1) | 2,018 (-3%) | 2mo | $424,900 | $211 | 76 |
| 2355 Mccool Rd | 0.38mi | 5/2.0 (+1) | 1,924 (-8%) | 4mo | $250,000 | $130 | 61 |
| 6936 Superior Ave | 0.53mi | 3/2.5 (-1) | 2,195 (+6%) | 2mo | $275,000 | $125 | 58 |
| 7044 Sherwood Ave | 0.46mi | 5/2.0 (+1) | 2,169 (+4%) | 18mo | $275,000 | $127 | 51 |
| 7121 Brentwood Ave | 0.21mi | 4/2.0 | 1,808 (-13%) | 20mo | $206,000 | $114 | 51 |
| 2568 Diane St | 0.07mi | 3/1.0 (-1) | 1,853 (-11%) | 22mo | $256,000 | $138 | 51 |
| 2420 Ontario St | 0.36mi | 3/2.0 (-1) | 1,774 (-15%) | 7mo | $215,000 | $121 | 48 |
| 6927 Nancy Ave | 0.65mi | 4/3.0 | 1,954 (-6%) | 12mo | $332,000 | $170 | 45 |
Match score weights: distance 35% · size 25% · config 20% · recency 20%. Top-matched comps best support the ARV.
Projected returns pro-forma
-3.0% appreciation · 4.29% rent growth · sell at horizon
- IRR
- -15.0%
- Equity multiple
- 0.46×
- Total profit
- $-34,883
- Equity at exit
- $34,279
- IRR
- -4.5%
- Equity multiple
- 0.69×
- Total profit
- $-20,172
- Equity at exit
- $19,878
Cash invested: $64,372 (down + closing). Projections, not guarantees.
Landlord ↔ Tenant lean methodology
- Overall (STATE)
- 90 Strongly Landlord-Friendly
- State Indiana
- 90 Strongly Landlord-Friendly · R+11
- County
- — inherits STATE
- City
- — inherits STATE
ZIP-level market 46368
- Rents YoY
- 4.3%
- Active inventory
- 311
- Price-to-rent
- 10.2×
Monthly cashflow live
- Estimated rent
- $1,883 medium interval (Pro) →
- Mortgage (P&I)
- −$1,206
- Tax from tax record
- −$187 /mo · $2,249/yr
- Insurance
- −$96
- HOA
- −$0
- Vacancy / Maint / Mgmt
- −$395
- Net cashflow
- $-1
Break-even live
UW: 25.0% down · 7.5% · 30yr · 1.5% tax · 5.0% vac · 8.0% maint · 8.0% mgmt
Financing live
Cash to close
- Down payment
- $57,475
- Closing costs
- $6,897
- Reserves months
- —
- Total cash needed
- —
Loan-product check · same deal, 3 products live
Conventional
25% down · 7.5% · 30yr
- Down + closing
- —
- Monthly P&I
- —
- Monthly cashflow
- —
- DSCR
- —
- Eligible?
- —
Personal DTI + credit; lowest rate.
DSCR
20% down · 8.5% · 30yr
- Down + closing
- —
- Monthly P&I
- —
- Monthly cashflow
- —
- DSCR
- —
- Eligible?
- —
No personal income docs; deal must DSCR.
Hard money
10% down · 12.0% · 12mo
- Down + closing
- —
- Monthly P&I
- —
- Monthly cashflow
- —
- DSCR
- —
- Eligible?
- —
Short-term bridge; refi at stabilization.
Listing history 20 events
-
2026-06-18days on market $229,900 Active 69 DOM
-
2026-06-17days on market $229,900 Active 68 DOM
-
2026-06-16days on market $229,900 Active 67 DOM
-
2026-06-15days on market $229,900 Active 66 DOM
-
2026-06-13days on market $229,900 Active 64 DOM
-
2026-06-13days on market $229,900 Active 63 DOM
-
2026-06-09days on market $229,900 Active 60 DOM
-
2026-06-08days on market $229,900 Active 59 DOM
-
2026-06-07days on market $229,900 Active 58 DOM
-
2026-06-04days on market $229,900 Active 55 DOM
-
2026-06-03days on market $229,900 Active 54 DOM
-
2026-06-02remarks 311-char remark
-
2026-06-02days on market $229,900 Active 53 DOM
-
2026-06-02remarks 268-char remark
-
2026-06-01days on market $229,900 Active 52 DOM
-
2026-05-31days on market $229,900 Active 51 DOM
-
2026-04-13price $229,900 244-char remark
Show marketing remark (244 chars)
Corner lot 5 bedroom 2 bath Bi-level on a cul-de-sac. Kitchen/dining area with door to deck and above ground pool. Walking distance to grade school and Imagination Glen Park. Newer roof and sump pump, water softener rented. City sewer and well.
-
2026-04-10$249,000 Active 244-char remark
Show marketing remark (244 chars)
Corner lot 5 bedroom 2 bath Bi-level on a cul-de-sac. Kitchen/dining area with door to deck and above ground pool. Walking distance to grade school and Imagination Glen Park. Newer roof and sump pump, water softener rented. City sewer and well.
-
2015-05-14soldstatus $120,000 431-char remark
Show marketing remark (431 chars)
Nice home in quiet neighborhood. Five bedrooms. Hardwood floors in 3 main level bedrooms, hallway, living room, and dining room. Newer windows, Roof 10 years young. Kitchen has been upgraded. All of the wood trim and interior doors have been replaced. Newer wall tile in the baths. Maintenance free vinyl siding, fenced yard, and shed all situated on a corner lot. The seller is offering a top of the line home warranty at closing.
-
2015-01-05$124,900 431-char remark
Show marketing remark (431 chars)
Nice home in quiet neighborhood. Five bedrooms. Hardwood floors in 3 main level bedrooms, hallway, living room, and dining room. Newer windows, Roof 10 years young. Kitchen has been upgraded. All of the wood trim and interior doors have been replaced. Newer wall tile in the baths. Maintenance free vinyl siding, fenced yard, and shed all situated on a corner lot. The seller is offering a top of the line home warranty at closing.
ⓘ Source: listings_history table (triggers on properties + properties_extension) + one-shot
backfill from property_details.listing_events for pre-trigger history.
Tax reassessment forecast IN · Partial reset (capped growth)
- Current annual tax
- $2,249 · $187/mo
- Projected year-2 tax
- $2,249 · $187/mo
- Expected delta
- $0/yr ($0/mo · 0.0%)
ⓘ Screening estimate from a state-policy table — verify with the county assessor before closing.
Climate risk First Street
- Flood 1/10 Low FEMA zone X (unshaded) · 0% chance over 30 yrs
- Wildfire 3/10 Moderate
- Heat 2/10 Low 7 d/yr ≥101°F today · 15 d/yr by 30 yrs out
- Wind 2/10 Low 100% chance of damaging wind over 30 yrs
- Air quality 3/10 Moderate 3 unhealthy d/yr today · 4 by 30 yrs out
Nearby sold comps map
Loading sold comps map…
Walkable amenities ~0.75 mi
Loading nearby amenities…
Taxation est. · year 1
- Rental income
- $22,598
- − Mortgage interest
- −$12,878
- − Property taxes
- −$2,249
- − Insurance
- −$1,150
- − Repairs & maintenance
- −$1,808
- − Management
- −$1,808
- − Depreciation
- −$6,688
- Taxable loss
- −$3,982
- Est. tax savings @ 24.0%
- +$956
- After-tax cash flow
- $942/yr
For passive investors: Depreciation is non-cash, so a rental often shows a tax loss while cash-flowing — sheltering income. Rental losses are passive: they offset passive income freely, and up to $25,000/yr can offset ordinary (W-2) income if you actively participate and your MAGI is under $100k (phasing out to $0 by $150k); unused losses carry forward. On sale, claimed depreciation is recaptured at up to 25%, and gains may owe capital-gains tax (a 1031 exchange can defer both). Figures are a year-1 estimate at your 24.0% rate — not tax advice; consult a CPA.
Schools (NCES district)
- District
- Portage Township Schools
- NCES district ID
- 1809150
- Math proficiency
- 26% ▼ -15.00%
- Reading proficiency
- 36% ▼ -10.00%
- Median HH income
- $53,880
- Composite
- 27.37/100
- National rank
- #6978
- State rank
- #221 of 301 in IN
Livability — Portage
- Score
- 72/100
- State rank
- #111
- US rank
- #5725
Category grades
Schools grade is shown separately in the Schools card above.
Census & demographics
- Census place
- Portage, IN
- County
- Porter County · 151,647 people
- City population
- 40,301
- Metro
- Chicago-Naperville-Elgin, IL-IN-WI
- Population (ZIP)
- 40,301
- Household income
- $76,368
- Rent vs Own
- Severe rent burden
- 856.0
Population outlook (Porter County) Hauer SSP2
- Today (2025)
- 177,804 people
- By 2030
- 181,552 · +2.1%
- By 2040
- 185,830 · +4.5%
- By 2050
- 187,498 · +5.5%
- By 2075
- 189,585 · +6.6%
- By 2100
- 183,722 · +3.3%
Race, ethnicity, and origin ACS 2023
- Neighborhood character
- Predominantly White (67%)
- Race & ethnicity
- White 67% Hispanic / Latino 18% Two or more races 10% Black 10% Asian 1%
- Hispanic origin (detail)
- Mexican 13% Puerto Rican 4%
- Common ancestry
- Romanian 6% Slovak 2% Iranian 1%
- Foreign-born
- 3% · Canada
- Languages at home
- 92% English-only · Spanish 6%
Political lean MEDSL · Porter
- 2024 margin
- R (+10.5) · D 43.8% · R 54.3% · Other 1.8%
- 2008→2024 swing
- -17.7pp toward R · 2008: 7.2pp · 2024: -10.5pp
- All cycles
- 2024: R+10.5 2020: R+6.1 2016: R+6.8 2012: D+3.8 2008: D+7.2
Not yet ingested
- Civics
- —
Market trends
- HPI YoY
- ▼ -195.94%
- Current HPI
- 181.3254
- Rent YoY
- ▲ 4.29%
- Metro
- Chicago-Naperville-Elgin, IL-IN-WI
- State GDP YoY
- ▲ 2.90%
- F500 in state
- 18
Industry mix (Fortune 500 HQ in IN)
| Industry | F500 HQs | Revenue |
|---|---|---|
| Industrial Machinery | 2 | $37B |
|
||
| Healthcare | 1 | $177B |
|
||
| Pharmaceuticals | 1 | $45B |
|
||
| Metals / Steel | 1 | $18B |
|
||
| Agriculture | 1 | $17B |
|
||
| Packaging | 1 | $12B |
|
||
Price history
+84.1% since first listed4 events — show timeline
- 2026-04-13 Price Changed $229,900 NIRA MLS as Distributed by MLS Grid
- 2026-04-10 Listed $249,000 NIRA MLS as Distributed by MLS Grid
- 2015-05-14 Sold (MLS) $120,000 NIRA MLS as Distributed by MLS Grid
- 2015-01-05 Listed $124,900 NIRA MLS as Distributed by MLS Grid
Property tax history
+3.5%/yrLatest (2024): $2,249 · +0.6% YoY. Source: county tax records.
Cash-flow waterfall
monthlySold comps — $/sqft
last 12 mo · ≤1 miLoading sold comps…