 17-Plex
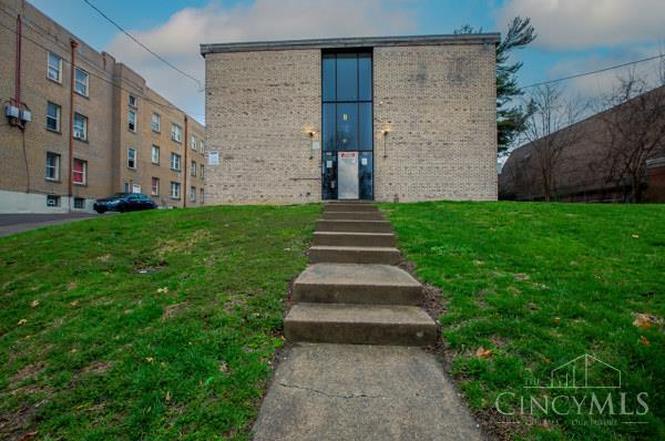
694 Gholson Ave · Cincinnati, OH
Flood risk 1/10 · Minimal
- FEMA flood zone
- X (unshaded)
- Chance of flooding over 30 yrs
- 0.0%
- Est. flood insurance / yr
- $507 – $1,088
Fire risk 1/10 · Minimal
- Est. fire insurance / yr
- $713 – $1,323
Heat risk 4/10 · Minor
- Hot days now (above 103°F)
- 7 days/yr
- Hot days in 30 yrs
- 19 days/yr
Wind risk 2/10 · Minimal
- Chance of severe wind over 30 yrs
- 1.0%
Air-quality risk 3/10 · Minor
- Unhealthy air days now
- 2 days/yr
- Unhealthy air days in 30 yrs
- 3 days/yr
Risk factors via First Street. Map © Google.
Why this score? — see what drove the B grade
The composite is a weighted blend of 9 inputs, each scored 0–100. Each bar is that input's sub-score; the figure is the points it added to the 100-point composite (weight × sub-score).
- Cash flow +30.0/30.0
- 1% rule +10.0/10.0
- DSCR +10.0/10.0
- ARV discount +7.5/15.0
- Livability +4.0/5.0
- Rent growth +3.9/5.0
- Schools +2.5/10.0
- Condition / age +2.5/5.0
- Appreciation +0.0/10.0
$1,105,000
🖨 Deal sheet (PDF) 📄 Offer letter ✓ Due diligence
Multi-family units
County records classify this as Multi-Family (5+ Unit). Listing-text estimate: 17 units. confirmed
5+ unit building — per-unit beds/baths from public records are typically unavailable; the breakdown below (if shown) is an estimate from the listing text.
Listing remarks MLS
17 - one bedroom units located in redeveloping Avondale! 5 units recently rennovated. New Roof in 2018. All common areas recently painted. Property is in walking distance of the new Avondale town center. They are also building a 150 million office and hotel in Avondale.
Key facts
- Easy commuting
- Ample parking
- Prime location
Tags
Property features AI
Finance
- Other: Property located in Avondale; Directions: Reading to Gholson; Census tract: 68; Parcel number: 112-0004-0030-00; Listing broker: Endurance Realty & Investments; Listing agent: J.J. Harrison
Exterior
- Parking: Detached lot parking with 10 garage spaces and 10 open parking spaces
- Utilities: Public water; Public sewer; Natural gas
- Home design: Three or more levels; Single building (total buildings: 1)
- Construction: Poured foundation; Brick exterior; Membrane roof
- Exterior features: Brick construction; Membrane roof; Slider windows; Irregular-shaped lot of about 26,833 acres
Interior
- Bedrooms: All units are 1-bedroom
- Heating & cooling: Hot water heating; Wall-unit cooling
- Interior features: Seventeen 1-bedroom units (total of 17 units)
Neighborhood map
What this means for you Summary
Snapshot
- This is a 17 × 1-bed/1-bath units multifamily listed at $1.10M.
Deal economics
- At list price, monthly cash flow is $5k ($62k/yr) — positive. Per door: $302/mo.
- The deal already cash-flows at list — no discount required.
- Meets the 1% rule at list price ($17k rent vs $1.10M).
- Recommended offer: $972k (12.0% below list) — sets the bar for market timing.
- Cap rate 11.9% vs local median 3.9% in Cincinnati — top-decile yield for the area; either an underpriced asset or a hidden risk that comps aren't pricing in. Stress-test before assuming the spread holds.
Location & tenants
- Location reads 80/100 on livability (#130 in OH, #1,856 nationally) — a professional / high-income tenant draw. Strengths: amenities A+, commute A+, cost of living A+; Watch: employment D, crime F.
- Cincinnati Public Schools (urban): math 25% / reading 36% proficiency, ranked #581 of 656 in OH (top 89%) — families likely to look elsewhere, expect single-tenant / working-renter base with shorter leases; 70% free/reduced lunch — lower-income household profile, screen leases tightly.
- Zoned schools: Sands Montessori School (math 70% / reading 77%, grade A, #311 of 1,584 statewide, top 20%, 683 students, 22% FRL); Hartwell School (math 17% / reading 31%, grade F, #593 of 654 statewide, top 91%, 447 students, 0% FRL); Walnut Hills High School (math 79% / reading 89%, grade A, #17 of 781 statewide, top 2%, 2,582 students, 14% FRL) — zoned schools average 12% FRL vs 70% district-wide (59 pts lower); this property's tenant base skews higher-income than the district average.
- Zoned-school proficiency averages 60% at this address vs 30% district-wide (+30 pts) — the actual schools serving this property are materially stronger than the Cincinnati Public Schools average implies; a family-tenant draw the district grade alone would hide.
- Market conditions: Rents rising fast (+5.5%/yr); 49 active listings in the ZIP; lower-income renter base — watch delinquency; 801 units permitted in Hamilton County in 2024 (190 in 5+ unit buildings).
- At $16,647/mo this rent would consume 619% of the median local household income ($32k/yr) (locally 1730% of renters already pay >50% of income on rent) — very limited rent-growth headroom before tenants either downsize or default.
Forward outlook
- Local home prices are declining (-3.0%/yr); year-one equity from $8k of loan paydown is wiped out by about $33k of value loss. Plan a longer hold.
- At projected returns (-3.0% appreciation + 5.5% rent growth), your $309k cash investment doubles in ~6 years — after that, you're playing with house money.
Negotiation context
- It's been on market 332 days — a 12% lower offer ($972k) is reasonable based on typical stale-listing flexibility.
- 11 sale attempts since 20y ago with the ask held roughly flat each time — persistent listings suggest the price (not the market) is what's stuck; bring a comps-based counter.
- Current owner paid $730k; list at $1.10M implies a 51% gain — meaningful room to come down on a strong offer.
Questions for the listing agent
- It's been on market 332 days. Have you received any prior offers? Is the seller open to a 12% concession, seller financing, or rate buy-down credit?
- Can we see the unit-by-unit rent roll, current vacancy, and any below-market leases? What's the average tenancy length?
- What capital expenditures (roof, boiler, parking lot, exteriors) have been made in the last 5 years, and what's planned in the next 2?
- Built in 1966 — when were the roof, HVAC, electrical panel, plumbing, and water heater last replaced?
- Why hasn't it sold? Are there any deal-killer items the seller is aware of (foundation, flood, title, zoning, code violations)?
- Is there a deadline driving the sale (1031 exchange, divorce, estate, relocation)? That informs how much negotiation room exists.
- Schools are B-rated — typically a magnet for longer-tenancy family renters. What's the average tenant stay here, and is there a school-zone premium baked into asking?
- Crime grade is F in this area — have there been break-ins, vandalism, or insurance claims at this property in the last 3 years? What carrier currently insures it and at what premium?
- What's the average days-on-market for RENTAL listings here right now (not sales)? A rising rental-DOM trend means longer vacancies and softer asking-rent achievability than the comps imply.
- What's the recent tenant-quality profile in this submarket — average credit score on applications, eviction rate, late-payment / NSF rate, and stable-employment percentage? A property-management company in the area should have these aggregated.
- How much new apartment / multifamily construction is in the pipeline within 1–3 miles? Heavy new supply (>2% of stock underway) typically softens rents 12–24 months out; light construction supports rent growth.
Investment metrics
- 1% rule
- 1.51% ✓
- Cap rate
- 11.86%
- Cash-on-cash
- 19.89%
- DSCR
- 1.89
- GRM
- 5.5
CMA / ARV
No comps found within radius.
Projected returns pro-forma
-3.0% appreciation · 5.55% rent growth · sell at horizon
- IRR
- 15.0%
- Equity multiple
- 1.62×
- Total profit
- $191,928
- Equity at exit
- $164,759
- IRR
- 25.6%
- Equity multiple
- 3.52×
- Total profit
- $779,162
- Equity at exit
- $95,540
Cash invested: $309,400 (down + closing). Projections, not guarantees.
Landlord ↔ Tenant lean methodology
- Overall (STATE)
- 73 Landlord-Friendly
- State Ohio
- 73 Landlord-Friendly · R+6
- County
- — inherits STATE
- City
- — inherits STATE
ZIP-level market 45229
- Home prices YoY
- -24.0%
- Rents YoY
- 5.5%
- Active inventory
- 49
- Price-to-rent
- 94.0×
Monthly cashflow live
- Estimated rent
- $16,647 high interval (Pro) →
- Mortgage (P&I)
- −$5,795
- Tax from tax record
- −$1,766 /mo · $21,198/yr
- Insurance
- −$460
- HOA
- −$0
- Vacancy / Maint / Mgmt
- −$3,496
- Net cashflow
- $5,129
Break-even live
Sensitivity live
| Price | -10% $5,755 | -5% $5,442 | +0% $5,129 | +5% $4,817 | +10% $4,504 |
|---|---|---|---|---|---|
| Rent | -10% $3,814 | -5% $4,472 | +0% $5,129 | +5% $5,787 | +10% $6,445 |
| Rate | -1.0pp $5,686 | -0.5pp $5,411 | base $5,129 | +0.5pp $4,843 | +1.0pp $4,552 |
17-unit breakdown (identical units grouped — click to expand)
| Units | Beds | Baths | Est. rent |
|---|---|---|---|
| 17× units | 1 | 1 | $16,643 |
| #1 | 1 | 1 | $979 |
| #2 | 1 | 1 | $979 |
| #3 | 1 | 1 | $979 |
| #4 | 1 | 1 | $979 |
| #5 | 1 | 1 | $979 |
| #6 | 1 | 1 | $979 |
| #7 | 1 | 1 | $979 |
| #8 | 1 | 1 | $979 |
| #9 | 1 | 1 | $979 |
| #10 | 1 | 1 | $979 |
| #11 | 1 | 1 | $979 |
| #12 | 1 | 1 | $979 |
| #13 | 1 | 1 | $979 |
| #14 | 1 | 1 | $979 |
| #15 | 1 | 1 | $979 |
| #16 | 1 | 1 | $979 |
| #17 | 1 | 1 | $979 |
| Total (17 units) | $16,647 | ||
UW: 25.0% down · 7.5% · 30yr · 1.5% tax · 5.0% vac · 8.0% maint · 8.0% mgmt
Financing live
Cash to close
- Down payment
- $276,250
- Closing costs
- $33,150
- Reserves months
- —
- Total cash needed
- —
Loan-product check · same deal, 3 products live
Conventional
25% down · 7.5% · 30yr
- Down + closing
- —
- Monthly P&I
- —
- Monthly cashflow
- —
- DSCR
- —
- Eligible?
- —
Personal DTI + credit; lowest rate.
DSCR
20% down · 8.5% · 30yr
- Down + closing
- —
- Monthly P&I
- —
- Monthly cashflow
- —
- DSCR
- —
- Eligible?
- —
No personal income docs; deal must DSCR.
Hard money
10% down · 12.0% · 12mo
- Down + closing
- —
- Monthly P&I
- —
- Monthly cashflow
- —
- DSCR
- —
- Eligible?
- —
Short-term bridge; refi at stabilization.
Listing history 45 events
-
2026-06-21days on market $1,105,000 Active 332 DOM
-
2026-06-18days on market $1,105,000 Active 329 DOM
-
2026-06-17days on market $1,105,000 Active 328 DOM
-
2026-06-16days on market $1,105,000 Active 327 DOM
-
2026-06-15days on market $1,105,000 Active 326 DOM
-
2026-06-13days on market $1,105,000 Active 324 DOM
-
2026-06-13days on market $1,105,000 Active 323 DOM
-
2026-06-09days on market $1,105,000 Active 320 DOM
-
2026-06-08days on market $1,105,000 Active 319 DOM
-
2026-06-07days on market $1,105,000 Active 318 DOM
-
2026-06-03days on market $1,105,000 Active 314 DOM
-
2026-06-02days on market $1,105,000 Active 313 DOM
-
2026-06-01days on market $1,105,000 Active 312 DOM
-
2026-05-31days on market $1,105,000 Active 311 DOM
-
2025-07-22$1,105,000 Active
-
2024-08-07historical $700
-
2024-07-31$700
-
2024-06-05historical $700
-
2024-05-22price $700
-
2024-05-15$720
-
2024-04-10historical $720
-
2024-03-29$720
-
2022-02-04soldstatus $730,000
-
2022-01-23soldstatus $730,000 Sold 288-char remark
Show marketing remark (288 chars)
17 - one bedroom units located in redeveloping Avondale! 5 units recently rennovated. New Roof in 2018. All common areas recently painted. Property is in walking distance of the new Avondale town center. They are also building a 150 million office and hotel in Avondale.
-
2021-11-10historical Contingency Pending 288-char remark
Show marketing remark (288 chars)
17 - one bedroom units located in redeveloping Avondale! 5 units recently rennovated. New Roof in 2018. All common areas recently painted. Property is in walking distance of the new Avondale town center. They are also building a 150 million office and hotel in Avondale.
-
2021-11-01$780,000 Active 288-char remark
Show marketing remark (288 chars)
17 - one bedroom units located in redeveloping Avondale! 5 units recently rennovated. New Roof in 2018. All common areas recently painted. Property is in walking distance of the new Avondale town center. They are also building a 150 million office and hotel in Avondale.
-
2018-11-05soldstatus $480,000
-
2018-10-31soldstatus $480,000 Sold 263-char remark
Show marketing remark (263 chars)
This is a cash cow, turn-key, 17-one bedroom/one bath units all the same!! Walking distance to the new Avondale Town Center development. Above average rent rates!! New Roof 2018, New Hot H20 2016, New Boiler 2010. Rent roll & P&L available. Owner/Agent
-
2018-09-18historical Accept Backup Offers 263-char remark
Show marketing remark (263 chars)
This is a cash cow, turn-key, 17-one bedroom/one bath units all the same!! Walking distance to the new Avondale Town Center development. Above average rent rates!! New Roof 2018, New Hot H20 2016, New Boiler 2010. Rent roll & P&L available. Owner/Agent
-
2018-08-30status Active 263-char remark
Show marketing remark (263 chars)
This is a cash cow, turn-key, 17-one bedroom/one bath units all the same!! Walking distance to the new Avondale Town Center development. Above average rent rates!! New Roof 2018, New Hot H20 2016, New Boiler 2010. Rent roll & P&L available. Owner/Agent
-
2018-08-30historical Accept Backup Offers 263-char remark
Show marketing remark (263 chars)
This is a cash cow, turn-key, 17-one bedroom/one bath units all the same!! Walking distance to the new Avondale Town Center development. Above average rent rates!! New Roof 2018, New Hot H20 2016, New Boiler 2010. Rent roll & P&L available. Owner/Agent
-
2018-08-25status Active 263-char remark
Show marketing remark (263 chars)
This is a cash cow, turn-key, 17-one bedroom/one bath units all the same!! Walking distance to the new Avondale Town Center development. Above average rent rates!! New Roof 2018, New Hot H20 2016, New Boiler 2010. Rent roll & P&L available. Owner/Agent
-
2018-08-12historical Accept Backup Offers 263-char remark
Show marketing remark (263 chars)
This is a cash cow, turn-key, 17-one bedroom/one bath units all the same!! Walking distance to the new Avondale Town Center development. Above average rent rates!! New Roof 2018, New Hot H20 2016, New Boiler 2010. Rent roll & P&L available. Owner/Agent
-
2018-08-03$535,000 Active 263-char remark
Show marketing remark (263 chars)
This is a cash cow, turn-key, 17-one bedroom/one bath units all the same!! Walking distance to the new Avondale Town Center development. Above average rent rates!! New Roof 2018, New Hot H20 2016, New Boiler 2010. Rent roll & P&L available. Owner/Agent
-
2010-10-20soldstatus $245,000
-
2010-01-29$279,900
-
2007-04-24historical
-
2007-02-13historical
-
2007-01-23$463,463
-
2006-04-03$459,000
-
2005-04-07soldstatus $215,000
-
2001-02-01soldstatus $1,370,000
-
2000-08-15soldstatus $1,063,400
-
2000-08-15soldstatus $1,063,389
-
1989-07-24soldstatus $270,000
ⓘ Source: listings_history table (triggers on properties + properties_extension) + one-shot
backfill from property_details.listing_events for pre-trigger history.
Tax reassessment forecast OH · Partial reset (capped growth)
- Current annual tax
- $21,198 · $1,766/mo
- Projected year-2 tax
- $21,198 · $1,766/mo
- Expected delta
- $0/yr ($0/mo · 0.0%)
ⓘ Screening estimate from a state-policy table — verify with the county assessor before closing.
Climate risk First Street
- Flood 1/10 Low FEMA zone X (unshaded) · 0% chance over 30 yrs
- Wildfire 1/10 Low
- Heat 4/10 Moderate 7 d/yr ≥103°F today · 19 d/yr by 30 yrs out
- Wind 2/10 Low 100% chance of damaging wind over 30 yrs
- Air quality 3/10 Moderate 2 unhealthy d/yr today · 3 by 30 yrs out
Nearby sold comps map
Loading sold comps map…
Walkable amenities ~0.75 mi
Loading nearby amenities…
Taxation est. · year 1
- Rental income
- $199,764
- − Mortgage interest
- −$61,897
- − Property taxes
- −$21,198
- − Insurance
- −$5,525
- − Repairs & maintenance
- −$15,981
- − Management
- −$15,981
- − Depreciation
- −$32,145
- Taxable income
- $47,036
- Est. tax owed @ 24.0%
- −$11,289
- After-tax cash flow
- $50,265/yr
For passive investors: Depreciation is non-cash, so a rental often shows a tax loss while cash-flowing — sheltering income. Rental losses are passive: they offset passive income freely, and up to $25,000/yr can offset ordinary (W-2) income if you actively participate and your MAGI is under $100k (phasing out to $0 by $150k); unused losses carry forward. On sale, claimed depreciation is recaptured at up to 25%, and gains may owe capital-gains tax (a 1031 exchange can defer both). Figures are a year-1 estimate at your 24.0% rate — not tax advice; consult a CPA.
Schools (NCES district)
- District
- Cincinnati Public Schools
- NCES district ID
- 3904375
- Math proficiency
- 25% ▼ -19.00%
- Reading proficiency
- 36% ▼ -14.00%
- Median HH income
- $35,743
- Composite
- 25.21/100
- National rank
- #7508
- State rank
- #581 of 656 in OH
Livability — Cincinnati
- Score
- 80/100
- State rank
- #130
- US rank
- #1856
Category grades
Schools grade is shown separately in the Schools card above.
Census & demographics
- Census place
- Cincinnati, OH
- County
- Hamilton County · 701,295 people
- City population
- 505,555
- Metro
- Cincinnati, OH-KY-IN
- Population (ZIP)
- 13,529
- Household income
- $32,263
- Rent vs Own
- Severe rent burden
- 1730.0
Population outlook (Hamilton County) Hauer SSP2
- Today (2025)
- 826,054 people
- By 2030
- 830,947 · +0.6%
- By 2040
- 832,319 · +0.8%
- By 2050
- 822,428 · -0.4%
- By 2075
- 788,688 · -4.5%
- By 2100
- 710,674 · -14.0%
Race, ethnicity, and origin ACS 2023
- Neighborhood character
- Predominantly Black (65%)
- Race & ethnicity
- Black 65% White 24% Two or more races 5% Hispanic / Latino 4% Asian 1%
- Common ancestry
- Italian 2% Iranian 1% Lithuanian 1%
- Foreign-born
- 5% · Canada
- Languages at home
- 93% English-only · Spanish 4% Russian/Polish/Slavic 1% Other Indo-European 1%
Political lean MEDSL · Hamilton
- 2024 margin
- D (+14.9) · D 57.0% · R 42.1%
- 2008→2024 swing
- +7.9pp toward D · 2008: 7.0pp · 2024: 14.9pp
- All cycles
- 2024: D+14.9 2020: D+15.9 2016: D+9.5 2012: D+4.9 2008: D+7.0
Not yet ingested
- Civics
- —
Market trends
- HPI YoY
- ▼ -80.34%
- Current HPI
- 254.492
- Rent YoY
- ▲ 5.55%
- Metro
- Cincinnati, OH-KY-IN
- State GDP YoY
- ▲ 1.98%
- F500 in state
- 48
Industry mix (Fortune 500 HQ in OH)
| Industry | F500 HQs | Revenue |
|---|---|---|
| Insurance | 3 | $145B |
|
||
| Industrial Machinery | 3 | $49B |
|
||
| Financial Services | 3 | $24B |
|
||
| Consumer Goods | 2 | $93B |
|
||
| Aerospace / Defense | 2 | $47B |
|
||
| Utilities | 2 | $33B |
|
||
Price history
+309.3% since first listed31 events — show timeline
- 2025-07-22 Listed $1,105,000 Cincy MLS
- 2024-08-07 Rental Removed $700 RENT.
- 2024-07-31 Listed for Rent $700 RENT.
- 2024-06-05 Rental Removed $700 APPFOLIO
- 2024-05-22 Price Changed $700 APPFOLIO
- 2024-05-15 Listed for Rent $720 APPFOLIO
- 2024-04-10 Rental Removed $720 APPFOLIO
- 2024-03-29 Listed for Rent $720 APPFOLIO
- 2022-02-04 Sold (Public Records) $730,000 Public Records
- 2022-01-23 Sold (MLS) $730,000 Cincy MLS
- 2021-11-10 Contingent — Cincy MLS
- 2021-11-01 Listed $780,000 Cincy MLS
- 2018-11-05 Sold (Public Records) $480,000 Public Records
- 2018-10-31 Sold (MLS) $480,000 Cincy MLS
- 2018-09-18 Contingent — Cincy MLS
- 2018-08-30 Relisted — Cincy MLS
- 2018-08-30 Contingent — Cincy MLS
- 2018-08-25 Relisted — Cincy MLS
- 2018-08-12 Contingent — Cincy MLS
- 2018-08-03 Listed $535,000 Cincy MLS
- 2010-10-20 Sold (MLS) $245,000 Cincy MLS
- 2010-01-29 Listed $279,900 Cincy MLS
- 2007-04-24 Listing Removed — Cincy MLS
- 2007-02-13 Listing Removed — Cincy MLS
- 2007-01-23 Listed $463,463 Cincy MLS
- 2006-04-03 Listed $459,000 Cincy MLS
- 2005-04-07 Sold (Public Records) $215,000 Public Records
- 2001-02-01 Sold (Public Records) $1,370,000 Public Records
- 2000-08-15 Sold (Public Records) $1,063,389 Public Records
- 2000-08-15 Sold (Public Records) $1,063,400 Public Records
- 1989-07-24 Sold (Public Records) $270,000 Public Records
Property tax history
+10.4%/yrLatest (2025): $21,198 · +0.7% YoY. Source: county tax records.
Cash-flow waterfall
monthlySold comps — $/sqft
last 12 mo · ≤1 miLoading sold comps…