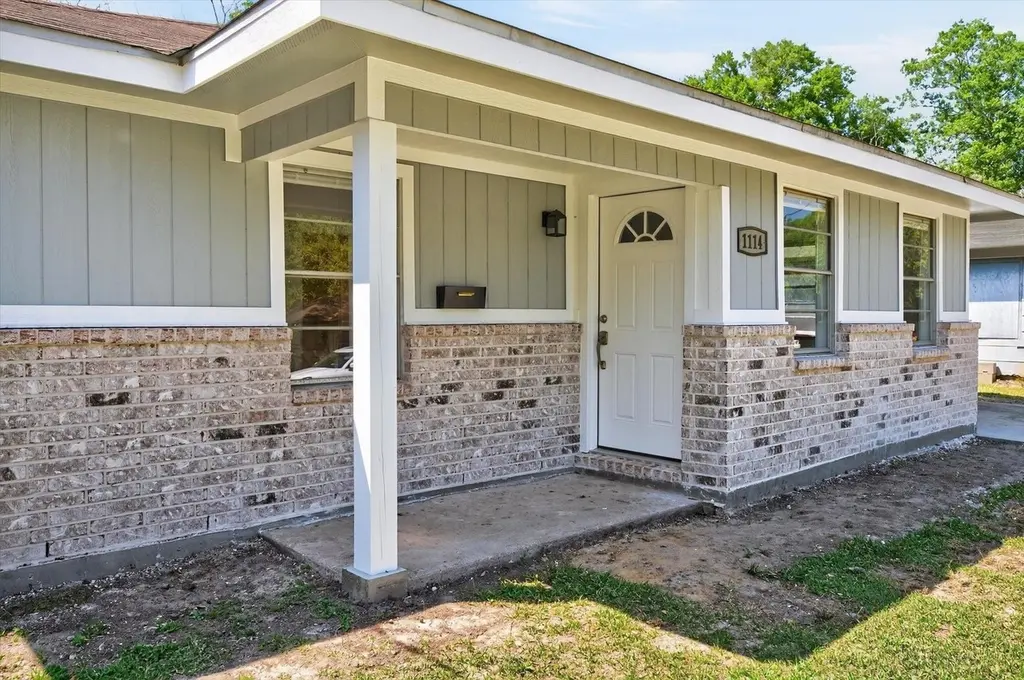
1114 Montrose St · Port Neches, TX
Flood risk 4/10 · Minor
- FEMA flood zone
- X
- Chance of flooding over 30 yrs
- 0.13%
- Est. flood insurance / yr
- $507 – $1,088
Fire risk 3/10 · Minor
- Est. fire insurance / yr
- $1,222 – $2,270
Heat risk 9/10 · Severe
- Hot days now (above 109°F)
- 7 days/yr
- Hot days in 30 yrs
- 24 days/yr
Wind risk 9/10 · Severe
- Chance of severe wind over 30 yrs
- 99.0%
Air-quality risk 2/10 · Minimal
- Unhealthy air days now
- 1 days/yr
- Unhealthy air days in 30 yrs
- 1 days/yr
Risk factors via First Street. Map © Google.
Why this score? — see what drove the D grade
The composite is a weighted blend of 9 inputs, each scored 0–100. Each bar is that input's sub-score; the figure is the points it added to the 100-point composite (weight × sub-score).
- Cash flow +19.7/30.0
- DSCR +6.2/10.0
- 1% rule +4.9/10.0
- Schools +3.9/10.0
- Livability +3.8/5.0
- Rent growth +2.5/5.0
- Condition / age +2.5/5.0
- ARV discount +0.0/15.0
- Appreciation +0.0/10.0
$175,000
🖨 Deal sheet (PDF) 📄 Offer letter ✓ Due diligence
Listing remarks
OWNER FINANCING AVAILABLE!! Step into this beautifully renovated 2-bedroom, 1-bath home in the heart of Port Neches, offering a perfect blend of modern updates and everyday comfort. From the moment you walk in, you’ll notice the fresh interior, updated flooring, and inviting layout designed to maximize space and natural light. The kitchen has been completely redone with new appliances and a practical setup that makes both cooking and entertaining easy. Every upgrade has been carefully completed, giving the home a polished, move-in ready feel. Tucked away in a well-established, peaceful neighborhood and located within a the sought-after PNG school district, this property is ideal for f
Key facts
- Renovated home
- New appliances
- Updated flooring
Tags
Property features AI
Exterior
- Parking: Attached carport (1 space)
- Utilities: Public water; Public sewer
- Home design: Single-family residence; One-story
- Construction: Brick veneer construction; Composition roof; Slab foundation; Built as a residential single-family property
- Exterior features: Patio; Public-maintained road access
Interior
- Kitchen: Dishwasher; Refrigerator; Microwave; Range; Garbage disposal
- Bathrooms: One full bathroom
- Heating & cooling: Central heating (electric); Central air conditioning
- Interior features: Dishwasher; Refrigerator; Microwave; Range; Garbage disposal
Neighborhood map
What this means for you Summary
Snapshot
- This is a 2-bed/1.0-bath single-family listed at $175k.
Deal economics
- At list price, monthly cash flow is $204 ($2k/yr) — positive.
- The deal already cash-flows at list — no discount required.
- To meet the 1% rule (rent ≥ 1% of price), the offer needs to be $174k (0.7% below list).
- Recommended offer: $172k (1.5% below list) — sets the bar for market timing.
- Cap rate 7.7% vs local median 4.7% in Port Neches — top-decile yield for the area; either an underpriced asset or a hidden risk that comps aren't pricing in. Stress-test before assuming the spread holds.
Location & tenants
- Location reads 75/100 on livability (#139 in TX, #3,996 nationally) — a middle-class / working-renter tenant base. Strengths: employment A+, cost of living A+, housing A+; Watch: amenities F, commute F.
- Port Neches-Groves ISD (suburban): math 42% / reading 47% proficiency, ranked #260 of 826 in TX (top 32%) — families likely to look elsewhere, expect single-tenant / working-renter base with shorter leases.
- Market conditions: 96 active listings in the ZIP; 5 comparable units currently listed for rent nearby; rentals at typical pace (median 16d on market — plan ~3-4 weeks tenant-placement turnaround); 343 units permitted in Jefferson County in 2024 (0 in 5+ unit buildings).
Forward outlook
- Local home prices are declining (-3.0%/yr); year-one equity from $1k of loan paydown is wiped out by about $5k of value loss. Plan a longer hold.
Negotiation context
- It's been on market 22 days — a 2% lower offer ($172k) is reasonable based on typical stale-listing flexibility.
- 4 sale attempts with the ask held roughly flat each time — persistent listings suggest the price (not the market) is what's stuck; bring a comps-based counter.
Risks & watch-outs
- Climate carrying-cost: severe wind risk, 99% chance of damaging wind over 30y; extreme-heat days projected 7→24/yr by 2055 (HVAC capex compounding) — expect insurance premiums to compound above CPI over the hold.
Questions for the listing agent
- Built in 1962 — when were the roof, HVAC, electrical panel, plumbing, and water heater last replaced?
- Is there a deadline driving the sale (1031 exchange, divorce, estate, relocation)? That informs how much negotiation room exists.
- Schools are B-rated — typically a magnet for longer-tenancy family renters. What's the average tenant stay here, and is there a school-zone premium baked into asking?
- The area grade is low — what's the realistic commute time and amenity access for the typical tenant pool here? Any planned neighborhood developments (good or bad) we should know about?
- What's the average days-on-market for RENTAL listings here right now (not sales)? A rising rental-DOM trend means longer vacancies and softer asking-rent achievability than the comps imply.
- What's the recent tenant-quality profile in this submarket — average credit score on applications, eviction rate, late-payment / NSF rate, and stable-employment percentage? A property-management company in the area should have these aggregated.
- How much new for-sale + rental construction is in the pipeline within 1–3 miles? Heavy new supply typically softens prices + rents 12–24 months out; constrained supply supports both.
Investment metrics
- 1% rule
- 0.99% ✗
- Cap rate
- 7.70%
- Cash-on-cash
- 5.01%
- DSCR
- 1.22
- GRM
- 8.4
CMA / ARV
- ARV (median comp)
- $133,821
- List price
- $175,000
- Delta
- 30.77%
- Verdict
- OVERPRICED
- Comps
- 4 within 1.0 mi
Show comp detail 2 sales within ~0.75 mi
| Address | Dist | Beds/Ba | Sqft | Sold | Price | $/sf | Match |
|---|---|---|---|---|---|---|---|
| 1104 Grigsby Ave | 0.48mi | 2/1.0 | 720 (-8%) | 11mo | $130,000 | $181 | 56 |
| 1802 Live Oak St | 0.44mi | 3/1.0 (+1) | 864 (+11%) | 3mo | $159,900 | $185 | 54 |
Match score weights: distance 35% · size 25% · config 20% · recency 20%. Top-matched comps best support the ARV.
Projected returns pro-forma
-3.0% appreciation · 3.0% rent growth · sell at horizon
- IRR
- -8.5%
- Equity multiple
- 0.69×
- Total profit
- $-15,333
- Equity at exit
- $26,093
- IRR
- 1.0%
- Equity multiple
- 1.07×
- Total profit
- $3,422
- Equity at exit
- $15,131
Cash invested: $49,000 (down + closing). Projections, not guarantees.
Landlord ↔ Tenant lean methodology
- Overall (STATE)
- 87 Strongly Landlord-Friendly
- State Texas
- 87 Strongly Landlord-Friendly · R+5
- County
- — inherits STATE
- City
- — inherits STATE
ZIP-level market 77651
- Active inventory
- 96
- Price-to-rent
- 8.4×
Monthly cashflow live
- Estimated rent
- $1,738 high interval (Pro) →
- Mortgage (P&I)
- −$918
- Tax from tax record
- −$178 /mo · $2,137/yr
- Insurance
- −$73
- HOA
- −$0
- Vacancy / Maint / Mgmt
- −$365
- Net cashflow
- $204
Break-even live
Sensitivity live
| Price | -10% $304 | -5% $254 | +0% $204 | +5% $155 | +10% $105 |
|---|---|---|---|---|---|
| Rent | -10% $67 | -5% $136 | +0% $204 | +5% $273 | +10% $342 |
| Rate | -1.0pp $293 | -0.5pp $249 | base $204 | +0.5pp $159 | +1.0pp $113 |
UW: 25.0% down · 7.5% · 30yr · 1.5% tax · 5.0% vac · 8.0% maint · 8.0% mgmt
Financing live
Cash to close
- Down payment
- $43,750
- Closing costs
- $5,250
- Reserves months
- —
- Total cash needed
- —
Loan-product check · same deal, 3 products live
Conventional
25% down · 7.5% · 30yr
- Down + closing
- —
- Monthly P&I
- —
- Monthly cashflow
- —
- DSCR
- —
- Eligible?
- —
Personal DTI + credit; lowest rate.
DSCR
20% down · 8.5% · 30yr
- Down + closing
- —
- Monthly P&I
- —
- Monthly cashflow
- —
- DSCR
- —
- Eligible?
- —
No personal income docs; deal must DSCR.
Hard money
10% down · 12.0% · 12mo
- Down + closing
- —
- Monthly P&I
- —
- Monthly cashflow
- —
- DSCR
- —
- Eligible?
- —
Short-term bridge; refi at stabilization.
Rent comps 5 comps
| Address | Beds | Baths | Sqft | Rent | $/sqft | DOM | Units | Dist |
|---|---|---|---|---|---|---|---|---|
| 608 S 2nd St Nederland, TX | 3.0 | 1.0 | 936 | $1,600 | $1.71 | 15d | 1 | 0.99mi |
| 307 Avenue E Port Neches, TX | 3.0 | 2.0 | 875 | $1,550 | $1.77 | 15d | 1 | 1.08mi |
| 2140 Merriman St Port Neches, TX | 2.0 | 1.0 | 800 | $1,995 | $2.49 | 15d | 1 | 1.22mi |
| 2150 Merriman St Port Neches, TX | 2.0 | 1.0 | 800 | $1,995 | $2.49 | 15d | 1 | 1.23mi |
| 812 S 6th St Nederland, TX | 3.0 | 1.0 | 996 | $1,500 | $1.51 | 15d | 1 | 1.37mi |
Listing history 9 events
-
2026-04-30$175,000 Active 884-char remark
-
2026-04-28historical
-
2026-04-14$165,000 Active
-
2026-04-14historical
-
2026-03-31$195,000 Active
-
2026-01-29soldstatus
-
2026-01-28soldstatus Closed
-
2025-12-19status Pending
-
2025-11-30$75,000 Active
ⓘ Source: listings_history table (triggers on properties + properties_extension) + one-shot
backfill from property_details.listing_events for pre-trigger history.
Tax reassessment forecast TX · Resets to sale price
- Current annual tax
- $2,137 · $178/mo
- Projected year-2 tax
- $3,202 · $267/mo
- Expected delta
- +$1,066/yr (+$89/mo · 49.9%)
ⓘ Screening estimate from a state-policy table — verify with the county assessor before closing.
Climate risk First Street
- Flood 4/10 Moderate FEMA zone X · 13% chance over 30 yrs
- Wildfire 3/10 Moderate
- Heat 9/10 Extreme 7 d/yr ≥109°F today · 24 d/yr by 30 yrs out
- Wind 9/10 Extreme 99% chance of damaging wind over 30 yrs
- Air quality 2/10 Low 1 unhealthy d/yr today · 1 by 30 yrs out
Nearby sold comps map
Loading sold comps map…
Walkable amenities ~0.75 mi
Loading nearby amenities…
Taxation est. · year 1
- Rental income
- $20,858
- − Mortgage interest
- −$9,803
- − Property taxes
- −$2,137
- − Insurance
- −$875
- − Repairs & maintenance
- −$1,669
- − Management
- −$1,669
- − Depreciation
- −$5,091
- Taxable loss
- −$384
- Est. tax savings @ 24.0%
- +$92
- After-tax cash flow
- $2,546/yr
For passive investors: Depreciation is non-cash, so a rental often shows a tax loss while cash-flowing — sheltering income. Rental losses are passive: they offset passive income freely, and up to $25,000/yr can offset ordinary (W-2) income if you actively participate and your MAGI is under $100k (phasing out to $0 by $150k); unused losses carry forward. On sale, claimed depreciation is recaptured at up to 25%, and gains may owe capital-gains tax (a 1031 exchange can defer both). Figures are a year-1 estimate at your 24.0% rate — not tax advice; consult a CPA.
Schools (NCES district)
- District
- Port Neches-Groves ISD
- NCES district ID
- 4835430
- Math proficiency
- 42% ▼ -13.00%
- Reading proficiency
- 47% ▼ -5.00%
- Median HH income
- $54,661
- Composite
- 38.65/100
- National rank
- #4152
- State rank
- #260 of 826 in TX
Livability — Port Neches
- Score
- 75/100
- State rank
- #139
- US rank
- #3996
Category grades
Schools grade is shown separately in the Schools card above.
Census & demographics
- Census place
- Port Neches, TX
- Population (ZIP)
- 13,627
Population outlook (Jefferson County) Hauer SSP2
- Today (2025)
- 259,015 people
- By 2030
- 260,685 · +0.6%
- By 2040
- 263,309 · +1.7%
- By 2050
- 265,237 · +2.4%
- By 2075
- 270,193 · +4.3%
- By 2100
- 255,628 · -1.3%
Race, ethnicity, and origin ACS 2023
- Neighborhood character
- Predominantly White (84%)
- Race & ethnicity
- White 84% Hispanic / Latino 9% Two or more races 9% Asian 2%
- Hispanic origin (detail)
- Mexican 8%
- Common ancestry
- Lithuanian 15% Romanian 2% Italian 1%
- Foreign-born
- 5% · Canada
- Languages at home
- 92% English-only · Spanish 4% Vietnamese 2% Other Indo-European 1%
Political lean MEDSL · Jefferson
- 2024 margin
- Lean R (+8.9) · D 45.1% · R 54.0%
- 2008→2024 swing
- -11.1pp toward R · 2008: 2.2pp · 2024: -8.9pp
- All cycles
- 2024: R+8.9 2020: R+1.6 2016: R+0.5 2012: D+1.6 2008: D+2.2
Not yet ingested
- Civics
- —
Market trends
- HPI YoY
- ▼ -187.68%
- Current HPI
- 186.228
- Rent YoY
- —
- Metro
- —
- State GDP YoY
- ▲ 3.95%
- F500 in state
- 110
Industry mix (Fortune 500 HQ in TX)
| Industry | F500 HQs | Revenue |
|---|---|---|
| Energy | 16 | $1,198B |
|
||
| Technology | 5 | $198B |
|
||
| Engineering / Construction | 4 | $72B |
|
||
| Energy Services | 3 | $60B |
|
||
| Utilities | 3 | $41B |
|
||
| Healthcare | 2 | $330B |
|
||
Price history
+133.3% since first listed10 events — show timeline
- 2026-05-21 Pending — BBOR
- 2026-04-30 Listed $175,000 BBOR
- 2026-04-28 Listing Removed — HARMLS
- 2026-04-14 Listing Removed — HARMLS
- 2026-04-14 Listed $165,000 HARMLS
- 2026-03-31 Listed $195,000 HARMLS
- 2026-01-29 Sold (Public Records) — Public Records
- 2026-01-28 Sold (MLS) — BBOR
- 2025-12-19 Pending — BBOR
- 2025-11-30 Listed $75,000 BBOR
Property tax history
+6.1%/yrLatest (2025): $2,137 · +9.6% YoY. Source: county tax records.
Cash-flow waterfall
monthlySold comps — $/sqft
last 12 mo · ≤1 miLoading sold comps…