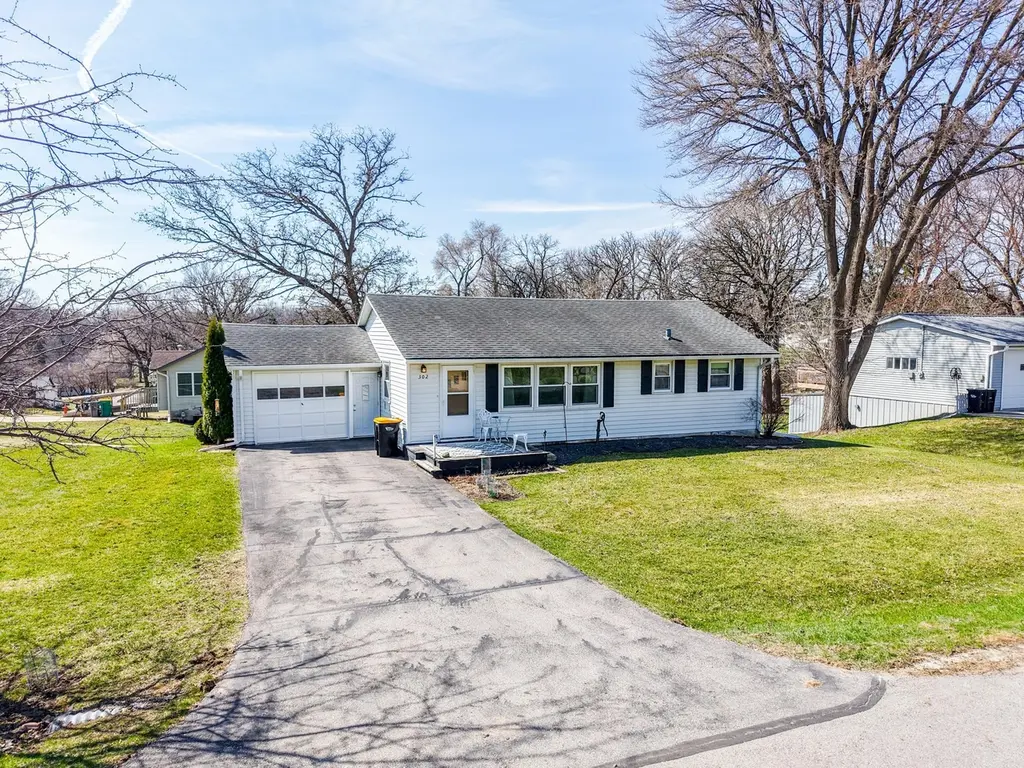
302 19th St SW · Rochester, MN
Flood risk 1/10 · Minimal
- FEMA flood zone
- X (unshaded)
- Chance of flooding over 30 yrs
- 0.0%
- Est. flood insurance / yr
- $473 – $860
Fire risk 1/10 · Minimal
- Est. fire insurance / yr
- $888 – $1,650
Heat risk 2/10 · Minimal
- Hot days now (above 98°F)
- 7 days/yr
- Hot days in 30 yrs
- 15 days/yr
Wind risk 2/10 · Minimal
- Chance of severe wind over 30 yrs
- —
Air-quality risk 2/10 · Minimal
- Unhealthy air days now
- 1 days/yr
- Unhealthy air days in 30 yrs
- 1 days/yr
Risk factors via First Street. Map © Google.
Why this score? — see what drove the C- grade
The composite is a weighted blend of 9 inputs, each scored 0–100. Each bar is that input's sub-score; the figure is the points it added to the 100-point composite (weight × sub-score).
- Cash flow +15.2/30.0
- ARV discount +15.0/15.0
- DSCR +4.7/10.0
- Livability +4.6/5.0
- Schools +4.1/10.0
- 1% rule +3.8/10.0
- Rent growth +2.9/5.0
- Condition / age +2.5/5.0
- Appreciation +0.0/10.0
$259,900
🖨 Deal sheet 📄 Offer letter ✓ Due diligence
Listing remarks
Rambler in a convenient Rochester location with easy access to shopping, dining, and everyday essentials. The main level offers three bedrooms, hardwood floors throughout, and a bright layout with multiple areas for seating and dining plus beautiful front windows that bring in great natural light. The lower level adds excellent flexibility with a bedroom, a den/flex space, living space, and a kitchenette—creating strong potential for a separate living area. With rear parking in addition to the garage and driveway, this property also offers duplex-style potential for the next owner as well.
Key facts
- 0.29 acre lot
- 2 garage spots
- Built 1962
Property features AI
Exterior
- Parking: Attached garage (2 car); Asphalt driveway
- Utilities: City water (connected); City sewer (connected); Natural gas
- Home design: Residential property; One level (with lower level/basement); Main-level entry with lower-level finished space
- Construction: Block construction; Foundation area listed; Finished basement
- Exterior features: Lot approximately 0.287 acres; Lot dimensions about 107 x 118 x 107 x 118
Interior
- Kitchen: Cooktop; Wall oven; Refrigerator; Dishwasher; Kitchen window
- Bedrooms: 4 bedrooms (primary on main floor; additional bedrooms on main and lower levels)
- Flooring: Hardwood floors
- Bathrooms: Main floor full bathroom; Three-quarter bathroom in basement
- Heating & cooling: Forced air heating; Central air conditioning
- Interior features: Finished full basement; Divided bedroom floor plan; Main floor primary bedroom; Natural woodwork; Kitchen window; Water softener (owned)
- Laundry & utility: Washer and dryer; Washer/Dryer hookup; Laundry located in basement; Gas water heater
Neighborhood map
What this means for you Summary
Snapshot
- This is a 2-bed/1.0-bath single-family listed at $260k.
Deal economics
- At list price, monthly cash flow is $90 ($1k/yr) — positive.
- The deal already cash-flows at list — no discount required.
- To meet the 1% rule (rent ≥ 1% of price), the offer needs to be $229k (12.0% below list).
- Recommended offer: $229k (12.0% below list) — sets the bar for 1% rule.
- Cap rate 6.7% vs local median 3.5% in Rochester — top-decile yield for the area; either an underpriced asset or a hidden risk that comps aren't pricing in. Stress-test before assuming the spread holds.
Location & tenants
- Location reads 92/100 on livability (#1 in MN, #27 nationally) — a professional / high-income tenant draw. Strengths: amenities A+, commute A+, employment A+.
- Rochester Public School District (urban): math 40% / reading 51% proficiency, ranked #152 of 301 in MN (top 50%) — families likely to look elsewhere, expect single-tenant / working-renter base with shorter leases.
- Zoned schools: Mayo Senior High (math 42% / reading 65%, grade C-, #104 of 471 statewide, top 22%, 1,862 students, 31% FRL) — zoned schools at 31% FRL track the district average.
- Market conditions: Rents rising (+1.6%/yr); 387 active listings in the ZIP; 5 comparable units currently listed for rent nearby; rentals lingering (median 44d on market — plan ~5-8 weeks vacancy on turnover, expect pricing pressure); 60% of comp listings sitting > 30 days — soft ceiling on asking rent; high-income renter base; 1,267 units permitted in Olmsted County in 2024 (915 in 5+ unit buildings).
Forward outlook
- Local home prices are declining (-3.0%/yr); year-one equity from $2k of loan paydown is wiped out by about $8k of value loss. Plan a longer hold.
- Olmsted County population projected at +16% by 2050 — long-run rental-demand tailwind backs the buy-and-hold thesis.
Negotiation context
- Only 12 days on market — expect competitive offers; lowballing is unlikely to land.
Questions for the listing agent
- Built in 1962 — when were the roof, HVAC, electrical panel, plumbing, and water heater last replaced?
- Is there a deadline driving the sale (1031 exchange, divorce, estate, relocation)? That informs how much negotiation room exists.
- Schools are A-rated — typically a magnet for longer-tenancy family renters. What's the average tenant stay here, and is there a school-zone premium baked into asking?
- What's the average days-on-market for RENTAL listings here right now (not sales)? A rising rental-DOM trend means longer vacancies and softer asking-rent achievability than the comps imply.
- What's the recent tenant-quality profile in this submarket — average credit score on applications, eviction rate, late-payment / NSF rate, and stable-employment percentage? A property-management company in the area should have these aggregated.
- How much new for-sale + rental construction is in the pipeline within 1–3 miles? Heavy new supply typically softens prices + rents 12–24 months out; constrained supply supports both.
Investment metrics
- 1% rule
- 0.88% ✗
- Cap rate
- 6.71%
- Cash-on-cash
- 1.48%
- DSCR
- 1.07
- GRM
- 9.5
CMA / ARV
- ARV (on-the-fly)
- $318,500
- Comps found
- 1
Show comp detail 1 sale within ~0.75 mi
| Address | Dist | Beds/Ba | Sqft | Sold | Price | $/sf | Match |
|---|---|---|---|---|---|---|---|
| 2018 Edgewood Ct SW | 0.71mi | 3/2.0 (+1) | 1,858 (+2%) | 6mo | $325,000 | $175 | 49 |
Match score weights: distance 35% · size 25% · config 20% · recency 20%. Top-matched comps best support the ARV.
Projected returns pro-forma
-3.0% appreciation · 1.55% rent growth · sell at horizon
- IRR
- -15.5%
- Equity multiple
- 0.45×
- Total profit
- $-39,711
- Equity at exit
- $38,752
- IRR
- -9.6%
- Equity multiple
- 0.44×
- Total profit
- $-40,398
- Equity at exit
- $22,471
Cash invested: $72,772 (down + closing). Projections, not guarantees.
Landlord ↔ Tenant lean methodology
- Overall (STATE)
- 46 Balanced
- State Minnesota
- 46 Balanced · D+2
- County
- — inherits STATE
- City
- — inherits STATE
ZIP-level market 55902
- Rents YoY
- 1.6%
- Active inventory
- 387
- Price-to-rent
- 9.5×
Monthly cashflow live
- Estimated rent
- $2,287 high interval (Pro) →
- Mortgage (P&I)
- −$1,363
- Tax from tax record
- −$246 /mo · $2,952/yr
- Insurance
- −$108
- HOA
- −$0
- Vacancy / Maint / Mgmt
- −$480
- Net cashflow
- $90
Break-even live
UW: 25.0% down · 7.5% · 30yr · 1.5% tax · 5.0% vac · 8.0% maint · 8.0% mgmt
Financing live
Cash to close
- Down payment
- $64,975
- Closing costs
- $7,797
- Reserves months
- —
- Total cash needed
- —
Loan-product check · same deal, 3 products live
Conventional
25% down · 7.5% · 30yr
- Down + closing
- —
- Monthly P&I
- —
- Monthly cashflow
- —
- DSCR
- —
- Eligible?
- —
Personal DTI + credit; lowest rate.
DSCR
20% down · 8.5% · 30yr
- Down + closing
- —
- Monthly P&I
- —
- Monthly cashflow
- —
- DSCR
- —
- Eligible?
- —
No personal income docs; deal must DSCR.
Hard money
10% down · 12.0% · 12mo
- Down + closing
- —
- Monthly P&I
- —
- Monthly cashflow
- —
- DSCR
- —
- Eligible?
- —
Short-term bridge; refi at stabilization.
Rent comps 5 comps
| Address | Beds | Baths | Sqft | Rent | $/sqft | DOM | Units | Dist |
|---|---|---|---|---|---|---|---|---|
| 1508 2nd Ave SW Rochester, MN | 2.0 | 2.0 | 1600 | $1,995 | $1.25 | 43d | 1 | 0.52mi |
| 1441 Salem Rd SW Rochester, MN | 3.0 | 2.0 | 1842 | $2,900 | $1.57 | 43d | 1 | 1.31mi |
| 814 7th Ave SW Unit back Rochester, MN | 3.0 | 1.0 | 1400 | $3,000 | $2.14 | 43d | 1 | 1.44mi |
| 801 6th Ave SW Rochester, MN | 3.0 | 2.5 | 2160 | $2,500 | $1.16 | 21d | 1 | 1.46mi |
| 705 1st Ave SW Rochester, MN | 3.0 | 1.0–2.5 | 1135 | $3,148 | $2.77 | 13d | 91 | 1.49mi |
Listing history 4 events
-
2026-04-21status Pending
-
2026-04-14historical Contingent - Inspection
-
2026-04-10$259,900 Active
-
2026-04-08historical $259,900
ⓘ Source: listings_history table (triggers on properties + properties_extension) + one-shot
backfill from property_details.listing_events for pre-trigger history.
Tax reassessment forecast MN · Partial reset (capped growth)
- Current annual tax
- $2,952 · $246/mo
- Projected year-2 tax
- $2,952 · $246/mo
- Expected delta
- $0/yr ($0/mo · 0.0%)
ⓘ Screening estimate from a state-policy table — verify with the county assessor before closing.
Climate risk First Street
- Flood 1/10 Low FEMA zone X (unshaded) · 0% chance over 30 yrs
- Wildfire 1/10 Low
- Heat 2/10 Low 7 d/yr ≥98°F today · 15 d/yr by 30 yrs out
- Wind 2/10 Low
- Air quality 2/10 Low 1 unhealthy d/yr today · 1 by 30 yrs out
Nearby sold comps map
Loading sold comps map…
Walkable amenities ~0.75 mi
Loading nearby amenities…
Taxation est. · year 1
- Rental income
- $27,446
- − Mortgage interest
- −$14,558
- − Property taxes
- −$2,952
- − Insurance
- −$1,300
- − Repairs & maintenance
- −$2,196
- − Management
- −$2,196
- − Depreciation
- −$7,561
- Taxable loss
- −$3,316
- Est. tax savings @ 24.0%
- +$796
- After-tax cash flow
- $1,871/yr
For passive investors: Depreciation is non-cash, so a rental often shows a tax loss while cash-flowing — sheltering income. Rental losses are passive: they offset passive income freely, and up to $25,000/yr can offset ordinary (W-2) income if you actively participate and your MAGI is under $100k (phasing out to $0 by $150k); unused losses carry forward. On sale, claimed depreciation is recaptured at up to 25%, and gains may owe capital-gains tax (a 1031 exchange can defer both). Figures are a year-1 estimate at your 24.0% rate — not tax advice; consult a CPA.
Schools (NCES district)
- District
- Rochester Public School District
- NCES district ID
- 2731800
- Math proficiency
- 40% ▼ -10.00%
- Reading proficiency
- 51% ▼ -4.00%
- Median HH income
- $66,540
- Composite
- 40.6/100
- National rank
- #3695
- State rank
- #152 of 301 in MN
Livability — Rochester
- Score
- 92/100
- State rank
- #1
- US rank
- #27
Category grades
Schools grade is shown separately in the Schools card above.
Census & demographics
- Census place
- Rochester, MN
- County
- Olmsted County · 135,035 people
- City population
- 135,035
- Metro
- Rochester, MN
- Population (ZIP)
- 26,464
- Household income
- $120,611
- Rent vs Own
- Severe rent burden
- 728.0
Population outlook (Olmsted County) Hauer SSP2
- Today (2025)
- 165,999 people
- By 2030
- 172,425 · +3.9%
- By 2040
- 183,785 · +10.7%
- By 2050
- 192,981 · +16.3%
- By 2075
- 215,284 · +29.7%
- By 2100
- 224,887 · +35.5%
Race, ethnicity, and origin ACS 2023
- Neighborhood character
- Predominantly White (75%)
- Race & ethnicity
- White 75% Asian 11% Two or more races 7% Hispanic / Latino 7% Black 2%
- Hispanic origin (detail)
- Mexican 3%
- Common ancestry
- Portuguese 11% Lithuanian 2% Iranian 2%
- Foreign-born
- 14% · Canada, China, Jamaica
- Languages at home
- 82% English-only · Spanish 4% Other Asian/Pacific 4% Other Indo-European 4%
Political lean MEDSL · Olmsted
- 2024 margin
- D (+10.7) · D 54.3% · R 43.6% · Other 2.1%
- 2008→2024 swing
- +7.4pp toward D · 2008: 3.3pp · 2024: 10.7pp
- All cycles
- 2024: D+10.7 2020: D+10.7 2016: D+0.8 2012: D+3.2 2008: D+3.3
Not yet ingested
- Civics
- —
Market trends
- HPI YoY
- ▼ -158.29%
- Current HPI
- 252.3502
- Rent YoY
- ▲ 1.55%
- Metro
- Rochester, MN
- State GDP YoY
- ▲ 2.41%
- F500 in state
- 34
Industry mix (Fortune 500 HQ in MN)
| Industry | F500 HQs | Revenue |
|---|---|---|
| Healthcare | 2 | $407B |
|
||
| Retail | 2 | $150B |
|
||
| Consumer Goods | 2 | $32B |
|
||
| Industrial Machinery | 2 | $6B |
|
||
| Agriculture | 1 | $40B |
|
||
| Healthcare / Medical Devices | 1 | $32B |
|
||
Price history
+0.0% since first listed4 events — show timeline
- 2026-04-21 Pending — NORTHSTARMLS as Distributed by MLS Grid
- 2026-04-14 Contingent — NORTHSTARMLS as Distributed by MLS Grid
- 2026-04-10 Listed $259,900 NORTHSTARMLS as Distributed by MLS Grid
- 2026-04-08 Coming Soon $259,900 NORTHSTARMLS as Distributed by MLS Grid
Property tax history
+9.1%/yrLatest (2025): $2,952 · +7.9% YoY. Source: county tax records.
Cash-flow waterfall
monthlySold comps — $/sqft
last 12 mo · ≤1 miLoading sold comps…