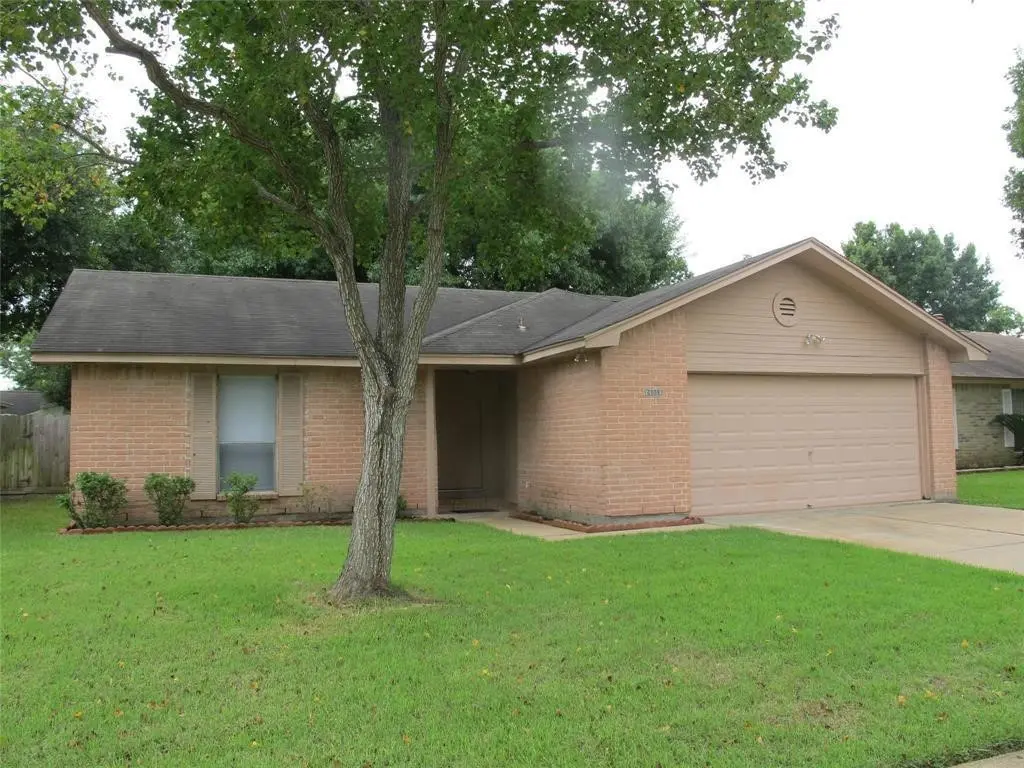
24019 Tayloe House Ln · Houston, TX
Flood risk 4/10 · Minor
- FEMA flood zone
- X (unshaded)
- Chance of flooding over 30 yrs
- 0.22%
- Est. flood insurance / yr
- $507 – $1,088
Fire risk 3/10 · Minor
- Est. fire insurance / yr
- $1,222 – $2,270
Heat risk 9/10 · Severe
- Hot days now (above 111°F)
- 7 days/yr
- Hot days in 30 yrs
- 23 days/yr
Wind risk 8/10 · Major
- Chance of severe wind over 30 yrs
- 99.0%
Air-quality risk 2/10 · Minimal
- Unhealthy air days now
- 1 days/yr
- Unhealthy air days in 30 yrs
- 2 days/yr
Risk factors via First Street. Map © Google.
Why this score? — see what drove the D grade
The composite is a weighted blend of 9 inputs, each scored 0–100. Each bar is that input's sub-score; the figure is the points it added to the 100-point composite (weight × sub-score).
- Cash flow +11.5/30.0
- ARV discount +7.1/15.0
- Schools +5.7/10.0
- 1% rule +4.0/10.0
- Livability +3.7/5.0
- DSCR +3.4/10.0
- Condition / age +2.5/5.0
- Rent growth +2.3/5.0
- Appreciation +0.0/10.0
$225,000
🖨 Deal sheet 📄 Offer letter ✓ Due diligence
Listing remarks MLS
TENANT OCCUPIED. All brick one story home with 4 bedrooms, 2 full baths and 2 car garage in Williamsburg Hamlet. NEW Kitchen and carpet in home. Large den area with high ceilings and wood burning fireplace! Located in the highly sought after Katy ISD and within walking distance to King Elementary and neighborhood pool. Updated and clean. Just a hop, skip and a jump to Grand Parkway and I-10, close to Westpark Toll, all convenient routes to the Energy Corridor as well. Minutes from LaCenterra and Katy Mills Mall, lots of dining and shopping along I-10 as well. Great investment, first time home or even for someone who wants to downsize.
Key facts
- Large den area
- New kitchen
- Updated and clean
Tags
Neighborhood map
What this means for you Summary
Snapshot
- This is a 3-bed/2.0-bath single-family listed at $225k.
Deal economics
- At list price, monthly cash flow is $-76 ($-909/yr) — negative.
- To cash-flow at today's rent, offer at most $212k (5.9% below list).
- To meet the 1% rule (rent ≥ 1% of price), the offer needs to be $202k (10.2% below list).
- Recommended offer: $202k (10.2% below list) — sets the bar for 1% rule.
- Cap rate 5.9% vs local median 3.2% in Houston — top-decile yield for the area; either an underpriced asset or a hidden risk that comps aren't pricing in. Stress-test before assuming the spread holds.
Location & tenants
- Location reads 74/100 on livability (#184 in TX, #4,771 nationally) — a middle-class / working-renter tenant base. Strengths: amenities A+, cost of living A+, housing A+; Watch: schools D, crime F.
- Katy ISD (suburban): math 61% / reading 63% proficiency, ranked #29 of 826 in TX (top 4%) — acceptable for families but not a draw, mixed tenant base, ~2y average lease.
- Market conditions: Rents soft (-0.8%/yr); 2696 active listings in the ZIP; 40 comparable units currently listed for rent nearby; rentals leasing fast (median 10d on market — plan ~1-2 weeks tenant-placement turnaround); high-income renter base; 29,883 units permitted in Harris County in 2024 (8,621 in 5+ unit buildings).
Forward outlook
- Local home prices are declining (-3.0%/yr); year-one equity from $2k of loan paydown is wiped out by about $7k of value loss. Plan a longer hold.
- Harris County population projected at +47% by 2050 — long-run rental-demand tailwind backs the buy-and-hold thesis.
Negotiation context
- It's been on market 85 days — a 6% lower offer ($212k) is reasonable based on typical stale-listing flexibility.
- 4 sale attempts since 8y ago with the ask held roughly flat each time — persistent listings suggest the price (not the market) is what's stuck; bring a comps-based counter.
- Current owner paid $45k; list at $225k implies a 400% gain — meaningful room to come down on a strong offer.
Risks & watch-outs
- Climate carrying-cost: severe wind risk, 99% chance of damaging wind over 30y; extreme-heat days projected 7→23/yr by 2055 (HVAC capex compounding) — expect insurance premiums to compound above CPI over the hold.
Questions for the listing agent
- What do current leases actually rent for vs. the listed asking? Can we see a recent rent roll and the last 12 months of T-12 income?
- It's been on market 85 days. Have you received any prior offers? Is the seller open to a 10% concession, seller financing, or rate buy-down credit?
- What does the HOA fee cover, when was the last increase, and are there any pending special assessments or reserve-fund shortfalls?
- Why hasn't it sold? Are there any deal-killer items the seller is aware of (foundation, flood, title, zoning, code violations)?
- Is there a deadline driving the sale (1031 exchange, divorce, estate, relocation)? That informs how much negotiation room exists.
- Schools are D-rated, which usually means shorter tenancies and higher turnover. Who's the typical renter profile here, and what's been the actual vacancy rate?
- Crime grade is F in this area — have there been break-ins, vandalism, or insurance claims at this property in the last 3 years? What carrier currently insures it and at what premium?
- The area grade is low — what's the realistic commute time and amenity access for the typical tenant pool here? Any planned neighborhood developments (good or bad) we should know about?
- What's the average days-on-market for RENTAL listings here right now (not sales)? A rising rental-DOM trend means longer vacancies and softer asking-rent achievability than the comps imply.
- What's the recent tenant-quality profile in this submarket — average credit score on applications, eviction rate, late-payment / NSF rate, and stable-employment percentage? A property-management company in the area should have these aggregated.
- How much new for-sale + rental construction is in the pipeline within 1–3 miles? Heavy new supply typically softens prices + rents 12–24 months out; constrained supply supports both.
Investment metrics
- 1% rule
- 0.90% ✗
- Cap rate
- 5.89%
- Cash-on-cash
- -1.44%
- DSCR
- 0.94
- GRM
- 9.3
CMA / ARV
- ARV (median comp)
- $222,952
- List price
- $225,000
- Delta
- 0.92%
- Verdict
- FAIR
- Comps
- 20 within 1.0 mi
Show comp detail 12 sales within ~0.75 mi
| Address | Dist | Beds/Ba | Sqft | Sold | Price | $/sf | Match |
|---|---|---|---|---|---|---|---|
| 24034 Griffin House Ln | 0.05mi | 3/2.0 | 1,285 (+12%) | 1mo | $250,000 | $195 | 78 |
| 24026 Griffin House Ln | 0.03mi | 3/2.0 | 1,237 (+8%) | 12mo | $236,000 | $191 | 76 |
| 24130 Griffin House Ln | 0.15mi | 3/2.0 | 1,285 (+12%) | 0mo | $229,999 | $179 | 73 |
| 1838 Powderhorn Ln | 0.31mi | 2/1.0 (-1) | 1,141 (-1%) | 3mo | $159,000 | $139 | 72 |
| 23930 Griffin House Ln | 0.11mi | 3/1.0 | 1,240 (+8%) | 9mo | $171,990 | $139 | 71 |
| 24110 Silversmith Ln | 0.13mi | 3/2.0 | 1,285 (+12%) | 7mo | $210,000 | $163 | 68 |
| 23919 Griffin House Lane Ln | 0.14mi | 2/1.0 (-1) | 1,210 (+5%) | 11mo | $159,000 | $131 | 67 |
| 23918 Silversmith Ln | 0.14mi | 3/1.0 | 1,242 (+8%) | 12mo | $235,000 | $189 | 66 |
| 23819 Silversmith Ln | 0.26mi | 3/1.5 | 1,242 (+8%) | 11mo | $170,000 | $137 | 64 |
| 23835 Griffin House Ln | 0.20mi | 2/1.0 (-1) | 1,210 (+5%) | 13mo | $209,500 | $173 | 62 |
| 23843 Tayloe House Ln | 0.18mi | 2/1.0 (-1) | 1,240 (+8%) | 10mo | $209,000 | $169 | 61 |
| 2107 Charlton House Ln | 0.45mi | 3/2.0 | 1,302 (+13%) | 9mo | $235,000 | $180 | 50 |
Match score weights: distance 35% · size 25% · config 20% · recency 20%. Top-matched comps best support the ARV.
Projected returns pro-forma
-3.0% appreciation · 0.0% rent growth · sell at horizon
- IRR
- -22.3%
- Equity multiple
- 0.25×
- Total profit
- $-47,103
- Equity at exit
- $33,548
- IRR
- -27.5%
- Equity multiple
- -0.11×
- Total profit
- $-69,694
- Equity at exit
- $19,454
Cash invested: $63,000 (down + closing). Projections, not guarantees.
Landlord ↔ Tenant lean methodology
- Overall (STATE)
- 87 Strongly Landlord-Friendly
- State Texas
- 87 Strongly Landlord-Friendly · R+5
- County
- — inherits STATE
- City
- — inherits STATE
ZIP-level market 77493
- Rents YoY
- -0.8%
- Active inventory
- 2696
- Price-to-rent
- 9.3×
Monthly cashflow live
- Estimated rent
- $2,020 high interval (Pro) →
- Mortgage (P&I)
- −$1,180
- Tax from tax record
- −$358 /mo · $4,298/yr
- Insurance
- −$94
- HOA
- −$40
- Vacancy / Maint / Mgmt
- −$424
- Net cashflow
- $-76
Break-even live
UW: 25.0% down · 7.5% · 30yr · 1.5% tax · 5.0% vac · 8.0% maint · 8.0% mgmt
Financing live
Cash to close
- Down payment
- $56,250
- Closing costs
- $6,750
- Reserves months
- —
- Total cash needed
- —
Loan-product check · same deal, 3 products live
Conventional
25% down · 7.5% · 30yr
- Down + closing
- —
- Monthly P&I
- —
- Monthly cashflow
- —
- DSCR
- —
- Eligible?
- —
Personal DTI + credit; lowest rate.
DSCR
20% down · 8.5% · 30yr
- Down + closing
- —
- Monthly P&I
- —
- Monthly cashflow
- —
- DSCR
- —
- Eligible?
- —
No personal income docs; deal must DSCR.
Hard money
10% down · 12.0% · 12mo
- Down + closing
- —
- Monthly P&I
- —
- Monthly cashflow
- —
- DSCR
- —
- Eligible?
- —
Short-term bridge; refi at stabilization.
Rent comps 40 comps
| Address | Beds | Baths | Sqft | Rent | $/sqft | DOM | Units | Dist |
|---|---|---|---|---|---|---|---|---|
| 23812 Colonial Pkwy Katy, TX | 2.0 | 2.0 | 1069 | $1,605 | $1.50 | 43d | 1 | 0.36mi |
| 24002 Colonial Pkwy Katy, TX | 1.0–3.0 | 1.0–2.0 | 1072 | $2,262 | $2.11 | 1d | 32 | 0.46mi |
| 1724 Partnership Way Katy, TX | 3.0 | 1.0–3.5 | 1536 | $3,340 | $2.17 | 1d | 86 | 0.52mi |
| 2031 Wigmaker Dr Katy, TX | 3.0 | 2.0 | 1430 | $1,800 | $1.26 | 5d | 1 | 0.55mi |
| 1616 Partnership Way Katy, TX | 3.0 | 1.0–3.0 | 1283 | $2,995 | $2.33 | 5d | 47 | 0.60mi |
| 24300 Franz Rd Unit 2187 Katy, TX | 2.0 | 2.0 | 1174 | $1,683 | $1.43 | 2d | 1 | 0.63mi |
| 24300 Franz Rd Unit 2174 Katy, TX | 2.0 | 2.0 | 1056 | $1,534 | $1.45 | 16d | 1 | 0.63mi |
| 24300 Franz Rd Unit 24323 Katy, TX | 2.0 | 2.0 | 1174 | $1,715 | $1.46 | 10d | 1 | 0.63mi |
| 24300 Franz Rd Unit 24357 Katy, TX | 2.0 | 2.0 | 1056 | $1,567 | $1.48 | 12d | 1 | 0.63mi |
| 24300 Franz Rd Unit 24337 Katy, TX | 2.0 | 2.0 | 1056 | $1,567 | $1.48 | 43d | 1 | 0.63mi |
| 24300 Franz Rd Unit 424 Katy, TX | 2.0 | 2.0 | 1174 | $1,691 | $1.44 | 5d | 1 | 0.63mi |
| 1330 Park West Green Dr Unit 1367 Katy, TX | 2.0 | 2.0 | 1209 | $1,847 | $1.53 | 15d | 1 | 0.65mi |
| 1330 Park West Green Dr Unit 1363 Katy, TX | 3.0 | 2.0 | 1451 | $2,212 | $1.52 | 15d | 1 | 0.65mi |
| 1502 Partnership Way Katy, TX | 2.0 | 2.0 | 1092 | $1,800 | $1.65 | 43d | 1 | 0.69mi |
| 1330 W Park Green Dr Katy, TX | 1.0–3.0 | 1.0–2.0 | 1058 | $2,222 | $2.10 | 43d | 16 | 0.69mi |
| 1330 W Park Green Dr Katy, TX | 2.0 | 2.0 | 1122 | $1,802 | $1.61 | 24d | 1 | 0.69mi |
| 1330 W Park Green Dr Katy, TX | 1.0–3.0 | 1.0–2.0 | 1058 | $2,297 | $2.17 | 2d | 17 | 0.69mi |
| 1502 Partnership Way Unit 2187 Katy, TX | 2.0 | 2.0 | 1207 | $1,731 | $1.43 | 2d | 1 | 0.72mi |
| 1502 Partnership Way Unit 2174 Katy, TX | 2.0 | 2.0 | 1207 | $1,774 | $1.47 | 11d | 1 | 0.72mi |
| 1502 Partnership Way Unit 424 Katy, TX | 2.0 | 2.0 | 1207 | $1,739 | $1.44 | 5d | 1 | 0.72mi |
| 1502 Partnership Way Unit 1539 Katy, TX | 2.0 | 2.0 | 1092 | $1,714 | $1.57 | 43d | 1 | 0.72mi |
| 2020 Grandway Dr Katy, TX | 1.0–2.0 | 1.0–2.0 | 954 | $2,013 | $2.11 | 1d | 46 | 0.75mi |
| 1207 Grand West Blvd Katy, TX | 1.0–2.0 | 1.0–2.0 | 841 | $3,800 | $4.52 | 43d | 2 | 0.89mi |
| 23010 Franz Rd Unit 23067 Katy, TX | 2.0 | 2.0 | 1072 | $1,480 | $1.38 | 43d | 1 | 0.95mi |
| 23010 Franz Rd Unit 23033 Katy, TX | 2.0 | 2.0 | 1116 | $1,702 | $1.53 | 10d | 1 | 0.95mi |
| 23010 Franz Rd Unit 23047 Katy, TX | 2.0 | 2.0 | 1072 | $1,455 | $1.36 | 15d | 1 | 0.95mi |
| 23010 Franz Rd Unit 2112 Katy, TX | 2.0 | 2.0 | 1116 | $1,670 | $1.50 | 2d | 1 | 0.95mi |
| 23010 Franz Rd Unit 2162 Katy, TX | 2.0 | 2.0 | 1116 | $1,678 | $1.50 | 4d | 1 | 0.95mi |
| 150 Cobia Dr Unit 187 Katy, TX | 2.0 | 2.0 | 1114 | $1,451 | $1.30 | 10d | 1 | 1.00mi |
| 150 Cobia Dr Unit 2187 Katy, TX | 2.0 | 2.0 | 1114 | $1,419 | $1.27 | 2d | 1 | 1.00mi |
| 150 Cobia Dr Unit 207 Katy, TX | 2.0 | 2.0 | 1114 | $1,452 | $1.30 | 43d | 1 | 1.00mi |
| 150 Cobia Dr Unit 424 Katy, TX | 2.0 | 2.0 | 1114 | $1,427 | $1.28 | 5d | 1 | 1.00mi |
| 150 Cobia Dr Unit 183 Katy, TX | 3.0 | 2.0 | 1454 | $2,005 | $1.38 | 43d | 1 | 1.00mi |
| 150 Cobia Dr Unit 3187 Katy, TX | 3.0 | 2.0 | 1454 | $1,962 | $1.35 | 2d | 1 | 1.00mi |
| 150 Cobia Dr Unit 3174 Katy, TX | 3.0 | 2.0 | 1454 | $1,994 | $1.37 | 10d | 1 | 1.00mi |
| 24117 Bella Dolce Ln Katy, TX | 2.0 | 1.0–2.0 | 896 | $2,010 | $2.24 | 1d | 25 | 1.02mi |
| 22777 Franz Rd Unit 22814 Katy, TX | 2.0 | 2.0 | 990 | $1,411 | $1.43 | 10d | 1 | 1.03mi |
| 22777 Franz Rd Unit 22814 Katy, TX | 2.0 | 2.0 | 990 | $1,515 | $1.53 | 43d | 1 | 1.03mi |
| 22777 Franz Rd Unit 2112 Katy, TX | 2.0 | 2.0 | 990 | $1,379 | $1.39 | 2d | 1 | 1.03mi |
| 22777 Franz Rd Unit 424 Katy, TX | 2.0 | 2.0 | 990 | $1,387 | $1.40 | 5d | 1 | 1.03mi |
HOA detail
- Monthly dues
- $40 · $480/yr
- Likely covers
- pool
Listing history 24 events
-
2026-06-13days on market $225,000 Active 85 DOM
-
2026-06-09days on market $225,000 Active 81 DOM
-
2026-06-08days on market $225,000 Active 80 DOM
-
2026-06-07days on market $225,000 Active 79 DOM
-
2026-06-04days on market $225,000 Active 76 DOM
-
2026-06-03days on market $225,000 Active 75 DOM
-
2026-06-02days on market $225,000 Active 74 DOM
-
2026-06-01days on market $225,000 Active 73 DOM
-
2026-05-31days on market $225,000 Active 72 DOM
-
2026-03-20$225,000 Active 642-char remark
Show marketing remark (642 chars)
TENANT OCCUPIED. All brick one story home with 4 bedrooms, 2 full baths and 2 car garage in Williamsburg Hamlet. NEW Kitchen and carpet in home. Large den area with high ceilings and wood burning fireplace! Located in the highly sought after Katy ISD and within walking distance to King Elementary and neighborhood pool. Updated and clean. Just a hop, skip and a jump to Grand Parkway and I-10, close to Westpark Toll, all convenient routes to the Energy Corridor as well. Minutes from LaCenterra and Katy Mills Mall, lots of dining and shopping along I-10 as well. Great investment, first time home or even for someone who wants to downsize.
-
2026-02-18historical
-
2025-12-27price $199,999
-
2025-10-07price $234,900
-
2025-08-26$224,900 Active
-
2018-11-09soldstatus
-
2018-11-08soldstatus Sold
-
2018-10-09status Pending
-
2018-10-03status Option Pending
-
2018-10-03status Active
-
2018-10-02status Option Pending
-
2018-10-01historical
-
2018-09-27$145,000 Active
-
2009-04-14soldstatus
-
1995-09-28soldstatus $45,000
ⓘ Source: listings_history table (triggers on properties + properties_extension) + one-shot
backfill from property_details.listing_events for pre-trigger history.
Tax reassessment forecast TX · Resets to sale price
- Current annual tax
- $4,298 · $358/mo
- Projected year-2 tax
- $4,298 · $358/mo
- Expected delta
- $0/yr ($0/mo · 0.0%)
ⓘ Screening estimate from a state-policy table — verify with the county assessor before closing.
Climate risk First Street
- Flood 4/10 Moderate FEMA zone X (unshaded) · 22% chance over 30 yrs
- Wildfire 3/10 Moderate
- Heat 9/10 Extreme 7 d/yr ≥111°F today · 23 d/yr by 30 yrs out
- Wind 8/10 Severe 99% chance of damaging wind over 30 yrs
- Air quality 2/10 Low 1 unhealthy d/yr today · 2 by 30 yrs out
Nearby sold comps map
Loading sold comps map…
Walkable amenities ~0.75 mi
Loading nearby amenities…
Taxation est. · year 1
- Rental income
- $24,244
- − Mortgage interest
- −$12,603
- − Property taxes
- −$4,298
- − Insurance
- −$1,125
- − Repairs & maintenance
- −$1,940
- − Management
- −$1,940
- − HOA
- −$480
- − Depreciation
- −$6,545
- Taxable loss
- −$4,687
- Est. tax savings @ 24.0%
- +$1,125
- After-tax cash flow
- $216/yr
For passive investors: Depreciation is non-cash, so a rental often shows a tax loss while cash-flowing — sheltering income. Rental losses are passive: they offset passive income freely, and up to $25,000/yr can offset ordinary (W-2) income if you actively participate and your MAGI is under $100k (phasing out to $0 by $150k); unused losses carry forward. On sale, claimed depreciation is recaptured at up to 25%, and gains may owe capital-gains tax (a 1031 exchange can defer both). Figures are a year-1 estimate at your 24.0% rate — not tax advice; consult a CPA.
Schools (NCES district)
- District
- Katy ISD
- NCES district ID
- 4825170
- Math proficiency
- 61% ▼ -7.00%
- Reading proficiency
- 63% ▼ -3.00%
- Median HH income
- $90,312
- Composite
- 56.59/100
- National rank
- #1146
- State rank
- #29 of 826 in TX
Livability — Houston
- Score
- 74/100
- State rank
- #184
- US rank
- #4771
Category grades
Schools grade is shown separately in the Schools card above.
Census & demographics
- County
- Harris County · 4,702,590 people
- City population
- 3,226,434
- Metro
- Houston-The Woodlands-Sugar Land, TX
- Population (ZIP)
- 71,484
- Household income
- $118,464
- Rent vs Own
- Severe rent burden
- 913.0
Population outlook (Harris County) Hauer SSP2
- Today (2025)
- 5,571,493 people
- By 2030
- 6,089,821 · +9.3%
- By 2040
- 7,142,806 · +28.2%
- By 2050
- 8,185,864 · +46.9%
- By 2075
- 10,574,329 · +89.8%
- By 2100
- 12,109,958 · +117.4%
Race, ethnicity, and origin ACS 2023
- Neighborhood character
- Highly diverse neighborhood (Simpson 0.73)
- Race & ethnicity
- White 36% Hispanic / Latino 33% Two or more races 16% Black 15% Asian 12%
- Hispanic origin (detail)
- Mexican 20%
- Common ancestry
- Lithuanian 2% Slovak 1% Italian 1%
- Foreign-born
- 21% · Canada, Vietnam, Jamaica
- Languages at home
- 64% English-only · Spanish 22% Vietnamese 5% French/Haitian/Cajun 4%
Political lean MEDSL · Harris
- 2024 margin
- Lean D (+5.5) · D 52.0% · R 46.4% · Other 1.6%
- 2008→2024 swing
- +3.9pp toward D · 2008: 1.6pp · 2024: 5.5pp
- All cycles
- 2024: D+5.5 2020: D+13.3 2016: D+12.4 2012: D+0.1 2008: D+1.6
Not yet ingested
- Civics
- —
Market trends
- HPI YoY
- ▼ -140.65%
- Current HPI
- 233.1683
- Rent YoY
- ▼ -0.80%
- Metro
- Houston-The Woodlands-Sugar Land, TX
- State GDP YoY
- ▲ 3.95%
- F500 in state
- 110
Industry mix (Fortune 500 HQ in TX)
| Industry | F500 HQs | Revenue |
|---|---|---|
| Energy | 16 | $1,198B |
|
||
| Technology | 5 | $198B |
|
||
| Engineering / Construction | 4 | $72B |
|
||
| Energy Services | 3 | $60B |
|
||
| Utilities | 3 | $41B |
|
||
| Healthcare | 2 | $330B |
|
||
Price history
+400.0% since first listed15 events — show timeline
- 2026-03-20 Listed $225,000 HARMLS
- 2026-02-18 Listing Removed — HARMLS
- 2025-12-27 Price Changed $199,999 HARMLS
- 2025-10-07 Price Changed $234,900 HARMLS
- 2025-08-26 Listed $224,900 HARMLS
- 2018-11-09 Sold (Public Records) — Public Records
- 2018-11-08 Sold (MLS) — HARMLS
- 2018-10-09 Pending — HARMLS
- 2018-10-03 Pending — HARMLS
- 2018-10-03 Relisted — HARMLS
- 2018-10-02 Pending — HARMLS
- 2018-10-01 Listing Removed — HARMLS
- 2018-09-27 Listed $145,000 HARMLS
- 2009-04-14 Sold (Public Records) — Public Records
- 1995-09-28 Sold (Public Records) $45,000 Public Records
Property tax history
+3.9%/yrLatest (2025): $4,298 · +0.5% YoY. Source: county tax records.
Cash-flow waterfall
monthlySold comps — $/sqft
last 12 mo · ≤1 miLoading sold comps…