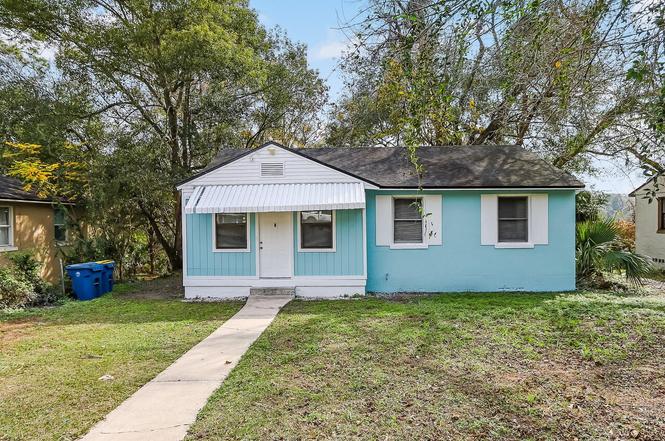
1328 Carvill Ave · Jacksonville, FL
Flood risk 4/10 · Minor
- FEMA flood zone
- X (unshaded)
- Chance of flooding over 30 yrs
- 0.21%
- Est. flood insurance / yr
- $507 – $1,088
Fire risk 3/10 · Minor
- Est. fire insurance / yr
- $947 – $1,759
Heat risk 9/10 · Severe
- Hot days now (above 107°F)
- 7 days/yr
- Hot days in 30 yrs
- 18 days/yr
Wind risk 9/10 · Severe
- Chance of severe wind over 30 yrs
- 99.0%
Air-quality risk 4/10 · Minor
- Unhealthy air days now
- 6 days/yr
- Unhealthy air days in 30 yrs
- 6 days/yr
Risk factors via First Street. Map © Google.
Why this score? — see what drove the C+ grade
The composite is a weighted blend of 9 inputs, each scored 0–100. Each bar is that input's sub-score; the figure is the points it added to the 100-point composite (weight × sub-score).
- Cash flow +25.1/30.0
- ARV discount +10.8/15.0
- DSCR +8.2/10.0
- 1% rule +6.7/10.0
- Livability +4.2/5.0
- Schools +3.9/10.0
- Condition / age +2.5/5.0
- Rent growth +2.2/5.0
- Appreciation +0.0/10.0
$107,500
🖨 Deal sheet 📄 Offer letter ✓ Due diligence
Listing remarks MLS
BUNGALOW HOME IN NEED OF TLC.SELLER TO MAKE 0.00 REPAIRS.SELLING IN AS IS CONDITION.SPECIAL ADDENDUM REQUIRED WITH PROOF OF FUND LETTER.CALL MARK OR KAREN FOR MORE INFORMATION. CALL TO MAKE APPT AND TO GET LOCK BOX COMBO.
Key facts
- Block stucco home
- Oversized lot
- Half an acre
Tags
Neighborhood map
What this means for you Summary
Snapshot
- This is a 3-bed/1.0-bath single-family listed at $108k.
Deal economics
- At list price, monthly cash flow is $239 ($3k/yr) — positive.
- The deal already cash-flows at list — no discount required.
- Meets the 1% rule at list price ($1k rent vs $108k).
- Recommended offer: $95k (12.0% below list) — sets the bar for market timing.
- Cap rate 9.0% vs local median 4.0% in Jacksonville — top-decile yield for the area; either an underpriced asset or a hidden risk that comps aren't pricing in. Stress-test before assuming the spread holds.
Location & tenants
- Location reads 83/100 on livability (#50 in FL, #911 nationally) — a professional / high-income tenant draw. Strengths: amenities A+, commute A+, housing A+.
- Duval (urban): math 46% / reading 45% proficiency, ranked #48 of 73 in FL (top 66%) — families likely to look elsewhere, expect single-tenant / working-renter base with shorter leases.
- Market conditions: Rents soft (-1.4%/yr); 291 active listings in the ZIP; 40 comparable units currently listed for rent nearby; rentals at typical pace (median 24d on market — plan ~3-4 weeks tenant-placement turnaround); lower-income renter base — watch delinquency; 6,503 units permitted in Duval County in 2024 (1,131 in 5+ unit buildings).
- This rent runs 37% of the median local income ($41k/yr) — at the standard rent-burdened threshold; future hikes will face affordability resistance.
Forward outlook
- Local home prices are declining (-3.0%/yr); year-one equity from $743 of loan paydown is wiped out by about $3k of value loss. Plan a longer hold.
- Duval County population projected at +19% by 2050 — long-run rental-demand tailwind backs the buy-and-hold thesis.
Negotiation context
- It's been on market 141 days — a 12% lower offer ($95k) is reasonable based on typical stale-listing flexibility.
- 4 sale attempts since 24y ago with the ask held roughly flat each time — persistent listings suggest the price (not the market) is what's stuck; bring a comps-based counter.
Risks & watch-outs
- Watch-outs: built in 1947 — expect roof / HVAC / electrical / plumbing capex.
- Climate carrying-cost: severe wind risk, 99% chance of damaging wind over 30y; extreme-heat days projected 7→18/yr by 2055 (HVAC capex compounding) — expect insurance premiums to compound above CPI over the hold.
Questions for the listing agent
- It's been on market 141 days. Have you received any prior offers? Is the seller open to a 12% concession, seller financing, or rate buy-down credit?
- Built in 1947 — when were the roof, HVAC, electrical panel, plumbing, and water heater last replaced?
- Why hasn't it sold? Are there any deal-killer items the seller is aware of (foundation, flood, title, zoning, code violations)?
- Is there a deadline driving the sale (1031 exchange, divorce, estate, relocation)? That informs how much negotiation room exists.
- Schools are B-rated — typically a magnet for longer-tenancy family renters. What's the average tenant stay here, and is there a school-zone premium baked into asking?
- What's the average days-on-market for RENTAL listings here right now (not sales)? A rising rental-DOM trend means longer vacancies and softer asking-rent achievability than the comps imply.
- What's the recent tenant-quality profile in this submarket — average credit score on applications, eviction rate, late-payment / NSF rate, and stable-employment percentage? A property-management company in the area should have these aggregated.
- How much new for-sale + rental construction is in the pipeline within 1–3 miles? Heavy new supply typically softens prices + rents 12–24 months out; constrained supply supports both.
Investment metrics
- 1% rule
- 1.17% ✓
- Cap rate
- 8.96%
- Cash-on-cash
- 9.52%
- DSCR
- 1.42
- GRM
- 7.1
CMA / ARV
- ARV (on-the-fly)
- $116,112
- Comps found
- 12
Show comp detail 12 sales within ~0.75 mi
| Address | Dist | Beds/Ba | Sqft | Sold | Price | $/sf | Match |
|---|---|---|---|---|---|---|---|
| 950 Ashton St | 0.31mi | 3/1.0 | 1,000 (+2%) | 4mo | $142,500 | $143 | 80 |
| 1011 Glencarin St | 0.29mi | 3/1.0 | 1,061 (+8%) | 7mo | $90,000 | $85 | 67 |
| 733 Escambia St | 0.67mi | 3/1.0 | 975 (-1%) | 0mo | $90,000 | $92 | 67 |
| 753 Fernway St | 0.50mi | 3/1.0 | 929 (-6%) | 1mo | $110,000 | $118 | 67 |
| 7400 Fernandina Ave | 0.43mi | 2/1.0 (-1) | 933 (-5%) | 1mo | $28,000 | $30 | 66 |
| 6320 Norwood Ave | 0.44mi | 2/1.0 (-1) | 1,050 (+7%) | 7mo | $65,601 | $62 | 58 |
| 7632 Lueders Ave | 0.70mi | 3/1.0 | 1,024 (+4%) | 6mo | $144,000 | $141 | 56 |
| 831 Ashford St | 0.38mi | 2/2.0 (-1) | 912 (-7%) | 8mo | $40,000 | $44 | 55 |
| 5752 Oprey St | 0.66mi | 3/2.0 | 912 (-7%) | 6mo | $110,000 | $121 | 48 |
| 1224 Kennard St | 0.54mi | 3/2.0 | 1,092 (+11%) | 6mo | $50,000 | $46 | 47 |
| 5298 Golfbrook Dr | 0.66mi | 2/1.0 (-1) | 875 (-11%) | 8mo | $116,500 | $133 | 39 |
| 825 Gates St | 0.73mi | 2/1.0 (-1) | 837 (-15%) | 4mo | $134,000 | $160 | 33 |
Match score weights: distance 35% · size 25% · config 20% · recency 20%. Top-matched comps best support the ARV.
Projected returns pro-forma
-3.0% appreciation · 0.0% rent growth · sell at horizon
- IRR
- -5.4%
- Equity multiple
- 0.80×
- Total profit
- $-5,871
- Equity at exit
- $16,029
- IRR
- 0.2%
- Equity multiple
- 1.01×
- Total profit
- $333
- Equity at exit
- $9,295
Cash invested: $30,100 (down + closing). Projections, not guarantees.
Landlord ↔ Tenant lean methodology
- Overall (STATE)
- 87 Strongly Landlord-Friendly
- State Florida
- 87 Strongly Landlord-Friendly · R+3
- County
- — inherits STATE
- City
- — inherits STATE
ZIP-level market 32208
- Home prices YoY
- -33.6%
- Rents YoY
- -1.4%
- Active inventory
- 291
- Price-to-rent
- 7.1×
Monthly cashflow live
- Estimated rent
- $1,258 high interval (Pro) →
- Mortgage (P&I)
- −$564
- Tax from tax record
- −$146 /mo · $1,755/yr
- Insurance
- −$45
- HOA
- −$0
- Vacancy / Maint / Mgmt
- −$264
- Net cashflow
- $239
Break-even live
UW: 25.0% down · 7.5% · 30yr · 1.5% tax · 5.0% vac · 8.0% maint · 8.0% mgmt
Financing live
Cash to close
- Down payment
- $26,875
- Closing costs
- $3,225
- Reserves months
- —
- Total cash needed
- —
Loan-product check · same deal, 3 products live
Conventional
25% down · 7.5% · 30yr
- Down + closing
- —
- Monthly P&I
- —
- Monthly cashflow
- —
- DSCR
- —
- Eligible?
- —
Personal DTI + credit; lowest rate.
DSCR
20% down · 8.5% · 30yr
- Down + closing
- —
- Monthly P&I
- —
- Monthly cashflow
- —
- DSCR
- —
- Eligible?
- —
No personal income docs; deal must DSCR.
Hard money
10% down · 12.0% · 12mo
- Down + closing
- —
- Monthly P&I
- —
- Monthly cashflow
- —
- DSCR
- —
- Eligible?
- —
Short-term bridge; refi at stabilization.
Rent comps 40 comps
| Address | Beds | Baths | Sqft | Rent | $/sqft | DOM | Units | Dist |
|---|---|---|---|---|---|---|---|---|
| 961 Dorchester St Jacksonville, FL | 2.0 | 1.0 | 884 | $1,025 | $1.16 | 3d | 1 | 0.25mi |
| 1059 Glencarin St Jacksonville, FL | 2.0 | 1.0 | 645 | $897 | $1.39 | 4d | 1 | 0.32mi |
| 1136 Maynard St Jacksonville, FL | 2.0 | 1.0 | 919 | $1,045 | $1.14 | 23d | 1 | 0.42mi |
| 1567 Rutledge Ave Jacksonville, FL | 3.0 | 2.0 | 1050 | $1,113 | $1.06 | 23d | 1 | 0.58mi |
| 1536 W 45th St Jacksonville, FL | 2.0 | 1.0 | 800 | $1,050 | $1.31 | 23d | 1 | 0.59mi |
| 7210 Elwood Ave Jacksonville, FL | 2.0 | 1.0 | 831 | $995 | $1.20 | 21d | 1 | 0.73mi |
| 5736 Teeler Ave Jacksonville, FL | 3.0 | 1.0 | 852 | $1,000 | $1.17 | 23d | 1 | 0.78mi |
| 535 W 59th St Jacksonville, FL | 3.0 | 2.0 | 816 | $1,395 | $1.71 | 7d | 1 | 0.81mi |
| 7927 Reid Ave Jacksonville, FL | 3.0 | 1.0 | 1055 | $1,500 | $1.42 | 23d | 1 | 0.82mi |
| 7511 N Shore Dr Jacksonville, FL | 2.0 | 1.0 | 1014 | $1,350 | $1.33 | 4d | 1 | 0.85mi |
| 7124 Lorain St Jacksonville, FL | 3.0 | 1.0 | 864 | $1,043 | $1.21 | 3d | 1 | 0.85mi |
| 5616 Calvin Ave Jacksonville, FL | 3.0 | 1.0 | 1008 | $1,195 | $1.19 | 7d | 1 | 0.88mi |
| 5514 Long St Jacksonville, FL | 2.0 | 1.0 | 941 | $1,250 | $1.33 | 1d | 1 | 0.88mi |
| 6460 Lanark Ave Jacksonville, FL | 2.0 | 1.0 | 708 | $1,095 | $1.55 | 23d | 1 | 0.89mi |
| 4813 Moncrief Rd Jacksonville, FL | 2.0–3.0 | 1.0 | 755 | $920 | $1.22 | 2d | 8 | 0.91mi |
| 385 Duray Ct Jacksonville, FL | 3.0 | 1.0 | 932 | $1,250 | $1.34 | 19d | 1 | 0.94mi |
| 356 Duray Ct Jacksonville, FL | 3.0 | 2.0 | 1070 | $1,425 | $1.33 | 13d | 1 | 0.98mi |
| 562 W 49th St Jacksonville, FL | 3.0 | 1.0 | 1091 | $1,195 | $1.10 | 23d | 1 | 0.98mi |
| 5352 Dodge Rd Jacksonville, FL | 3.0 | 2.0 | 1050 | $1,261 | $1.20 | 23d | 1 | 1.03mi |
| 1803 W 44th St Unit 1803 Jacksonville, FL | 2.0 | 1.0 | 750 | $950 | $1.27 | 7d | 1 | 1.05mi |
| 5350 Dodge Rd Jacksonville, FL | 3.0 | 1.0 | 1000 | $1,500 | $1.50 | 23d | 1 | 1.05mi |
| 1823 W 44th St Jacksonville, FL | 3.0 | 2.0 | 1066 | $1,500 | $1.41 | 23d | 1 | 1.07mi |
| 425 W 47th St Jacksonville, FL | 3.0 | 1.5 | 1083 | $1,193 | $1.10 | 7d | 1 | 1.07mi |
| 4721 E Castlewood Dr Jacksonville, FL | 3.0 | 1.0 | 1008 | $1,250 | $1.24 | 23d | 1 | 1.09mi |
| 319 W 49th St Jacksonville, FL | 2.0 | 1.0 | 977 | $1,200 | $1.23 | 23d | 1 | 1.11mi |
| 346 W 68th St Jacksonville, FL | 3.0 | 1.0 | 1114 | $1,385 | $1.24 | 4d | 1 | 1.14mi |
| 1653 W 35th St Jacksonville, FL | 2.0 | 1.0 | 800 | $825 | $1.03 | 23d | 1 | 1.15mi |
| 1551 W 33rd St #2 Jacksonville, FL | 2.0 | 1.0 | 842 | $795 | $0.94 | 20d | 1 | 1.17mi |
| 1959 W 45th St Jacksonville, FL | 2.0 | 1.0 | 895 | $1,245 | $1.39 | 13d | 1 | 1.19mi |
| 1417 W 31st St Jacksonville, FL | 3.0 | 1.0 | 880 | $1,100 | $1.25 | 1d | 1 | 1.20mi |
| 2312 Palmdale St Jacksonville, FL | 3.0 | 2.0 | 972 | $1,231 | $1.27 | 23d | 1 | 1.20mi |
| 4114 Moncrief Rd Jacksonville, FL | 2.0 | 1.0 | 821 | $975 | $1.19 | 7d | 1 | 1.21mi |
| 4114 Moncrief Rd Unit 2 Jacksonville, FL | 2.0 | 1.0 | 821 | $1,050 | $1.28 | 23d | 1 | 1.21mi |
| 1316 W 31st St Jacksonville, FL | 2.0 | 1.0 | 906 | $998 | $1.10 | 23d | 1 | 1.21mi |
| 912 Saratoga Blvd Jacksonville, FL | 3.0 | 1.0 | 930 | $1,250 | $1.34 | 23d | 1 | 1.24mi |
| 2092 Benedict Rd Jacksonville, FL | 3.0 | 1.0 | 816 | $1,095 | $1.34 | 23d | 1 | 1.25mi |
| 1196 W 30th St Jacksonville, FL | 2.0 | 1.0 | 875 | $880 | $1.01 | 17d | 1 | 1.26mi |
| 666 Basswood St Jacksonville, FL | 3.0 | 1.0 | 1002 | $1,400 | $1.40 | 23d | 1 | 1.28mi |
| 917 W 30th St Jacksonville, FL | 2.0 | 1.0 | 672 | $1,200 | $1.79 | 17d | 1 | 1.29mi |
| 1584 W 31st St Unit 3 Jacksonville, FL | 2.0 | 1.0 | 832 | $900 | $1.08 | 23d | 1 | 1.30mi |
Listing history 26 events
-
2026-03-26status Pending
-
2026-03-02historical Active Under Contract
-
2026-02-17price $107,500
-
2026-02-10price $110,000
-
2026-02-03price $112,500
-
2026-01-13status Active
-
2026-01-13price $115,000
-
2025-12-03historical
-
2025-11-18price $79,000
-
2025-11-13price $80,000
-
2025-11-04price $85,000
-
2025-10-28price $90,000
-
2025-10-22price $95,000
-
2025-10-14price $99,000
-
2025-10-09price $100,000
-
2025-09-26$109,000 Active
-
2025-08-26soldstatus $1,750,000
-
2025-04-29soldstatus $958,345
-
2004-09-24soldstatus $80,000
-
2003-12-10historical
-
2003-09-10$69,900
-
2003-01-21soldstatus $36,000
-
2002-11-21soldstatus $25,900 221-char remark
Show marketing remark (221 chars)
BUNGALOW HOME IN NEED OF TLC.SELLER TO MAKE 0.00 REPAIRS.SELLING IN AS IS CONDITION.SPECIAL ADDENDUM REQUIRED WITH PROOF OF FUND LETTER.CALL MARK OR KAREN FOR MORE INFORMATION. CALL TO MAKE APPT AND TO GET LOCK BOX COMBO.
-
2002-10-24$25,900 221-char remark
Show marketing remark (221 chars)
BUNGALOW HOME IN NEED OF TLC.SELLER TO MAKE 0.00 REPAIRS.SELLING IN AS IS CONDITION.SPECIAL ADDENDUM REQUIRED WITH PROOF OF FUND LETTER.CALL MARK OR KAREN FOR MORE INFORMATION. CALL TO MAKE APPT AND TO GET LOCK BOX COMBO.
-
1999-06-24soldstatus $57,000
-
1986-10-01soldstatus $32,500
ⓘ Source: listings_history table (triggers on properties + properties_extension) + one-shot
backfill from property_details.listing_events for pre-trigger history.
Tax reassessment forecast FL · Resets to sale price
- Current annual tax
- $1,755 · $146/mo
- Projected year-2 tax
- $1,755 · $146/mo
- Expected delta
- $0/yr ($0/mo · 0.0%)
ⓘ Screening estimate from a state-policy table — verify with the county assessor before closing.
Climate risk First Street
- Flood 4/10 Moderate FEMA zone X (unshaded) · 21% chance over 30 yrs
- Wildfire 3/10 Moderate
- Heat 9/10 Extreme 7 d/yr ≥107°F today · 18 d/yr by 30 yrs out
- Wind 9/10 Extreme 99% chance of damaging wind over 30 yrs
- Air quality 4/10 Moderate 6 unhealthy d/yr today · 6 by 30 yrs out
Nearby sold comps map
Loading sold comps map…
Walkable amenities ~0.75 mi
Loading nearby amenities…
Taxation est. · year 1
- Rental income
- $15,093
- − Mortgage interest
- −$6,022
- − Property taxes
- −$1,755
- − Insurance
- −$538
- − Repairs & maintenance
- −$1,207
- − Management
- −$1,207
- − Depreciation
- −$3,127
- Taxable income
- $1,236
- Est. tax owed @ 24.0%
- −$297
- After-tax cash flow
- $2,569/yr
For passive investors: Depreciation is non-cash, so a rental often shows a tax loss while cash-flowing — sheltering income. Rental losses are passive: they offset passive income freely, and up to $25,000/yr can offset ordinary (W-2) income if you actively participate and your MAGI is under $100k (phasing out to $0 by $150k); unused losses carry forward. On sale, claimed depreciation is recaptured at up to 25%, and gains may owe capital-gains tax (a 1031 exchange can defer both). Figures are a year-1 estimate at your 24.0% rate — not tax advice; consult a CPA.
Schools (NCES district)
- District
- Duval
- NCES district ID
- 1200480
- Math proficiency
- 46% ▼ -11.00%
- Reading proficiency
- 45% ▼ -4.00%
- Median HH income
- $48,987
- Composite
- 38.97/100
- National rank
- #4076
- State rank
- #48 of 73 in FL
Livability — Jacksonville
- Score
- 83/100
- State rank
- #50
- US rank
- #911
Category grades
Schools grade is shown separately in the Schools card above.
Census & demographics
- Census place
- Jacksonville, FL
- County
- Duval County · 1,015,274 people
- City population
- 979,034
- Metro
- Jacksonville, FL
- Population (ZIP)
- 32,699
- Household income
- $41,324
- Rent vs Own
- Severe rent burden
- 1765.0
Population outlook (Duval County) Hauer SSP2
- Today (2025)
- 1,013,010 people
- By 2030
- 1,059,228 · +4.6%
- By 2040
- 1,141,439 · +12.7%
- By 2050
- 1,205,258 · +19.0%
- By 2075
- 1,324,282 · +30.7%
- By 2100
- 1,319,620 · +30.3%
Race, ethnicity, and origin ACS 2023
- Neighborhood character
- Predominantly Black (77%)
- Race & ethnicity
- Black 77% White 16% Two or more races 4% Hispanic / Latino 3%
- Common ancestry
- Italian 1%
- Foreign-born
- 2% · Canada
- Languages at home
- 97% English-only · Spanish 2%
Political lean MEDSL · Duval
- 2024 margin
- Toss-up / Even · D 48.7% · R 50.1% · Other 1.2%
- 2008→2024 swing
- +0.4pp no change · 2008: -1.9pp · 2024: -1.5pp
- All cycles
- 2024: R+1.5 2020: D+3.8 2016: R+1.5 2012: R+3.6 2008: R+1.9
Not yet ingested
- Civics
- —
Market trends
- HPI YoY
- ▼ -110.56%
- Current HPI
- 217.9706
- Rent YoY
- ▼ -1.36%
- Metro
- Jacksonville, FL
- State GDP YoY
- ▲ 3.28%
- F500 in state
- 36
Industry mix (Fortune 500 HQ in FL)
| Industry | F500 HQs | Revenue |
|---|---|---|
| Industrial Technology | 2 | $29B |
|
||
| Insurance | 2 | $17B |
|
||
| Retail | 1 | $60B |
|
||
| Technology Distribution | 1 | $58B |
|
||
| Homebuilding | 1 | $35B |
|
||
| Technology Manufacturing | 1 | $35B |
|
||
Price history
+230.8% since first listed26 events — show timeline
- 2026-03-26 Pending — realMLS
- 2026-03-02 Contingent — realMLS
- 2026-02-17 Price Changed $107,500 realMLS
- 2026-02-10 Price Changed $110,000 realMLS
- 2026-02-03 Price Changed $112,500 realMLS
- 2026-01-13 Relisted — realMLS
- 2026-01-13 Price Changed $115,000 realMLS
- 2025-12-03 Listing Removed — realMLS
- 2025-11-18 Price Changed $79,000 realMLS
- 2025-11-13 Price Changed $80,000 realMLS
- 2025-11-04 Price Changed $85,000 realMLS
- 2025-10-28 Price Changed $90,000 realMLS
- 2025-10-22 Price Changed $95,000 realMLS
- 2025-10-14 Price Changed $99,000 realMLS
- 2025-10-09 Price Changed $100,000 realMLS
- 2025-09-26 Listed $109,000 realMLS
- 2025-08-26 Sold (Public Records) $1,750,000 Public Records
- 2025-04-29 Sold (Public Records) $958,345 Public Records
- 2004-09-24 Sold (Public Records) $80,000 Public Records
- 2003-12-10 Listing Removed — realMLS
- 2003-09-10 Listed $69,900 realMLS
- 2003-01-21 Sold (Public Records) $36,000 Public Records
- 2002-11-21 Sold (MLS) $25,900 realMLS
- 2002-10-24 Listed $25,900 realMLS
- 1999-06-24 Sold (Public Records) $57,000 Public Records
- 1986-10-01 Sold (Public Records) $32,500 Public Records
Property tax history
+8.7%/yrLatest (2025): $1,755 · +22.3% YoY. Source: county tax records.
Cash-flow waterfall
monthlySold comps — $/sqft
last 12 mo · ≤1 miLoading sold comps…