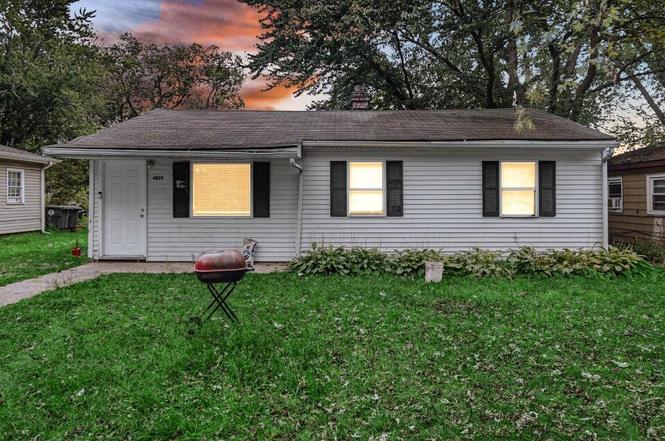
4079 Missouri St · Hobart, IN
Flood risk 1/10 · Minimal
- FEMA flood zone
- X (unshaded)
- Chance of flooding over 30 yrs
- 0.0%
- Est. flood insurance / yr
- $507 – $1,088
Fire risk 2/10 · Minimal
- Est. fire insurance / yr
- $717 – $1,331
Heat risk 2/10 · Minimal
- Hot days now (above 102°F)
- 7 days/yr
- Hot days in 30 yrs
- 15 days/yr
Wind risk 2/10 · Minimal
- Chance of severe wind over 30 yrs
- —
Air-quality risk 3/10 · Minor
- Unhealthy air days now
- 2 days/yr
- Unhealthy air days in 30 yrs
- 3 days/yr
Risk factors via First Street. Map © Google.
Why this score? — see what drove the D grade
The composite is a weighted blend of 9 inputs, each scored 0–100. Each bar is that input's sub-score; the figure is the points it added to the 100-point composite (weight × sub-score).
- Cash flow +20.3/30.0
- DSCR +6.4/10.0
- 1% rule +5.0/10.0
- Rent growth +3.9/5.0
- Livability +3.5/5.0
- Schools +3.3/10.0
- Condition / age +2.5/5.0
- ARV discount +0.0/15.0
- Appreciation +0.0/10.0
$149,900
🖨 Deal sheet 📄 Offer letter ✓ Due diligence
Listing remarks MLS
REO - SOLD AS IS. CASH ONLY OFFERS. THIS HOME HAS A TON OF POTENTIAL! LOCATED IN AN ESTABLISHED NEIGHBORHOOD AND CLOSE TO MAJOR HIGHWAYS. CALL FOR YOUR PRIVATE SHOWING TODAY.
Key facts
- Wooded lot
- Private driveway
- Large back yard
Tags
Property features AI
Finance
- Other: Occupant: Vacant
Exterior
- Parking: Driveway parking; On-street parking
- Security: Smoke detector(s)
- Utilities: Electricity connected; Public water; Public sewer; Natural gas connected
- Home design: Single-story home; Built in 1958
- Construction: Aluminum siding; Shingle roof; One level
- Exterior features: No notable exterior features listed; No pool; No view
Interior
- Kitchen: Gas range; Refrigerator
- Bedrooms: Primary bedroom; Bedroom 2; Bedroom 3; Bonus room
- Flooring: Vinyl
- Bathrooms: 1 full bathroom
- Heating & cooling: Forced air heating (natural gas); Central air conditioning
- Interior features: No additional interior features listed; Smoke detectors
- Laundry & utility: Washer hookup; Gas dryer hookup
Neighborhood map
What this means for you Summary
Snapshot
- This is a 3-bed/1.0-bath single-family listed at $150k.
Deal economics
- At list price, monthly cash flow is $192 ($2k/yr) — positive.
- The deal already cash-flows at list — no discount required.
- Meets the 1% rule at list price ($2k rent vs $150k).
- Recommended offer: $132k (12.0% below list) — sets the bar for market timing.
- Cap rate 7.8% vs local median 4.2% in Hobart — top-decile yield for the area; either an underpriced asset or a hidden risk that comps aren't pricing in. Stress-test before assuming the spread holds.
Location & tenants
- Location reads 69/100 on livability (#196 in IN) — a middle-class / working-renter tenant base. Strengths: cost of living A+, housing A+, crime B; Watch: schools D, amenities F, commute F.
- School City Of Hobart (suburban): math 30% / reading 45% proficiency, ranked #161 of 301 in IN (top 54%) — families likely to look elsewhere, expect single-tenant / working-renter base with shorter leases.
- Market conditions: Rents rising fast (+5.6%/yr); 255 active listings in the ZIP; 14 comparable units currently listed for rent nearby; rentals leasing fast (median 6d on market — plan ~1-2 weeks tenant-placement turnaround); solid renter incomes; 1,642 units permitted in Lake County in 2024 (14 in 5+ unit buildings).
Forward outlook
- Local home prices are declining (-3.0%/yr); year-one equity from $1k of loan paydown is wiped out by about $4k of value loss. Plan a longer hold.
- Lake County population projected to shrink 7% by 2050 — rents likely to lag national; underwrite the cash flow, not the appreciation.
Negotiation context
- It's been on market 128 days — a 12% lower offer ($132k) is reasonable based on typical stale-listing flexibility.
- 7 sale attempts since 28y ago; this cycle's ask has dropped $20k (12%) from the opening price — seller is motivated, your offer sets the floor, not the list.
Risks & watch-outs
- Watch-outs: built in 1958 — expect roof / HVAC / electrical / plumbing capex.
Questions for the listing agent
- It's been on market 128 days. Have you received any prior offers? Is the seller open to a 12% concession, seller financing, or rate buy-down credit?
- Built in 1958 — when were the roof, HVAC, electrical panel, plumbing, and water heater last replaced?
- Why hasn't it sold? Are there any deal-killer items the seller is aware of (foundation, flood, title, zoning, code violations)?
- Is there a deadline driving the sale (1031 exchange, divorce, estate, relocation)? That informs how much negotiation room exists.
- Schools are D-rated, which usually means shorter tenancies and higher turnover. Who's the typical renter profile here, and what's been the actual vacancy rate?
- The area grade is low — what's the realistic commute time and amenity access for the typical tenant pool here? Any planned neighborhood developments (good or bad) we should know about?
- What's the average days-on-market for RENTAL listings here right now (not sales)? A rising rental-DOM trend means longer vacancies and softer asking-rent achievability than the comps imply.
- What's the recent tenant-quality profile in this submarket — average credit score on applications, eviction rate, late-payment / NSF rate, and stable-employment percentage? A property-management company in the area should have these aggregated.
- How much new for-sale + rental construction is in the pipeline within 1–3 miles? Heavy new supply typically softens prices + rents 12–24 months out; constrained supply supports both.
Investment metrics
- 1% rule
- 1.00% ✓
- Cap rate
- 7.83%
- Cash-on-cash
- 5.50%
- DSCR
- 1.24
- GRM
- 8.3
CMA / ARV
- ARV (on-the-fly)
- $122,130
- Comps found
- 12
Show comp detail 12 sales within ~0.75 mi
| Address | Dist | Beds/Ba | Sqft | Sold | Price | $/sf | Match |
|---|---|---|---|---|---|---|---|
| 4171 W 39th Ave | 0.24mi | 3/1.0 | 1,084 (+5%) | 1mo | $95,000 | $88 | 80 |
| 3790 Swift St | 0.41mi | 3/1.0 | 1,036 (+0%) | 6mo | $85,000 | $82 | 76 |
| 4055 Kentucky St | 0.56mi | 3/1.0 | 1,000 (-3%) | 1mo | $50,000 | $50 | 68 |
| 4125 Alabama St | 0.16mi | 3/1.0 | 925 (-11%) | 9mo | $96,850 | $105 | 67 |
| 3979 Howard St | 0.22mi | 3/1.0 | 884 (-15%) | 2mo | $175,000 | $198 | 64 |
| 4069 W 39th Ave | 0.27mi | 3/1.0 | 925 (-11%) | 9mo | $195,000 | $211 | 62 |
| 2501 E 36th Ave | 0.65mi | 3/1.0 | 1,044 (+1%) | 11mo | $62,000 | $59 | 59 |
| 2600 E 36th Ave | 0.70mi | 4/1.0 (+1) | 1,060 (+2%) | 3mo | $172,500 | $163 | 55 |
| 1407 E 36th Ave | 0.68mi | 3/1.0 | 950 (-8%) | 3mo | $55,100 | $58 | 52 |
| 4042 Ohio St | 0.47mi | 3/1.0 | 925 (-11%) | 11mo | $134,000 | $145 | 51 |
| 3753 Montgomery St | 0.62mi | 3/1.0 | 920 (-11%) | 4mo | $159,999 | $174 | 50 |
| 4241 Tennessee St | 0.54mi | 3/1.0 | 884 (-15%) | 9mo | $104,000 | $118 | 43 |
Match score weights: distance 35% · size 25% · config 20% · recency 20%. Top-matched comps best support the ARV.
Projected returns pro-forma
-3.0% appreciation · 5.63% rent growth · sell at horizon
- IRR
- -4.9%
- Equity multiple
- 0.81×
- Total profit
- $-7,953
- Equity at exit
- $22,351
- IRR
- 7.5%
- Equity multiple
- 1.63×
- Total profit
- $26,542
- Equity at exit
- $12,961
Cash invested: $41,972 (down + closing). Projections, not guarantees.
Landlord ↔ Tenant lean methodology
- Overall (STATE)
- 90 Strongly Landlord-Friendly
- State Indiana
- 90 Strongly Landlord-Friendly · R+11
- County
- — inherits STATE
- City
- — inherits STATE
ZIP-level market 46342
- Rents YoY
- 5.6%
- Active inventory
- 255
- Price-to-rent
- 8.3×
Monthly cashflow live
- Estimated rent
- $1,505 high interval (Pro) →
- Mortgage (P&I)
- −$786
- Tax from tax record
- −$148 /mo · $1,773/yr
- Insurance
- −$62
- HOA
- −$0
- Vacancy / Maint / Mgmt
- −$316
- Net cashflow
- $192
Break-even live
UW: 25.0% down · 7.5% · 30yr · 1.5% tax · 5.0% vac · 8.0% maint · 8.0% mgmt
Financing live
Cash to close
- Down payment
- $37,475
- Closing costs
- $4,497
- Reserves months
- —
- Total cash needed
- —
Loan-product check · same deal, 3 products live
Conventional
25% down · 7.5% · 30yr
- Down + closing
- —
- Monthly P&I
- —
- Monthly cashflow
- —
- DSCR
- —
- Eligible?
- —
Personal DTI + credit; lowest rate.
DSCR
20% down · 8.5% · 30yr
- Down + closing
- —
- Monthly P&I
- —
- Monthly cashflow
- —
- DSCR
- —
- Eligible?
- —
No personal income docs; deal must DSCR.
Hard money
10% down · 12.0% · 12mo
- Down + closing
- —
- Monthly P&I
- —
- Monthly cashflow
- —
- DSCR
- —
- Eligible?
- —
Short-term bridge; refi at stabilization.
Rent comps 14 comps
| Address | Beds | Baths | Sqft | Rent | $/sqft | DOM | Units | Dist |
|---|---|---|---|---|---|---|---|---|
| 3820 Colbourne St Hobart, IN | 3.0 | 2.0 | 1209 | $1,695 | $1.40 | 43d | 1 | 0.40mi |
| 3852 Sandusky St Hobart, IN | 4.0 | 1.0 | 1209 | $1,800 | $1.49 | 16d | 1 | 0.42mi |
| 4009 Kentucky St Gary, IN | 4.0 | 1.0 | 1307 | $1,595 | $1.22 | 43d | 1 | 0.57mi |
| 4416 Vermont Ct Gary, IN | 3.0 | 1.0 | 1162 | $1,350 | $1.16 | 43d | 1 | 0.74mi |
| 816 E 35th Ct Gary, IN | 2.0 | 1.0 | 810 | $1,075 | $1.33 | 1d | 1 | 1.04mi |
| 4905 Kentucky St Unit 4901 Gary, IN | 3.0 | 1.0 | 950 | $1,525 | $1.61 | 24d | 1 | 1.17mi |
| 4974 Tennessee St Gary, IN | 2.0 | 1.0 | 1100 | $1,175 | $1.07 | 19d | 1 | 1.22mi |
| 4456 Connecticut St Gary, IN | 3.0 | 1.0 | 1044 | $1,300 | $1.25 | 2d | 1 | 1.23mi |
| 801 E 32nd Ave Unit 2 Gary, IN | 2.0 | 1.0 | 850 | $1,300 | $1.53 | 1d | 1 | 1.30mi |
| 5026 Kentucky St Gary, IN | 3.0 | 1.0 | 1200 | $1,100 | $0.92 | 6d | 1 | 1.30mi |
| 4430 Broadway Gary, IN | 3.0 | 1.0 | 1200 | $1,250 | $1.04 | 1d | 1 | 1.34mi |
| 3395 Pennsylvania St Gary, IN | 3.0 | 1.0 | 1300 | $1,495 | $1.15 | 1d | 1 | 1.39mi |
| 5001 Carolina St Gary, IN | 3.0 | 1.0 | 875 | $1,350 | $1.54 | 2d | 1 | 1.39mi |
| 3753 Englehart St Lake Station, IN | 3.0 | 1.0 | 1224 | $1,450 | $1.18 | 1d | 1 | 1.42mi |
Listing history 29 events
-
2026-06-18days on market $149,900 Active 128 DOM
-
2026-06-17days on market $149,900 Active 127 DOM
-
2026-06-16days on market $149,900 Active 126 DOM
-
2026-06-15days on market $149,900 Active 125 DOM
-
2026-06-13days on market $149,900 Active 123 DOM
-
2026-06-13days on market $149,900 Active 122 DOM
-
2026-06-09days on market $149,900 Active 119 DOM
-
2026-06-08days on market $149,900 Active 118 DOM
-
2026-06-07days on market $149,900 Active 117 DOM
-
2026-06-04days on market $149,900 Active 114 DOM
-
2026-06-03days on market $149,900 Active 113 DOM
-
2026-06-02days on market $149,900 Active 112 DOM
-
2026-06-01days on market $149,900 Active 111 DOM
-
2026-05-31days on market $149,900 Active 110 DOM
-
2026-04-01price $149,900
-
2026-03-02price $159,900
-
2026-02-20price $164,900
-
2026-02-10$169,900 Active
-
2026-01-31historical $1,375
-
2026-01-14$1,375
-
2025-02-01historical
-
2024-10-28price $140,000
-
2024-10-07$144,990 Active
-
2009-04-01$8,900 174-char remark
Show marketing remark (174 chars)
REO - SOLD AS IS. CASH ONLY OFFERS. THIS HOME HAS A TON OF POTENTIAL! LOCATED IN AN ESTABLISHED NEIGHBORHOOD AND CLOSE TO MAJOR HIGHWAYS. CALL FOR YOUR PRIVATE SHOWING TODAY.
-
1999-02-04$36,900
-
1999-01-26historical
-
1998-08-13$55,250
-
1998-07-09historical
-
1998-01-08$51,500
ⓘ Source: listings_history table (triggers on properties + properties_extension) + one-shot
backfill from property_details.listing_events for pre-trigger history.
Tax reassessment forecast IN · Partial reset (capped growth)
- Current annual tax
- $1,773 · $148/mo
- Projected year-2 tax
- $1,773 · $148/mo
- Expected delta
- $0/yr ($0/mo · 0.0%)
ⓘ Screening estimate from a state-policy table — verify with the county assessor before closing.
Climate risk First Street
- Flood 1/10 Low FEMA zone X (unshaded) · 0% chance over 30 yrs
- Wildfire 2/10 Low
- Heat 2/10 Low 7 d/yr ≥102°F today · 15 d/yr by 30 yrs out
- Wind 2/10 Low
- Air quality 3/10 Moderate 2 unhealthy d/yr today · 3 by 30 yrs out
Nearby sold comps map
Loading sold comps map…
Walkable amenities ~0.75 mi
Loading nearby amenities…
Taxation est. · year 1
- Rental income
- $18,055
- − Mortgage interest
- −$8,397
- − Property taxes
- −$1,773
- − Insurance
- −$750
- − Repairs & maintenance
- −$1,444
- − Management
- −$1,444
- − Depreciation
- −$4,361
- Taxable loss
- −$113
- Est. tax savings @ 24.0%
- +$27
- After-tax cash flow
- $2,336/yr
For passive investors: Depreciation is non-cash, so a rental often shows a tax loss while cash-flowing — sheltering income. Rental losses are passive: they offset passive income freely, and up to $25,000/yr can offset ordinary (W-2) income if you actively participate and your MAGI is under $100k (phasing out to $0 by $150k); unused losses carry forward. On sale, claimed depreciation is recaptured at up to 25%, and gains may owe capital-gains tax (a 1031 exchange can defer both). Figures are a year-1 estimate at your 24.0% rate — not tax advice; consult a CPA.
Schools (NCES district)
- District
- School City Of Hobart
- NCES district ID
- 1804590
- Math proficiency
- 30% ▼ -14.00%
- Reading proficiency
- 45% ▼ -7.00%
- Median HH income
- $55,967
- Composite
- 32.93/100
- National rank
- #5594
- State rank
- #161 of 301 in IN
Livability — Hobart
- Score
- 69/100
- State rank
- #196
- US rank
- #8834
Category grades
Schools grade is shown separately in the Schools card above.
Census & demographics
- Census place
- Hobart, IN
- County
- Lake County · 422,878 people
- City population
- 32,224
- Metro
- Chicago-Naperville-Elgin, IL-IN-WI
- Population (ZIP)
- 32,224
- Household income
- $75,521
- Rent vs Own
- Severe rent burden
- 1033.0
Population outlook (Lake County) Hauer SSP2
- Today (2025)
- 484,026 people
- By 2030
- 478,091 · -1.2%
- By 2040
- 462,974 · -4.3%
- By 2050
- 449,894 · -7.1%
- By 2075
- 436,169 · -9.9%
- By 2100
- 426,607 · -11.9%
Race, ethnicity, and origin ACS 2023
- Neighborhood character
- Predominantly White (66%)
- Race & ethnicity
- White 66% Hispanic / Latino 21% Two or more races 10% Black 10% Asian 1%
- Hispanic origin (detail)
- Mexican 15% Puerto Rican 5%
- Common ancestry
- Romanian 11% Iranian 2% Lithuanian 1%
- Foreign-born
- 5% · Canada, China
- Languages at home
- 87% English-only · Spanish 9% Russian/Polish/Slavic 2% Chinese 1%
Political lean MEDSL · Lake
- 2024 margin
- Lean D (+5.6) · D 52.1% · R 46.5% · Other 1.5%
- 2008→2024 swing
- -28.6pp toward R · 2008: 34.3pp · 2024: 5.6pp
- All cycles
- 2024: D+5.6 2020: D+15.1 2016: D+20.6 2012: D+31.0 2008: D+34.3
Not yet ingested
- Civics
- —
Market trends
- HPI YoY
- ▼ -167.01%
- Current HPI
- 260.2635
- Rent YoY
- ▲ 5.63%
- Metro
- Chicago-Naperville-Elgin, IL-IN-WI
- State GDP YoY
- ▲ 2.90%
- F500 in state
- 18
Industry mix (Fortune 500 HQ in IN)
| Industry | F500 HQs | Revenue |
|---|---|---|
| Industrial Machinery | 2 | $37B |
|
||
| Healthcare | 1 | $177B |
|
||
| Pharmaceuticals | 1 | $45B |
|
||
| Metals / Steel | 1 | $18B |
|
||
| Agriculture | 1 | $17B |
|
||
| Packaging | 1 | $12B |
|
||
Price history
+191.1% since first listed15 events — show timeline
- 2026-04-01 Price Changed $149,900 NIRA MLS as Distributed by MLS Grid
- 2026-03-02 Price Changed $159,900 NIRA MLS as Distributed by MLS Grid
- 2026-02-20 Price Changed $164,900 NIRA MLS as Distributed by MLS Grid
- 2026-02-10 Listed $169,900 NIRA MLS as Distributed by MLS Grid
- 2026-01-31 Rental Removed $1,375 TENANTTURNER2
- 2026-01-14 Listed for Rent $1,375 TENANTTURNER2
- 2025-02-01 Listing Removed — NIRA MLS as Distributed by MLS Grid
- 2024-10-28 Price Changed $140,000 NIRA MLS as Distributed by MLS Grid
- 2024-10-07 Listed $144,990 NIRA MLS as Distributed by MLS Grid
- 2009-04-01 Listed $8,900 NIRA MLS as Distributed by MLS Grid
- 1999-02-04 Listed $36,900 NIRA MLS as Distributed by MLS Grid
- 1999-01-26 Listing Removed — NIRA MLS as Distributed by MLS Grid
- 1998-08-13 Listed $55,250 NIRA MLS as Distributed by MLS Grid
- 1998-07-09 Listing Removed — NIRA MLS as Distributed by MLS Grid
- 1998-01-08 Listed $51,500 NIRA MLS as Distributed by MLS Grid
Property tax history
+0.3%/yrLatest (2024): $1,773 · +0.4% YoY. Source: county tax records.
Cash-flow waterfall
monthlySold comps — $/sqft
last 12 mo · ≤1 miLoading sold comps…