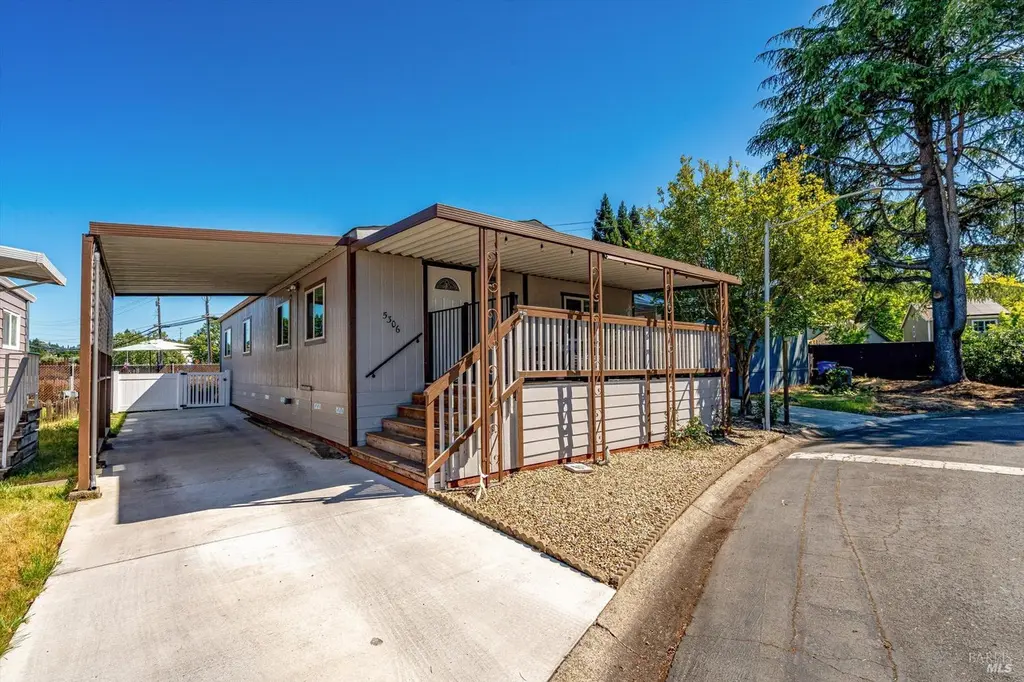
5306 Rexford Way · Larkfield-Wikiup, CA
Flood risk 1/10 · Minimal
- FEMA flood zone
- X (unshaded)
- Chance of flooding over 30 yrs
- 0.0%
- Est. flood insurance / yr
- $507 – $1,088
Fire risk 6/10 · Moderate
- Est. fire insurance / yr
- $659 – $1,223
Heat risk 4/10 · Minor
- Hot days now (above 90°F)
- 7 days/yr
- Hot days in 30 yrs
- 15 days/yr
Wind risk 1/10 · Minimal
- Chance of severe wind over 30 yrs
- —
Air-quality risk 9/10 · Severe
- Unhealthy air days now
- 18 days/yr
- Unhealthy air days in 30 yrs
- 20 days/yr
Risk factors via First Street. Map © Google.
Why this score? — see what drove the C- grade
The composite is a weighted blend of 9 inputs, each scored 0–100. Each bar is that input's sub-score; the figure is the points it added to the 100-point composite (weight × sub-score).
- Cash flow +17.6/30.0
- ARV discount +7.5/15.0
- DSCR +5.5/10.0
- Appreciation +5.0/10.0
- 1% rule +4.7/10.0
- Condition / age +3.8/5.0
- Schools +3.7/10.0
- Rent growth +2.5/5.0
- Livability +2.5/5.0
$259,000
🖨 Deal sheet (PDF) 📄 Offer letter ✓ Due diligence
Listing remarks
Welcome to this beautifully refreshed 2-bedroom, 2-bath home in an all-age park in Northwest Santa Rosa. Updated prior to the current owner's purchase in 2024, this home offers a newer roof, dual-pane windows, stylish kitchen with updated cabinets and appliances, newer flooring, newer furnace & water heater, and modern lighting. The covered front deck creates a welcoming outdoor space to relax and unwind. Centrally located near everyday conveniences, this move-in ready home combines comfort, style, and convenience.
Key facts
- Updated appliances
- Updated cabinets
- Newer flooring
Tags
Property features AI
Finance
- Financial info: Monthly land lease: $1,019
- HOA & community: No association; Not a senior community
Exterior
- Parking: 2 parking spaces; Covered parking; Off-street parking
- Utilities: Individual electric meter; Individual gas meter; Public sewer
- Home design: Manufactured in park; Double wide
- Construction: Sunwood make; Manufactured by Skyline Homes; Wood skirting
- Exterior features: Composition roof; Located in Redwood Village (manufactured home park)
Interior
- Bedrooms: 2 bedrooms
- Flooring: Laminate; Tile
- Bathrooms: 2 full bathrooms; Shower stall(s); Tub with shower over
- Heating & cooling: Central heating; Ceiling fan(s)
- Interior features: Cathedral/vaulted living room ceiling; Laminate flooring; Tile flooring
- Laundry & utility: Laundry area inside the home
Neighborhood map
What this means for you Summary
Snapshot
- This is a 2-bed/2.0-bath manufactured listed at $259k. Condition is rated good.
Deal economics
- At list price, monthly cash flow is $203 ($2k/yr) — positive.
- The deal already cash-flows at list — no discount required.
- To meet the 1% rule (rent ≥ 1% of price), the offer needs to be $252k (2.6% below list).
- Recommended offer: $251k (3.0% below list) — sets the bar for market timing.
- Cap rate 7.2% vs local median 2.1% in Larkfield-Wikiup — top-decile yield for the area; either an underpriced asset or a hidden risk that comps aren't pricing in. Stress-test before assuming the spread holds.
Location & tenants
- Location reads: area grade C — affects rentability + tenant quality, not the cash-flow math above.
- Santa Rosa High (urban): math 31% / reading 47% proficiency, ranked #703 of 1,400 in CA (top 50%) — families likely to look elsewhere, expect single-tenant / working-renter base with shorter leases.
- Market conditions: 6 active listings in the ZIP; 6 comparable units currently listed for rent nearby; rentals at typical pace (median 14d on market — plan ~3-4 weeks tenant-placement turnaround); 1,039 units permitted in Sonoma County in 2024 (185 in 5+ unit buildings).
Forward outlook
- In year one you build about $10k of equity ($2k loan paydown + $8k appreciation (3.0% local appreciation)).
- Sonoma County population projected at +8% by 2050 — modest demand growth; plan on rents tracking national, not racing it.
- At projected returns (3.0% appreciation + 3.0% rent growth), your $73k cash investment doubles in ~6 years — after that, you're playing with house money.
- By year 4, paydown + projected appreciation supports a ~$32k cash-out refi (75% LTV) — recoverable capital for the next deal without selling this one.
Negotiation context
- It's been on market 42 days — a 3% lower offer ($251k) is reasonable based on typical stale-listing flexibility.
Risks & watch-outs
- Climate carrying-cost: major wildfire risk — expect insurance premiums to compound above CPI over the hold.
Questions for the listing agent
- It's been on market 42 days. Have you received any prior offers? Is the seller open to a 3% concession, seller financing, or rate buy-down credit?
- Is there a deadline driving the sale (1031 exchange, divorce, estate, relocation)? That informs how much negotiation room exists.
- What's the average days-on-market for RENTAL listings here right now (not sales)? A rising rental-DOM trend means longer vacancies and softer asking-rent achievability than the comps imply.
- What's the recent tenant-quality profile in this submarket — average credit score on applications, eviction rate, late-payment / NSF rate, and stable-employment percentage? A property-management company in the area should have these aggregated.
- How much new for-sale + rental construction is in the pipeline within 1–3 miles? Heavy new supply typically softens prices + rents 12–24 months out; constrained supply supports both.
Investment metrics
- 1% rule
- 0.97% ✗
- Cap rate
- 7.23%
- Cash-on-cash
- 3.36%
- DSCR
- 1.15
- GRM
- 8.6
CMA / ARV
- ARV (on-the-fly)
- $163,300
- Comps found
- 12
Show comp detail 12 sales within ~0.75 mi
| Address | Dist | Beds/Ba | Sqft | Sold | Price | $/sf | Match |
|---|---|---|---|---|---|---|---|
| 5306 Rexford Way | 0.00mi | 2/2.0 | 1,150 (0%) | 1mo | $255,000 | $222 | 99 |
| 5306 Rexford Way #56 | 0.03mi | 2/2.0 | 1,150 (0%) | 19mo | $228,000 | $198 | 83 |
| 5318 Huckleberry Way | 0.08mi | 3/2.0 (+1) | 1,100 (-4%) | 8mo | $135,000 | $123 | 77 |
| 5300 Rexford #5300 | 0.01mi | 3/2.0 (+1) | 1,248 (+8%) | 6mo | $145,000 | $116 | 75 |
| 5308 Rexford Way | 0.00mi | 3/2.0 (+1) | 1,248 (+8%) | 12mo | $187,000 | $150 | 70 |
| 5241 Whispering Crk | 0.64mi | 2/2.0 | 1,224 (+6%) | 2mo | $191,000 | $156 | 58 |
| 5215 Gayle Dr | 0.68mi | 2/2.0 | 1,120 (-3%) | 9mo | $175,000 | $156 | 56 |
| 50 Plymouth Way | 0.73mi | 2/2.0 | 1,120 (-3%) | 11mo | $156,000 | $139 | 53 |
| 612 Colonial Park Dr | 0.72mi | 2/2.0 | 1,200 (+4%) | 10mo | $165,000 | $138 | 51 |
| 541 Colonial Park Dr | 0.74mi | 2/2.0 | 1,152 (+0%) | 18mo | $115,000 | $100 | 50 |
| 216 Colonial Park Dr | 0.74mi | 2/2.0 | 1,060 (-8%) | 12mo | $150,000 | $142 | 42 |
| 634 Colonial Park Dr | 0.69mi | 2/2.0 | 1,000 (-13%) | 7mo | $118,000 | $118 | 40 |
Match score weights: distance 35% · size 25% · config 20% · recency 20%. Top-matched comps best support the ARV.
Projected returns pro-forma
3.0% appreciation · 3.0% rent growth · sell at horizon
- IRR
- 10.6%
- Equity multiple
- 1.61×
- Total profit
- $44,186
- Equity at exit
- $116,458
- IRR
- 12.9%
- Equity multiple
- 2.92×
- Total profit
- $139,245
- Equity at exit
- $179,475
Cash invested: $72,520 (down + closing). Projections, not guarantees.
Landlord ↔ Tenant lean methodology
- Overall (STATE)
- 18 Strongly Tenant-Friendly
- State California
- 18 Strongly Tenant-Friendly · D+13
- County
- — inherits STATE
- City
- — inherits STATE
ZIP-level market 95043
- Active inventory
- 6
- Price-to-rent
- 8.6×
Monthly cashflow live
- Estimated rent
- $2,523 high interval (Pro) →
- Mortgage (P&I)
- −$1,358
- Tax est. 1.5%
- −$324 /mo · $3,885/yr
- Insurance
- −$108
- HOA
- −$0
- Vacancy / Maint / Mgmt
- −$530
- Net cashflow
- $203
Break-even live
Sensitivity live
| Price | -10% $382 | -5% $293 | +0% $203 | +5% $114 | +10% $24 |
|---|---|---|---|---|---|
| Rent | -10% $4 | -5% $104 | +0% $203 | +5% $303 | +10% $403 |
| Rate | -1.0pp $334 | -0.5pp $269 | base $203 | +0.5pp $136 | +1.0pp $68 |
UW: 25.0% down · 7.5% · 30yr · 1.5% tax · 5.0% vac · 8.0% maint · 8.0% mgmt
Financing live
Cash to close
- Down payment
- $64,750
- Closing costs
- $7,770
- Reserves months
- —
- Total cash needed
- —
Loan-product check · same deal, 3 products live
Conventional
25% down · 7.5% · 30yr
- Down + closing
- —
- Monthly P&I
- —
- Monthly cashflow
- —
- DSCR
- —
- Eligible?
- —
Personal DTI + credit; lowest rate.
DSCR
20% down · 8.5% · 30yr
- Down + closing
- —
- Monthly P&I
- —
- Monthly cashflow
- —
- DSCR
- —
- Eligible?
- —
No personal income docs; deal must DSCR.
Hard money
10% down · 12.0% · 12mo
- Down + closing
- —
- Monthly P&I
- —
- Monthly cashflow
- —
- DSCR
- —
- Eligible?
- —
Short-term bridge; refi at stabilization.
Rent comps 6 comps
| Address | Beds | Baths | Sqft | Rent | $/sqft | DOM | Units | Dist |
|---|---|---|---|---|---|---|---|---|
| 193 Airport Blvd E Santa Rosa, CA | 1.0–2.0 | 1.0–1.5 | 967 | $2,760 | $2.85 | 13d | 1 | 0.19mi |
| 5256 Old Redwood Hwy Unit 31 Santa Rosa, CA | 2.0 | 2.0 | 950 | $2,200 | $2.32 | 14d | 1 | 0.25mi |
| 5252 Old Redwood Hwy Unit 20 Santa Rosa, CA | 2.0 | 1.0 | 900 | $2,000 | $2.22 | 14d | 1 | 0.26mi |
| 5223 Old Redwood Hwy Santa Rosa, CA | 2.0 | 1.0 | 915 | $3,200 | $3.50 | 13d | 1 | 0.38mi |
| 5209 Old Redwood Hwy Santa Rosa, CA | 2.0 | 2.0 | 1014 | $2,450 | $2.42 | 22d | 1 | 0.42mi |
| 211 Shiloh Rd Windsor, CA | 2.0 | 1.0 | 814 | $3,095 | $3.80 | 14d | 1 | 1.37mi |
Listing history 3 events
-
2026-05-21status Pending
-
2026-04-26historical Contingent (Show)
-
2026-04-09$259,000 Active
ⓘ Source: listings_history table (triggers on properties + properties_extension) + one-shot
backfill from property_details.listing_events for pre-trigger history.
Climate risk First Street
- Flood 1/10 Low FEMA zone X (unshaded) · 0% chance over 30 yrs
- Wildfire 6/10 Major
- Heat 4/10 Moderate 7 d/yr ≥90°F today · 15 d/yr by 30 yrs out
- Wind 1/10 Low
- Air quality 9/10 Extreme 18 unhealthy d/yr today · 20 by 30 yrs out
Nearby sold comps map
Loading sold comps map…
Walkable amenities ~0.75 mi
Loading nearby amenities…
Taxation est. · year 1
- Rental income
- $30,276
- − Mortgage interest
- −$14,508
- − Property taxes
- −$3,885
- − Insurance
- −$1,295
- − Repairs & maintenance
- −$2,422
- − Management
- −$2,422
- − Depreciation
- −$7,535
- Taxable loss
- −$1,791
- Est. tax savings @ 24.0%
- +$430
- After-tax cash flow
- $2,869/yr
For passive investors: Depreciation is non-cash, so a rental often shows a tax loss while cash-flowing — sheltering income. Rental losses are passive: they offset passive income freely, and up to $25,000/yr can offset ordinary (W-2) income if you actively participate and your MAGI is under $100k (phasing out to $0 by $150k); unused losses carry forward. On sale, claimed depreciation is recaptured at up to 25%, and gains may owe capital-gains tax (a 1031 exchange can defer both). Figures are a year-1 estimate at your 24.0% rate — not tax advice; consult a CPA.
Condition & rehab AI · 1 photo
This move-in ready manufactured home has been updated with a newer roof, dual-pane windows, and modern appliances, making it a great investment opportunity.
Value-add opportunities
- Resale Paint the exterior siding — Enhances curb appeal and protects the siding
- Both Replace the front door — Improves security and enhances curb appeal
- Both Install new outdoor lighting — Enhances safety and curb appeal
Renovation cost estimate screening
Value-add ROI direction
- Resale Paint the exterior siding — Enhances curb appeal and protects the siding ↑
- Both Replace the front door — Improves security and enhances curb appeal ↑
- Both Install new outdoor lighting — Enhances safety and curb appeal ↑
ⓘ Cost ranges are severity-bucket heuristics (US national rule-of-thumb). Get contractor quotes + a written scope before underwriting a rehab budget.
Schools (NCES district)
- District
- Santa Rosa High
- NCES district ID
- 0635830
- Math proficiency
- 31% —
- Reading proficiency
- 47% —
- Median HH income
- $62,000
- Composite
- 37.25/100
- National rank
- #8972
- State rank
- #703 of 1400 in CA
Livability — Larkfield-Wikiup
No livability data for this city. (Only ~50 U.S. cities are tracked.)
Census & demographics
- Census place
- Larkfield-Wikiup, CA
- City population
- 45,570
- Population (ZIP)
- 673
Population outlook (Sonoma County) Hauer SSP2
- Today (2025)
- 539,935 people
- By 2030
- 554,870 · +2.8%
- By 2040
- 573,262 · +6.2%
- By 2050
- 580,715 · +7.6%
- By 2075
- 579,229 · +7.3%
- By 2100
- 547,835 · +1.5%
Race, ethnicity, and origin ACS 2023
- Neighborhood character
- Predominantly White (79%)
- Race & ethnicity
- White 79% Hispanic / Latino 16% Two or more races 11%
- Hispanic origin (detail)
- Mexican 16%
- Common ancestry
- Lithuanian 6% Serbian 5% Russian 3%
- Foreign-born
- 8% · Canada
- Languages at home
- 85% English-only · Spanish 15%
Political lean MEDSL · Sonoma
- 2024 margin
- Solid D (+46.2) · D 71.4% · R 25.2% · Other 3.3%
- 2008→2024 swing
- -3.4pp toward R · 2008: 49.6pp · 2024: 46.2pp
- All cycles
- 2024: D+46.2 2020: D+51.5 2016: D+47.9 2012: D+44.9 2008: D+49.6
Not yet ingested
- Civics
- —
Market trends
- HPI YoY
- —
- Current HPI
- —
- Rent YoY
- —
- Metro
- —
- State GDP YoY
- ▲ 3.21%
- F500 in state
- 116
Industry mix (Fortune 500 HQ in CA)
| Industry | F500 HQs | Revenue |
|---|---|---|
| Technology | 27 | $1,492B |
|
||
| Financial Services | 3 | $174B |
|
||
| Retail | 3 | $44B |
|
||
| Insurance | 3 | $26B |
|
||
| Media / Entertainment | 2 | $115B |
|
||
| Pharmaceuticals / Biotech | 2 | $62B |
|
||
Price history
3 events — show timeline
- 2026-05-21 Pending — BAREIS
- 2026-04-26 Contingent — BAREIS
- 2026-04-09 Listed $259,000 BAREIS
Cash-flow waterfall
monthlySold comps — $/sqft
last 12 mo · ≤1 miLoading sold comps…