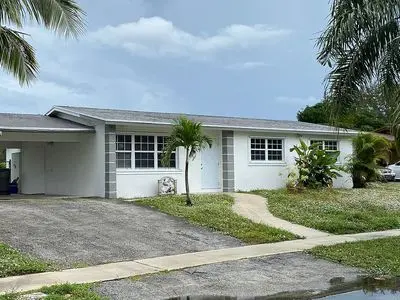
3603 Everglades Rd · Cabana Colony, FL
Flood risk 1/10 · Minimal
- FEMA flood zone
- X (unshaded)
- Chance of flooding over 30 yrs
- 0.0%
- Est. flood insurance / yr
- $507 – $1,088
Fire risk 1/10 · Minimal
- Est. fire insurance / yr
- $947 – $1,759
Heat risk 10/10 · Severe
- Hot days now (above 106°F)
- 7 days/yr
- Hot days in 30 yrs
- 26 days/yr
Wind risk 10/10 · Severe
- Chance of severe wind over 30 yrs
- 99.0%
Air-quality risk 2/10 · Minimal
- Unhealthy air days now
- 1 days/yr
- Unhealthy air days in 30 yrs
- 2 days/yr
Risk factors via First Street. Map © Google.
Why this score? — see what drove the D grade
The composite is a weighted blend of 9 inputs, each scored 0–100. Each bar is that input's sub-score; the figure is the points it added to the 100-point composite (weight × sub-score).
- Cash flow +13.7/30.0
- ARV discount +7.3/15.0
- Schools +4.3/10.0
- DSCR +4.1/10.0
- 1% rule +3.8/10.0
- Livability +3.6/5.0
- Rent growth +3.1/5.0
- Condition / age +2.5/5.0
- Appreciation +0.0/10.0
$379,000
🖨 Deal sheet (PDF) 📄 Offer letter ✓ Due diligence
Listing remarks
Beautiful, completely renovated single family home in the heart of Palm Beach Gardens. Brand new ac and air ducts. All new bathrooms, tile floors, doors (exterior, interior, and closet), fans, lights, and hardware. Newly painted inside and out. stainless steal kitchen appliances. Large gated back yard. Has a separate laundry room, front yard, and carport. NEW Florida Room provides extra space and comfort. Room for a pool. A must see!
Key facts
- Tile floors
- Completely renovated
- New bathrooms
Tags
Neighborhood map
What this means for you Summary
Snapshot
- This is a 3-bed/2.0-bath single-family listed at $379k.
Deal economics
- At list price, monthly cash flow is $27 ($321/yr) — positive.
- The deal already cash-flows at list — no discount required.
- To meet the 1% rule (rent ≥ 1% of price), the offer needs to be $334k (11.8% below list).
- Recommended offer: $334k (11.8% below list) — sets the bar for 1% rule.
Location & tenants
- Location reads 72/100 on livability (#346 in FL) — a middle-class / working-renter tenant base. Strengths: crime A+, housing A+, employment A-; Watch: amenities F, commute F, health & safety D-.
- Palm Beach (suburban): math 46% / reading 53% proficiency, ranked #34 of 73 in FL (top 47%) — families likely to look elsewhere, expect single-tenant / working-renter base with shorter leases.
- Zoned schools: Dwight D. Eisenhower Elementary School (math 52% / reading 52%, grade C-, #990 of 2,144 statewide, top 48%, 432 students, 56% FRL); Howell L. Watkins Middle School (math 18% / reading 33%, grade F, #512 of 571 statewide, top 90%, 794 students, 76% FRL); William T. Dwyer High School (math 36% / reading 58%, grade D-, #207 of 667 statewide, top 32%, 2,206 students, 37% FRL) — zoned schools at 57% FRL track the district average.
- Market conditions: Rents rising (+2.5%/yr); 309 active listings in the ZIP; 32 comparable units currently listed for rent nearby; rentals at typical pace (median 26d on market — plan ~3-4 weeks tenant-placement turnaround); solid renter incomes; 3,974 units permitted in Palm Beach County in 2024 (1,012 in 5+ unit buildings).
- This rent runs 42% of the median local income ($95k/yr) — at the standard rent-burdened threshold; future hikes will face affordability resistance.
Forward outlook
- Local home prices are declining (-3.0%/yr); year-one equity from $3k of loan paydown is wiped out by about $11k of value loss. Plan a longer hold.
- Palm Beach County population projected at +30% by 2050 — long-run rental-demand tailwind backs the buy-and-hold thesis.
Negotiation context
- Only 1 days on market — expect competitive offers; lowballing is unlikely to land.
- 9 sale attempts since 24y ago with the ask held roughly flat each time — persistent listings suggest the price (not the market) is what's stuck; bring a comps-based counter.
- Current owner paid $180k; list at $379k implies a 111% gain — meaningful room to come down on a strong offer.
Risks & watch-outs
- Climate carrying-cost: severe wind risk, 99% chance of damaging wind over 30y; extreme-heat days projected 7→26/yr by 2055 (HVAC capex compounding) — expect insurance premiums to compound above CPI over the hold.
Questions for the listing agent
- Is there a deadline driving the sale (1031 exchange, divorce, estate, relocation)? That informs how much negotiation room exists.
- Schools are D-rated, which usually means shorter tenancies and higher turnover. Who's the typical renter profile here, and what's been the actual vacancy rate?
- The area grade is low — what's the realistic commute time and amenity access for the typical tenant pool here? Any planned neighborhood developments (good or bad) we should know about?
- What's the average days-on-market for RENTAL listings here right now (not sales)? A rising rental-DOM trend means longer vacancies and softer asking-rent achievability than the comps imply.
- What's the recent tenant-quality profile in this submarket — average credit score on applications, eviction rate, late-payment / NSF rate, and stable-employment percentage? A property-management company in the area should have these aggregated.
- How much new for-sale + rental construction is in the pipeline within 1–3 miles? Heavy new supply typically softens prices + rents 12–24 months out; constrained supply supports both.
Investment metrics
- 1% rule
- 0.88% ✗
- Cap rate
- 6.38%
- Cash-on-cash
- 0.30%
- DSCR
- 1.01
- GRM
- 9.4
CMA / ARV
- ARV (on-the-fly)
- $377,300
- Comps found
- 1
Show comp detail 1 sale within ~0.75 mi
| Address | Dist | Beds/Ba | Sqft | Sold | Price | $/sf | Match |
|---|---|---|---|---|---|---|---|
| 3773 Bahama Rd | 0.22mi | 3/1.5 | 1,200 (+9%) | 12mo | $411,250 | $343 | 63 |
Match score weights: distance 35% · size 25% · config 20% · recency 20%. Top-matched comps best support the ARV.
Projected returns pro-forma
-3.0% appreciation · 2.49% rent growth · sell at horizon
- IRR
- -16.4%
- Equity multiple
- 0.42×
- Total profit
- $-61,372
- Equity at exit
- $56,510
- IRR
- -9.0%
- Equity multiple
- 0.45×
- Total profit
- $-57,989
- Equity at exit
- $32,769
Cash invested: $106,120 (down + closing). Projections, not guarantees.
Landlord ↔ Tenant lean methodology
- Overall (STATE)
- 87 Strongly Landlord-Friendly
- State Florida
- 87 Strongly Landlord-Friendly · R+3
- County
- — inherits STATE
- City
- — inherits STATE
ZIP-level market 33410
- Rents YoY
- 2.5%
- Active inventory
- 309
- Price-to-rent
- 9.4×
Monthly cashflow live
- Estimated rent
- $3,343 high interval (Pro) →
- Mortgage (P&I)
- −$1,988
- Tax from tax record
- −$469 /mo · $5,626/yr
- Insurance
- −$158
- HOA
- −$0
- Vacancy / Maint / Mgmt
- −$702
- Net cashflow
- $27
Break-even live
Sensitivity live
| Price | -10% $241 | -5% $134 | +0% $27 | +5% $-81 | +10% $-188 |
|---|---|---|---|---|---|
| Rent | -10% $-237 | -5% $-105 | +0% $27 | +5% $159 | +10% $291 |
| Rate | -1.0pp $218 | -0.5pp $123 | base $27 | +0.5pp $-71 | +1.0pp $-171 |
UW: 25.0% down · 7.5% · 30yr · 1.5% tax · 5.0% vac · 8.0% maint · 8.0% mgmt
Financing live
Cash to close
- Down payment
- $94,750
- Closing costs
- $11,370
- Reserves months
- —
- Total cash needed
- —
Loan-product check · same deal, 3 products live
Conventional
25% down · 7.5% · 30yr
- Down + closing
- —
- Monthly P&I
- —
- Monthly cashflow
- —
- DSCR
- —
- Eligible?
- —
Personal DTI + credit; lowest rate.
DSCR
20% down · 8.5% · 30yr
- Down + closing
- —
- Monthly P&I
- —
- Monthly cashflow
- —
- DSCR
- —
- Eligible?
- —
No personal income docs; deal must DSCR.
Hard money
10% down · 12.0% · 12mo
- Down + closing
- —
- Monthly P&I
- —
- Monthly cashflow
- —
- DSCR
- —
- Eligible?
- —
Short-term bridge; refi at stabilization.
Rent comps 32 comps
| Address | Beds | Baths | Sqft | Rent | $/sqft | DOM | Units | Dist |
|---|---|---|---|---|---|---|---|---|
| 3640 Gull Rd Palm Beach Gardens, FL | 3.0 | 2.0 | 1382 | $2,975 | $2.15 | 9d | 1 | 0.10mi |
| 12015 Colony Ave Palm Beach Gardens, FL | 3.0 | 2.0 | 1104 | $3,100 | $2.81 | 24d | 1 | 0.20mi |
| 12015 Colony Ave Palm Beach Gardens, FL | 3.0 | 2.0 | 1104 | $3,100 | $2.81 | 26d | 1 | 0.20mi |
| 3818 Everglades Rd Palm Beach Gardens, FL | 4.0 | 1.5 | 1381 | $3,000 | $2.17 | 26d | 1 | 0.21mi |
| 3745 Atlantic Rd Unit 3745 Palm Beach Gardens, FL | 4.0 | 2.0 | 1119 | $2,900 | $2.59 | 26d | 1 | 0.23mi |
| 11900 Valencia Gardens Ave Palm Beach Gardens, FL | 1.0–3.0 | 1.0–2.0 | 980 | $3,032 | $3.09 | 0d | 18 | 0.30mi |
| 3270 Grove Rd Unit 1326860P Palm Beach Gardens, FL | 3.0 | 2.0 | 1496 | $5,492 | $3.67 | 0d | 1 | 0.36mi |
| 2916 Tuscany Ct #201 Palm Beach Gardens, FL | 2.0 | 2.0 | 1149 | $3,200 | $2.79 | 5d | 1 | 0.65mi |
| 2916 Tuscany Ct Palm Beach Gardens, FL | 3.0 | 2.0 | 1278 | $2,818 | $2.21 | 26d | 1 | 0.65mi |
| 2813 Grande Pkwy #109 Palm Beach Gardens, FL | 3.0 | 2.0 | 1278 | $2,818 | $2.21 | 26d | 1 | 0.79mi |
| 2802 Sarento Pl #204 Palm Beach Gardens, FL | 2.0 | 2.0 | 1092 | $3,500 | $3.21 | 26d | 1 | 0.80mi |
| 2727 Anzio Ct #106 Palm Beach Gardens, FL | 3.0 | 2.0 | 1316 | $3,000 | $2.28 | 26d | 1 | 0.84mi |
| 2805 Veronia Dr Palm Beach Gardens, FL | 3.0 | 2.0 | 1361 | $3,000 | $2.20 | 26d | 1 | 0.85mi |
| 113 Evergrene Pkwy Palm Beach Gardens, FL | 2.0 | 2.0 | 1144 | $3,700 | $3.23 | 5d | 1 | 0.89mi |
| 801 Sabal Ridge Cir Unit H Palm Beach Gardens, FL | 2.0 | 2.0 | 1400 | $2,900 | $2.07 | 26d | 1 | 1.04mi |
| 11021 Legacy Ln #303 Palm Beach Gardens, FL | 2.0 | 2.0 | 1403 | $2,950 | $2.10 | 26d | 1 | 1.05mi |
| 11023 Legacy Ln #204 Palm Beach Gardens, FL | 2.0 | 2.0 | 1309 | $3,500 | $2.67 | 26d | 1 | 1.08mi |
| 3955 Design Center Dr Palm Beach Gardens, FL | 3.0 | 1.0–2.0 | 996 | $4,108 | $4.12 | 0d | 22 | 1.14mi |
| 233 Evergrene Pkwy Palm Beach Gardens, FL | 2.0 | 2.0 | 1144 | $3,250 | $2.84 | 24d | 1 | 1.17mi |
| 113 Evergrene Pkwy Unit 3-A Palm Beach Gardens, FL | 2.0 | 2.0 | 1144 | $3,700 | $3.23 | 26d | 1 | 1.18mi |
| 11028 Legacy Dr #203 Palm Beach Gardens, FL | 2.0 | 2.0 | 1309 | $4,000 | $3.06 | 26d | 1 | 1.21mi |
| 11024 Legacy Dr #104 Palm Beach Gardens, FL | 2.0 | 2.0 | 1345 | $6,000 | $4.46 | 26d | 1 | 1.21mi |
| 11011 Legacy Dr #306 Palm Beach Gardens, FL | 2.0 | 2.0 | 1403 | $4,350 | $3.10 | 26d | 1 | 1.23mi |
| 2388 S Wallen Dr West Palm Beach, FL | 3.0 | 2.0 | 1296 | $4,500 | $3.47 | 26d | 1 | 1.25mi |
| 3660 RCA Blvd Palm Beach Gardens, FL | 1.0–2.0 | 1.0–2.0 | 1524 | $6,849 | $4.49 | 3d | 30 | 1.31mi |
| 2395 Idlewild Rd Palm Beach Gardens, FL | 3.0 | 2.0 | 1476 | $4,500 | $3.05 | 24d | 1 | 1.32mi |
| 4045 Central Gardens Way Palm Beach Gardens, FL | 1.0–3.0 | 1.0–2.0 | 1175 | $3,772 | $3.21 | 1d | 19 | 1.33mi |
| 3319 Central Gardens Cir Unit Elite Palm Beach Gardens, FL | 2.0 | 2.0 | 1415 | $3,470 | $2.45 | 0d | 1 | 1.41mi |
| 3319 Central Gardens Cir Unit Elite Palm Beach Gardens, FL | 2.0 | 2.0 | 1415 | $3,201 | $2.26 | 12d | 1 | 1.41mi |
| 7102 Geminata Oak Ct Unit 7102 Palm Beach Gardens, FL | 2.0 | 2.0 | 1152 | $3,200 | $2.78 | 9d | 1 | 1.42mi |
| 10201 Chapman Oak Ct Palm Beach Gardens, FL | 2.0 | 2.0 | 1152 | $4,000 | $3.47 | 26d | 1 | 1.44mi |
| 3333 Central Gardens Cir Palm Beach Gardens, FL | 2.0–3.0 | 2.0 | 1597 | $4,169 | $2.61 | 4d | 5 | 1.47mi |
Listing history 25 events
-
2026-05-26$379,000 Active
-
2019-03-11soldstatus $180,000
-
2016-05-01historical
-
2014-10-25historical
-
2013-09-21historical
-
2009-06-02historical
-
2008-10-03$158,900
-
2008-03-12historical
-
2007-08-29$157,950
-
2006-11-27$259,000
-
2006-03-10$287,000
-
2005-05-13soldstatus $249,900
-
2005-05-10soldstatus $249,900
-
2005-05-02historical
-
2005-03-30soldstatus $235,000
-
2005-02-11historical
-
2005-01-26$235,000
-
2005-01-13$249,900
-
2004-01-05soldstatus $155,000
-
2003-10-03$159,900
-
2002-07-22soldstatus $129,000
-
2002-07-19soldstatus $129,000
-
2002-04-14$129,900
-
1998-08-18soldstatus $75,000
-
1987-12-01soldstatus $55,000
ⓘ Source: listings_history table (triggers on properties + properties_extension) + one-shot
backfill from property_details.listing_events for pre-trigger history.
Tax reassessment forecast FL · Resets to sale price
- Current annual tax
- $5,626 · $469/mo
- Projected year-2 tax
- $5,626 · $469/mo
- Expected delta
- $0/yr ($0/mo · 0.0%)
ⓘ Screening estimate from a state-policy table — verify with the county assessor before closing.
Climate risk First Street
- Flood 1/10 Low FEMA zone X (unshaded) · 0% chance over 30 yrs
- Wildfire 1/10 Low
- Heat 10/10 Extreme 7 d/yr ≥106°F today · 26 d/yr by 30 yrs out
- Wind 10/10 Extreme 99% chance of damaging wind over 30 yrs
- Air quality 2/10 Low 1 unhealthy d/yr today · 2 by 30 yrs out
Nearby sold comps map
Loading sold comps map…
Walkable amenities ~0.75 mi
Loading nearby amenities…
Taxation est. · year 1
- Rental income
- $40,116
- − Mortgage interest
- −$21,230
- − Property taxes
- −$5,626
- − Insurance
- −$1,895
- − Repairs & maintenance
- −$3,209
- − Management
- −$3,209
- − Depreciation
- −$11,025
- Taxable loss
- −$6,079
- Est. tax savings @ 24.0%
- +$1,459
- After-tax cash flow
- $1,780/yr
For passive investors: Depreciation is non-cash, so a rental often shows a tax loss while cash-flowing — sheltering income. Rental losses are passive: they offset passive income freely, and up to $25,000/yr can offset ordinary (W-2) income if you actively participate and your MAGI is under $100k (phasing out to $0 by $150k); unused losses carry forward. On sale, claimed depreciation is recaptured at up to 25%, and gains may owe capital-gains tax (a 1031 exchange can defer both). Figures are a year-1 estimate at your 24.0% rate — not tax advice; consult a CPA.
Schools (NCES district)
- District
- Palm Beach
- NCES district ID
- 1201500
- Math proficiency
- 46% ▼ -16.00%
- Reading proficiency
- 53% ▼ -4.00%
- Median HH income
- $53,943
- Composite
- 42.72/100
- National rank
- #3160
- State rank
- #34 of 73 in FL
Livability — Cabana Colony
- Score
- 72/100
- State rank
- #346
- US rank
- #5999
Category grades
Schools grade is shown separately in the Schools card above.
Census & demographics
- Census place
- Cabana Colony, FL
- County
- Palm Beach County · 1,438,312 people
- Metro
- Miami-Fort Lauderdale-Pompano Beach, FL
- Population (ZIP)
- 36,759
- Household income
- $94,530
- Rent vs Own
- Severe rent burden
- 1429.0
Population outlook (Palm Beach County) Hauer SSP2
- Today (2025)
- 1,637,487 people
- By 2030
- 1,743,255 · +6.5%
- By 2040
- 1,948,712 · +19.0%
- By 2050
- 2,132,979 · +30.3%
- By 2075
- 2,530,027 · +54.5%
- By 2100
- 2,706,979 · +65.3%
Race, ethnicity, and origin ACS 2023
- Neighborhood character
- Predominantly White (70%)
- Race & ethnicity
- White 70% Hispanic / Latino 15% Two or more races 13% Black 5% Asian 4%
- Hispanic origin (detail)
- Mexican 2% Puerto Rican 2% Cuban 3%
- Common ancestry
- Romanian 4% Lithuanian 3% Slovak 2%
- Foreign-born
- 17% · Canada, Jamaica, Vietnam
- Languages at home
- 78% English-only · Spanish 13% French/Haitian/Cajun 3% Other Indo-European 2%
Political lean MEDSL · Palm Beach
- 2024 margin
- Toss-up / Even · D 50.0% · R 49.2%
- 2008→2024 swing
- -22.1pp toward R · 2008: 22.9pp · 2024: 0.8pp
- All cycles
- 2024: D+0.8 2020: D+12.8 2016: D+15.3 2012: D+17.0 2008: D+22.9
Not yet ingested
- Civics
- —
Market trends
- HPI YoY
- ▼ -346.12%
- Current HPI
- 375.5381
- Rent YoY
- ▲ 2.49%
- Metro
- Miami-Fort Lauderdale-Pompano Beach, FL
- State GDP YoY
- ▲ 3.28%
- F500 in state
- 36
Industry mix (Fortune 500 HQ in FL)
| Industry | F500 HQs | Revenue |
|---|---|---|
| Industrial Technology | 2 | $29B |
|
||
| Insurance | 2 | $17B |
|
||
| Retail | 1 | $60B |
|
||
| Technology Distribution | 1 | $58B |
|
||
| Homebuilding | 1 | $35B |
|
||
| Technology Manufacturing | 1 | $35B |
|
||
Price history
+589.1% since first listed25 events — show timeline
- 2026-05-26 Listed $379,000 FSBO.com
- 2019-03-11 Sold (Public Records) $180,000 Public Records
- 2016-05-01 Listing Removed — Beaches MLS
- 2014-10-25 Listing Removed — Beaches MLS
- 2013-09-21 Listing Removed — Beaches MLS
- 2009-06-02 Listing Removed — Beaches MLS
- 2008-10-03 Listed $158,900 Beaches MLS
- 2008-03-12 Listing Removed — Beaches MLS
- 2007-08-29 Listed $157,950 Beaches MLS
- 2006-11-27 Listed $259,000 Beaches MLS
- 2006-03-10 Listed $287,000 Beaches MLS
- 2005-05-13 Sold (Public Records) $249,900 Public Records
- 2005-05-10 Sold (MLS) $249,900 Beaches MLS
- 2005-05-02 Listing Removed — Beaches MLS
- 2005-03-30 Sold (MLS) $235,000 Beaches MLS
- 2005-02-11 Listing Removed — Beaches MLS
- 2005-01-26 Listed $235,000 Beaches MLS
- 2005-01-13 Listed $249,900 Beaches MLS
- 2004-01-05 Sold (Public Records) $155,000 Public Records
- 2003-10-03 Listed $159,900 Beaches MLS
- 2002-07-22 Sold (Public Records) $129,000 Public Records
- 2002-07-19 Sold (MLS) $129,000 Beaches MLS
- 2002-04-14 Listed $129,900 Beaches MLS
- 1998-08-18 Sold (Public Records) $75,000 Public Records
- 1987-12-01 Sold (Public Records) $55,000 Public Records
Property tax history
+7.2%/yrLatest (2025): $5,626 · +3.7% YoY. Source: county tax records.
Cash-flow waterfall
monthlySold comps — $/sqft
last 12 mo · ≤1 miLoading sold comps…